Introduction
Ecosystem succession is characterized by an initial build-up phase during which nutrients accumulate, resulting in a maximum biomass phase (Odum Reference Odum1969; Grime Reference Grime2001; Walker & del Moral Reference Walker and del Moral2003). However, in the long-term absence of major disturbance (normally in the order of millennia), ecosystem retrogression occurs, which involves increasing nutrient limitation and a decline in plant productivity and standing biomass, as well as corresponding impairment of belowground processes (Walker et al. Reference Walker, Thompson and Jehne1983; Wardle et al. Reference Wardle, Walker and Bardgett2004; Peltzer et al. Reference Peltzer, Wardle, Allison, Baisden, Bardgett, Chadwick, Condron, Parfitt, Porder and Richardson2010). Several recent studies on chronosequences that have included retrogressed stages have shown distinct responses in plant functional traits as soil fertility declines over time (Cordell et al. Reference Cordell, Goldstein, Meinzer and Vitousek2001; Richardson et al. Reference Richardson, Peltzer, Allen and McGlone2005; Crutsinger et al. Reference Crutsinger, Sanders, Albrectsen, Abreu and Wardle2008; Bansal et al. Reference Bansal, Nilsson and Wardle2012; Wardle et al. Reference Wardle, Jonsson, Bansal, Bardgett, Gundale and Metcalfe2012; Lagerström et al. Reference Lagerström, Nilsson and Wardle2013). In light of this, there is a growing interest in understanding the variation in functional traits across environmental gradients because of the role traits play in community assembly, niche overlap and ecosystem processes (Bolnick et al. Reference Bolnick, Amarasekare, Araújo, Bürger, Levine, Novak, Rudolf, Schreiber, Urban and Vasseur2011). Until recently, studies on functional trait variability have focused on interspecific variation, and the importance of intraspecific trait variability has been recognized as an important ecological driver only in the past few years (Albert et al. Reference Albert, Thuiller, Yoccoz, Douzet, Aubert and Lavorel2010; Messier et al. Reference Messier, McGill and Lechowicz2010; Kichenin et al. Reference Kichenin, Wardle, Peltzer, Morse and Freschet2013). We have recently shown that functional traits of epiphytic lichens are highly responsive to ecosystem retrogression, and at the within-species level are much more responsive than those of vascular plant species (Asplund et al. Reference Asplund, Sandling and Wardle2012; Asplund & Wardle Reference Asplund and Wardle2014). However, whether functional traits of terricolous lichens show comparable responses to ecosystem retrogression remains unknown.
We used a previously established, fire-driven boreal forest chronosequence spanning 5000 years to evaluate how functional traits of the terricolous lichen Peltigera aphthosa (L.) Willd. vary with ecosystem retrogression. The study system is well established as a chronosequence because all major driving factors other than chronosequence stage are consistent across all units and confounding factors are therefore largely lacking (Wardle et al. Reference Wardle, Zackrisson, Hörnberg and Gallet1997, Reference Wardle, Jonsson, Bansal, Bardgett, Gundale and Metcalfe2012). As such, this particular chronosequence has been extensively used to test how ecosystem retrogression affects various ecosystem processes, as well as the functional traits of both plants and epiphytic lichens (Wardle et al. Reference Wardle, Walker and Bardgett2004, Reference Wardle, Jonsson, Bansal, Bardgett, Gundale and Metcalfe2012; Wardle & Zackrisson Reference Wardle and Zackrisson2005; Clemmensen et al. Reference Clemmensen, Bahr, Ovaskainen, Dahlberg, Ekblad, Wallander, Stenlid, Finlay, Wardle and Lindahl2013; Lagerström et al. Reference Lagerström, Nilsson and Wardle2013; Asplund & Wardle Reference Asplund and Wardle2014). First, we hypothesized that with decreasing soil fertility, and as retrogression proceeds, there will be a shift in lichen thallus traits from those associated with rapid resource capture of soil nutrients and light to those linked to resource conservation, in a similar manner to that well known to occur for vascular plant leaf traits (Grime Reference Grime1979; Aerts & Chapin Reference Aerts and Chapin2000). As such, we predicted increasing specific thallus mass (STM) and carbon-based secondary compounds (CBSCs), and decreasing thallus nitrogen (N) and phosphorus (P) during retrogression. Secondly, we hypothesized that as the availability of soil N to living organisms declines during retrogression (Wardle et al. Reference Wardle, Zackrisson, Hörnberg and Gallet1997), P. aphthosa will have higher densities of cephalodia (containing N2-fixing Nostoc sp.) to allow greater biological N2-fixation and thus compensate for lower N availability, and that P. aphthosa thalli will therefore have higher δ15N values (Brenner et al. Reference Brenner, Amundson, Baisden, Kendall and Harden2001). Thirdly, we hypothesized that thallus δ13C values will increase with ecosystem retrogression as a consequence of the higher δ13C values of their substratum (Hyodo & Wardle Reference Hyodo and Wardle2009). We note that the lichen functional traits we measured may also be influenced by factors that are at least partly independent of island size or retrogressive stage. As these factors may also contribute to the understanding of trait variation in this system, they were also considered.
Because of the role lichen functional traits play in regulating lichen tissue decomposition rates and consumption by invertebrates, and thus in the turnover rates of carbon and nutrients in the ecosystem (Lang et al. Reference Lang, Cornelissen, Klahn, Van Logtestijn, Broekman, Schweikert and Aerts2009; Asplund & Wardle Reference Asplund and Wardle2013), our study contributes to the understanding of how long-term ecosystem development may influence the role of lichens in community and ecosystem processes (Knops et al. Reference Knops, Nash and Schlesinger1996; Nash Reference Nash2008).
Material and Methods
We used 28 forested islands located in two neighbouring lakes, Hornavan and Uddjaur, in the northern boreal zone of Sweden (65°55′N, 17°43′E to 66°09′N, 17°55′E). These islands, consisting of moraine deposits, vary in size from 0·02 to 15 ha and are grouped into three size classes: 10 ‘large’ (>1·0 ha), 9 ‘medium’ (0·1 to 1·0 ha) and 9 ‘small’ (<0·1 ha) (Wardle et al. Reference Wardle, Hörnberg, Zackrisson, Kalela-Brundin and Coomes2003, Reference Wardle, Jonsson, Bansal, Bardgett, Gundale and Metcalfe2012). Fire history is dependent on island size since larger islands are more often hit by lightning. As such, the mean time since fire for the large, medium and small islands is 585, 2180 and 3250 years respectively, according to 14C dating of charcoal particles in the humus layer (Wardle et al. Reference Wardle, Zackrisson, Hörnberg and Gallet1997, Reference Wardle, Hörnberg, Zackrisson, Kalela-Brundin and Coomes2003). With increasing time since fire and decreasing island size, the islands enter a state of retrogression, with lower soil fertility, plant biomass and productivity. Further details about the environmental properties for each of the three island size classes are given in the Appendix. In this system, we collected thalli from the lichen P. aphthosa, growing on soil among feather mosses. This green-algal lichen supports colonies of N2-fixing Nostoc sp. in cephalodia which can be seen as black dots on the thallus surface. This species was chosen for the present study because it is the only terricolous lichen that occurs across the entire chronosequence.
For each island, lobes from ten thalli were collected in August 2012 in the vicinity of plots used for previous work (Wardle et al. Reference Wardle, Hörnberg, Zackrisson, Kalela-Brundin and Coomes2003, Reference Wardle, Jonsson, Bansal, Bardgett, Gundale and Metcalfe2012), from which most of the additional data used in the present study are derived (Appendix). Plots were located at comparable distances from the shore to minimize the potential of confounding factors covarying with island size, such as edge effects and macroclimate (Wardle et al. Reference Wardle, Hörnberg, Zackrisson, Kalela-Brundin and Coomes2003). The thalli were not collected directly beneath tree canopies.
The collected lichens were hydrated by spraying deionized water on the upper surface in the laboratory. From each of the ten well-moistened lobes per island, one disc with an area of 1·18 cm2 was taken out with a cork borer. Each disc was then photographed in the fully hydrated state with a Konica Minolta Dynax 7D digital SLR (Konica, Tokyo, Japan) fitted with a Sigma 105 mm f2.8 DG EX macro lens (Sigma, Kawasaki, Japan), following Asplund et al. (Reference Asplund, Solhaug and Gauslaa2010), and the percent area cover of cephalodia (cephalodia abundance) was determined using ImageJ 1.46 (National Institutes of Health, Bethesda, Maryland). Water-holding capacity (WHC) and specific thallus mass [STM, the lichen equivalent of plant-specific leaf mass (i.e. reciprocal of specific leaf area)] of each disc was then determined following Gauslaa & Coxson (Reference Gauslaa and Coxson2011). Next, the fully hydrated discs were gently blotted and wet mass (WM) was recorded (±0·1 mg). Discs were subsequently oven-dried (24 h at 70°C) and dry mass (DM) was recorded. From these measurements, STM was computed as DM/area and WHC as (WM – DW)/area. Blotting, as opposed to only shaking the lichen thallus prior to determining WM, removes zero potential surface water (Snelgar & Green Reference Snelgar and Green1981). However, the amount of water stored on the thallus surface and measured on shaken thalli is not always constant between measurements and therefore difficult to estimate correctly; for this reason, we utilized blotting as the preferred method in our study. For each island, the remaining lichen material was collectively ground in a ball mill for chemical analyses. Concentrations of N and P were determined by Kjeldahl digestion followed by automatic colorimetric methods (Blakemore et al. Reference Blakemore, Searle and Daly1987). To analyze concentrations of CBSCs, c. 30 mg of the powder was extracted for three 45 min intervals in acetone. The combined supernatants were evaporated to dryness and dissolved in 1–2 ml acetone. The extracted compounds were then quantified by HPLC using an ODS Hypersil column, 50 × 4·6 mm using 0·25% orthophosphoric acid and 1·5% tetrahydrofuran in Millipore (Millipore, Billerica, Massachusetts, USA) water (A) and 100% methanol (B) as mobile phases at 2 ml min–1, and UV detection at 245 nm (following Nybakken et al. Reference Nybakken, Asplund, Solhaug and Gauslaa2007). Compound identification was based on retention times, online UV spectra and co-chromatography of commercial standards.
For lichen material from each island, stable N and C isotope ratios were measured on ground and dried (70°C, 18 h) material contained in folded tin capsules using an isotope ratio mass spectrometer (Delta V®, Thermo Fisher Scientific, Waltham, Massachusetts, USA) coupled with an elemental analyzer (Flash EA 2000, Thermo Fisher Scientific, Waltham, Massachusetts, USA). The natural abundances of 13C and 15N were expressed in per mil (‰) deviation from international standards (VPDB and atmospheric N for C and N, respectively); δ13C and δ15N was calculated as (R sample/R standard – 1) × 1000, where R in δ13C and δ15N is 13C/12C and 15N/14N, respectively.
Individual islands served as the units of replication. One-way ANOVAs were used to test for the effect of island size class on each functional trait measured. When island size effects were significant, means across island size classes were compared by post-hoc comparison (Tukey's test) at P < 0·05. Relationships between lichen functional traits and previously measured environmental variables (island size, light transmission through the canopy, soil total N, soil N:P ratio, soil mineral N and soil mineral P), and among the functional traits, were analyzed with Spearman's rank correlation coefficients among the 28 islands. All statistical analyses were performed in R 2.15.2.
Results and Discussion
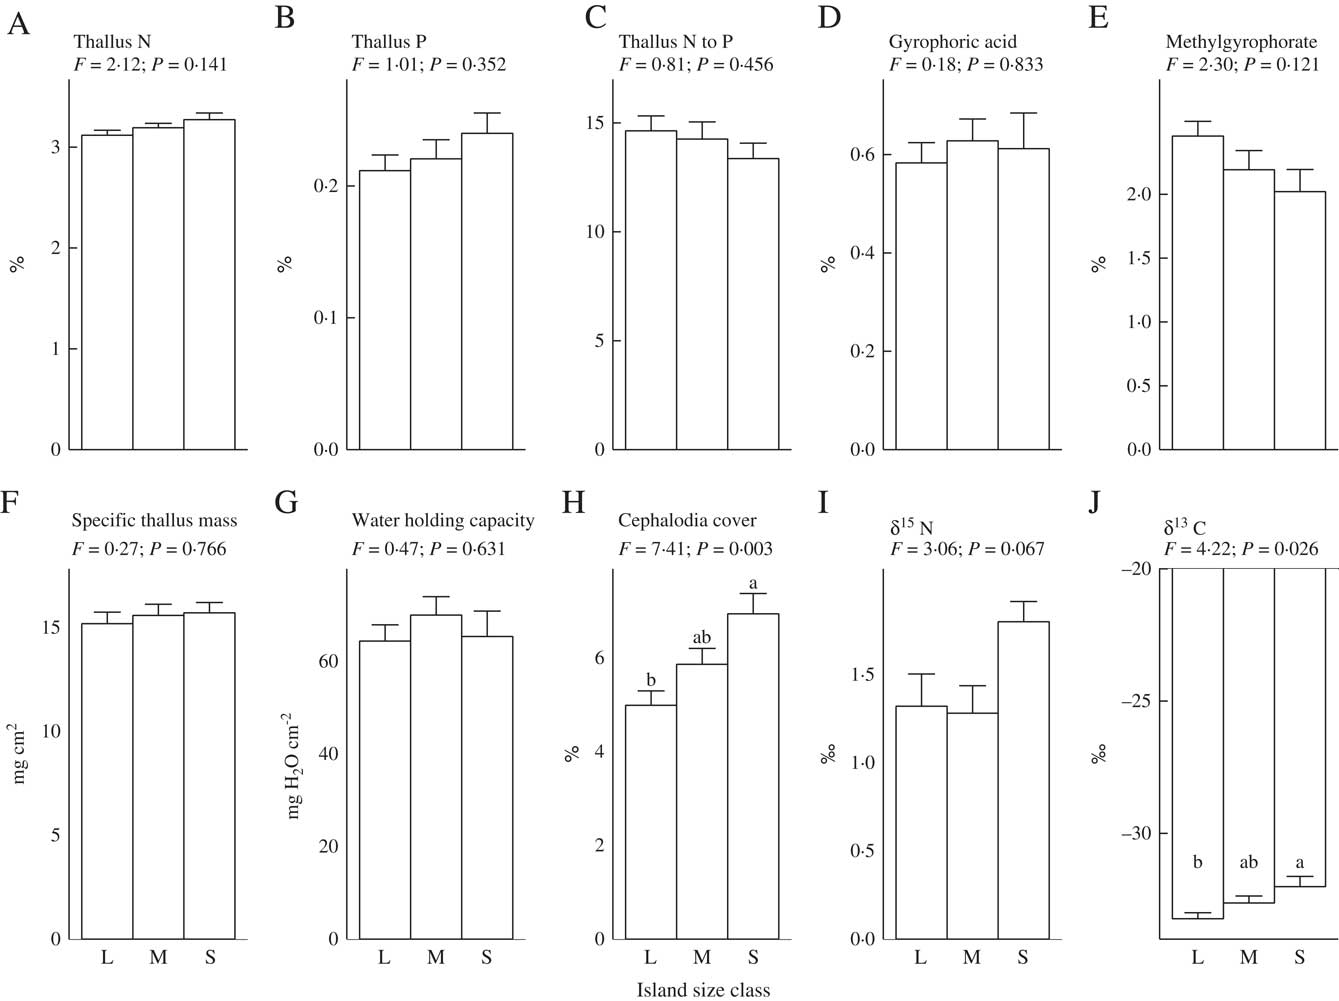
Our first hypothesis, which predicted that as retrogression proceeds and soil fertility declines there will be a shift in lichen thallus traits from those associated with rapid resource capture of soil nutrients and light to those linked to resource conservation, was not supported. As such, thallus concentrations of N, P, STM, WHC, and the CBSCs gyrophoric acid and methylgyrophorate (the only two CBSCs that were detected), did not respond to island size (Fig. 1A–G). These findings contrast with previous work on epiphytic lichens growing on Betula pubescens in the same study system, for which thalli had much higher nutrient concentrations and STM on small, less fertile islands (Asplund et al. Reference Asplund, Sandling and Wardle2012; Asplund & Wardle Reference Asplund and Wardle2014). For thallus N, this unresponsiveness could be explained by P. aphthosa regulating its N status through N2-fixation (Dahlman & Palmqvist Reference Dahlman and Palmqvist2003). While STM did not respond to island size class, we did find that STM increased with declining soil mineral N (Table 1). This suggests that the high level of variation in soil N availability between islands that is independent of island size or stage of retrogression may exert an effect on STM (Appendix).

Fig. 1 Relationships between functional traits of thalli of the terricolous lichen Peltigera aphthosa and island size class (L = large, M = medium and S = small). Mean values are plotted ±1 SE. F and P-values are derived from one-way ANOVAs (df = 2 and 25, respectively). Within each panel, letters on top of bars denote significant differences (P < 0·05, Tukey's post hoc test). ‘Cephalodia cover’ = percent area covered with cephalodia, N = nitrogen, P = phosphorus.
Table 1 Relationships between lichen traits in Peltigera aphthosa and environmental variables collected from 28 islands. Values given are Spearman rank correlation coefficients
Light = light transmission through the canopy, N = nitrogen, P = phosphorus, STM = specific thallus mass, WHC = water-holding capacity, ‘cephalodia’ = percent area covered with cephalodia. Bold values indicate significant correlations (P < 0·05) and * and ** indicate significant relationships at P = 0·05 and 0·01, respectively.
We found no relationship between STM and light (Table 2). This contrasts with earlier studies indicating that light can promote STM of lichens by causing increased desiccation and thereby decreased hyphal expansion (leading to a decrease in surface area) but an increase in mass within the area that the lichens occupy (Snelgar & Green Reference Snelgar and Green1981; Dahlman & Palmqvist Reference Dahlman and Palmqvist2003; Solhaug et al. Reference Solhaug, Lind, Nybakken and Gauslaa2009; Asplund et al. Reference Asplund, Sandling and Wardle2012). For instance, epiphytic lichens in this study system tend to have higher STM on those islands that have high light transmission through the canopy (Asplund et al. Reference Asplund, Sandling and Wardle2012; Asplund & Wardle Reference Asplund and Wardle2014). However, P. aphthosa has a higher water-holding capacity than do the main species of epiphytic green-algal lichens in this system (Asplund & Wardle Reference Asplund and Wardle2013), and by growing on the ground amongst poikilohydric mosses it is less exposed to desiccation compared with epiphytes (Colesie et al. Reference Colesie, Scheu, Green, Weber, Wirth and Büdel2012). Taking both these factors into account, P. aphthosa is expected to be less responsive in terms of its STM, relative to changes in light availability.
Table 2 Relationships between lichen traits in Peltigera aphthosa collected from 28 islands. Values given are Spearman rank correlation coefficients
N = nitrogen, P = phosphorus, STM = specific thallus mass, WHC = water-holding capacity, ‘cephalodia’ = percent area covered with cephalodia. Bold values indicate significant correlations (P < 0·05) and *, ** and *** indicate significant relationships at P = 0·05, 0·01 and 0·001, respectively.
In line with our second hypothesis, we found the relative abundance of cephalodia to increase with decreasing island size (Fig. 1H). This suggests a higher N2-fixing ability of P. aphthosa on small islands. We also found thallus N concentration to increase with cephalodia abundance (Table 2). Our findings are consistent with earlier work on these islands showing that with decreasing island size, cyanobacteria associated with feather mosses also show increasing N2-fixation rates (Lagerström et al. Reference Lagerström, Nilsson, Zackrisson and Wardle2007), and that vascular plants and mosses show increasing δ15N values (Hyodo & Wardle Reference Hyodo and Wardle2009; Bansal et al. Reference Bansal, Nilsson and Wardle2012). One likely explanation for the pattern observed is that reduced N availability on small retrogressed islands (Wardle et al. Reference Wardle, Zackrisson, Hörnberg and Gallet1997) promotes the production of cephalodia in order to enable higher N2-fixation rates. In line with this, NH4 + is known to impede N2-fixation for P. aphthosa (Rai et al. Reference Rai, Rowell and Stewart1981; Hällbom & Bergman Reference Hällbom and Bergman1983). However, we found no significant correlations between individual soil nutrients and cephalodia abundance. Island size, as a proxy for retrogression stage, integrates all variables that change as time since fire disturbance increases and retrogression proceeds (Wardle et al. Reference Wardle, Jonsson, Bansal, Bardgett, Gundale and Metcalfe2012), and is therefore a more robust explanatory variable than individual soil variables are for understanding responses to ecosystem retrogression. In light of this, it is not surprising to find significant effects of island size but not of individual soil nutrients. Furthermore, there was a positive relationship between relative abundance of cephalodia and thallus P concentration (Table 2). Nitrogen-fixing activity by symbiotic cyanobacteria in lichens is strongly regulated by P supply (Crittenden et al. Reference Crittenden, Kałucka and Oliver1994; Kurina & Vitousek Reference Kurina and Vitousek1999), and Raggio et al. (Reference Raggio, Green, Crittenden, Pintado, Vivas, Pérez-Ortega, Ríos and Sancho2012) observed positive relationships between lichen thallus P and acetylene reduction (which is indicative of biological N2 fixation).
We predicted that lichens on small islands should have higher δ15N values due to increased N2-fixation. We found that thallus δ15N values were negatively related to island size (Table 1) and were higher on small islands although this difference was not statistically significant (Fig. 1I). However, increased biological N2-fixation should result in δ15N values increasing from negative towards zero, and not increasing to more positive values in the manner that we observed here. This is because the δ15N of atmospheric N2 is zero, and that of N in precipitation is generally below zero (i.e. 0 to –10‰) (Nadelhoffer & Fry Reference Nadelhoffer and Fry1994). Furthermore, we found no significant relationship between density of cephalodia (where N2-fixation is located) and δ15N (Table 2). An alternative explanation for the increasing δ15N values observed with decreasing island size is that the lichens may increasingly use organic N relative to inorganic N. Due to discrimination against 15N during mineralization, inorganic N should be more depleted in 15N than organic N (Nadelhoffer & Fry Reference Nadelhoffer and Fry1994) and, in our study system, availability of inorganic N declines while dissolved organic N increases with declining island size (Wardle & Zackrisson Reference Wardle and Zackrisson2005).
We found support for our third hypothesis that thallus δ13C should increase as ecosystem retrogression proceeded (Fig. 1J). This is in line with what we know from vascular plants and mosses in this system (Hyodo & Wardle Reference Hyodo and Wardle2009; Bansal et al. Reference Bansal, Nilsson and Wardle2012). A possible explanation is that ground-dwelling lichens potentially assimilate CO2 from respiration of C derived from the humus substratum, which may influence δ13C values of the thalli (Broadmeadow et al. Reference Broadmeadow, Griffiths, Maxwell and Borland1992; Tarnawski et al. Reference Tarnawski, Green, Buedel, Meyer, Zellner and Lange1994; Máguas et al. Reference Máguas, Griffiths and Broadmeadow1995; Lakatos et al. Reference Lakatos, Hartard and Máguas2007; Colesie et al. Reference Colesie, Scheu, Green, Weber, Wirth and Büdel2012), and that as retrogression proceeds, humus δ13C increases (Hyodo & Wardle Reference Hyodo and Wardle2009). It has also previously been shown that δ13C values in lichens are dependent on the substratum upon which they grow (Beck & Mayr Reference Beck and Mayr2012). In support of this explanation, we found a positive relationship between humus δ13C (using data from Hyodo & Wardle Reference Hyodo and Wardle2009) and P. aphthosa δ13C (Pearson correlation r = 0·374, P < 0·05). Light has an important influence on the internal CO2 concentration of active lichens and therefore δ13C discrimination (Farquhar et al. Reference Farquhar, Ehleringer and Hubick1989; Palmqvist Reference Palmqvist2000). However, we found no relationship between light and δ13C values, suggesting that the observed increase in δ13C with ecosystem retrogression is not driven by differences in light availability between the islands. Furthermore, we found P. aphthosa δ13C to show a positive relationship with both STM and WHC (Table 2). However, these relationships do not explain why δ13C increases with ecosystem retrogression, because both STM and WHC were both independent of island size. This suggests that variation in factors that are unrelated to ecosystem retrogression and island size are also important drivers of δ13C. These patterns probably emerged because greater thallus thickness (i.e. higher STM) increases the water-holding capacity, which in turn results in higher CO2 diffusion resistance, thereby promoting δ13C (Lange et al. Reference Lange, Green and Ziegler1988; Lange & Green Reference Lange and Green1996; Lakatos et al. Reference Lakatos, Hartard and Máguas2007; Gauslaa & Coxson Reference Gauslaa and Coxson2011). Furthermore, higher STM also results in a thicker cortical layer which increases CO2 diffusion resistance (Máguas & Brugnoli Reference Máguas and Brugnoli1996; Gauslaa & Coxson Reference Gauslaa and Coxson2011).
Conclusions
While there is an extensive literature on how functional traits of vascular plants drive key ecological processes such as decomposition, herbivory, and the cycling of carbon and nutrients, functional traits of lichens may also have a major, though often overlooked impact on these processes (Lang et al. Reference Lang, Cornelissen, Klahn, Van Logtestijn, Broekman, Schweikert and Aerts2009; Asplund & Wardle Reference Asplund and Wardle2013; Colesie et al. Reference Colesie, Green, Haferkamp and Büdel2014). As such, an improved knowledge of how functional traits of lichens change along environmental gradients may help us to better understand how environmental changes have an impact on ecosystem processes. We have studied how functional traits of a N2-fixing ground-dwelling lichen, P. aphthosa, respond to a strong gradient in soil fertility driven by ecosystem retrogression. Although previous work has revealed that traits of epiphytic lichens and of vascular plants respond strongly to this gradient (Asplund et al. Reference Asplund, Sandling and Wardle2012; Asplund & Wardle Reference Asplund and Wardle2014; Kumordzi et al. Reference Kumordzi, Nilsson, Gundale and Wardle2014), we found that most traits of P. aphthosa are relatively unresponsive. Furthermore, most traits were unaffected by changes in light availability across the gradient, which contrasts with what has been previously shown for responses of epiphytic lichens in this system (Asplund et al. Reference Asplund, Sandling and Wardle2012; Asplund & Wardle Reference Asplund and Wardle2014). These contrasting findings between epiphytic and ground-dwelling lichens highlight the importance of studying different functional groups of primary producers along the same gradient.
This work was funded by a grant from the Swedish Research Council (Vetenskapsrådet) to JA (2010-6553) and a Wallenberg Scholars award to DAW.
Appendix. Ecosystem properties and island size
Changes in selected ecosystem properties across the island size gradient. Values are means with standard errors in brackets. Within each row numbers followed by the same letter are not statistically significant at P = 0·05 (Tukey's test following one-way ANOVA). Data from Wardle et al. (Reference Wardle, Zackrisson, Hörnberg and Gallet1997, Reference Wardle, Hörnberg, Zackrisson, Kalela-Brundin and Coomes2003, Reference Wardle, Walker and Bardgett2004) and Hyodo & Wardle (Reference Hyodo and Wardle2009).