


Introduction
Parmeliaceae (Lecanorales: Ascomycota) represents the most species-rich family of lichen-forming fungi, encompassing approximately 2500 species (Kirk et al. Reference Kirk, Cannon, Minter and Stalpers2008). Within the Parmeliaceae, several growth forms are recognized (Crespo et al. Reference Crespo, Lumbsch, Mattsson, Blanco, Divakar, Articus, Wiklund, Bawingan and Wedin2007), with the cetrarioid growth form being one of the most researched groups. The cetrarioid growth form refers to an erect foliose/subfruticose thallus with marginal apothecia and pycnidia, and cetrarioid taxa typically produce the Cetraria-type lichenan (Kärnefelt Reference Kärnefelt1979; Goward Reference Goward1985; Thell et al. Reference Thell, Stenroos, Feuerer, Kärnefelt, Myllys and Hyvönen2002; Crespo et al. Reference Crespo, Lumbsch, Mattsson, Blanco, Divakar, Articus, Wiklund, Bawingan and Wedin2007). Cetrarioid taxa are mostly corticolous or terricolous and are restricted primarily to the Northern Hemisphere, with high diversity in eastern Asia and North America (Kärnefelt Reference Kärnefelt1979; Hale Reference Hale1990; Elix Reference Elix1993; Randlane et al. Reference Randlane, Saag and Obermayer2001; Thell et al. Reference Thell, Stenroos, Feuerer, Kärnefelt, Myllys and Hyvönen2002). Both the cetrarioid growth form and production of the Cetraria- type lichenan have been demonstrated to be polyphyletic. Nevertheless, a large number of cetrarioid taxa form a monophyletic group (Thell et al. Reference Thell, Stenroos, Feuerer, Kärnefelt, Myllys and Hyvönen2002; Crespo et al. Reference Crespo, Lumbsch, Mattsson, Blanco, Divakar, Articus, Wiklund, Bawingan and Wedin2007). This group, the ‘cetrarioid core’, comprises approximately 90 species classified into over 14 genera (Randlane et al.Reference Randlane, Saag and Thell1997; Thell et al. Reference Thell, Stenroos, Feuerer, Kärnefelt, Myllys and Hyvönen2002, Reference Thell, Feuerer, Kärnefelt, Myllys and Stenroos2004, Reference Thell, Högnabba, Elix, Feuerer, Kärnefelt, Myllys, Randlane, Saag, Stenroos, Ahti and Seaward2009).
Despite the intensive taxonomic and phylogenetic consideration this group has received in recent years (Thell et al. Reference Thell, Högnabba, Elix, Feuerer, Kärnefelt, Myllys, Randlane, Saag, Stenroos, Ahti and Seaward2009), relationships among species and genera still remain unclear. Previous phylogenetic studies in this group have relied on morphological (Kärnefelt et al. Reference Kärnefelt, Mattsson and Thell1992; Saag &Randlane Reference Saag and Randlane1995), a combination of molecular, morphological and/or chemical characters (Thell et al. Reference Thell, Stenroos, Feuerer, Kärnefelt, Myllys and Hyvönen2002; Saag et al. Reference Saag, Randlane, Thell and Obermayer2002), and strictly molecular characters (Thell & Miao Reference Thell and Miao1998; Thell et al. Reference Thell, Randlane, Saag and Kärnefelt2005, Reference Thell, Högnabba, Elix, Feuerer, Kärnefelt, Myllys, Randlane, Saag, Stenroos, Ahti and Seaward2009). The nuclear ribosomal internal transcribed spacer (ITS) has been the molecular marker most frequently employed, with a small proportion of taxa also containing mitochondrial small subunit (mtSSU),glyceraldehyde-3-phosphate dehydrogenase (GAPDH), β-tubulin, and group I intron (nuclear ribosomal small subunit) sequences (Thell & Miao Reference Thell and Miao1998; Thell et al. Reference Thell, Stenroos, Feuerer, Kärnefelt, Myllys and Hyvönen2002, Reference Thell, Feuerer, Kärnefelt, Myllys and Stenroos2004, Reference Thell, Högnabba, Elix, Feuerer, Kärnefelt, Myllys, Randlane, Saag, Stenroos, Ahti and Seaward2009). Several smaller groups towards the tips of the phylogeny frequently receive strong support, but the relationships of these assemblages to one another mostly lack support.
Here we have examined whether the use of four widely employed markers in Parmeliaceae [ITS, mtSSU, nuclear ribosomal large subunit (nuLSU) and the RNA polymerase II largest subunit (RPB1)] would aid in resolving deeper relationships among cetrarioid clades. The ITS has been suggested as a useful marker for species-genus level relationships, while nuclear rDNA genes have been suggested as being useful across a broad taxonomic range, including the genus level (Bruns et al. Reference Bruns, White and Taylor1991). Similarly the mtSSU has been suggested as an appropriate marker for resolving genus level relationships (Crespo et al. Reference Crespo, Blanco and Hawksworth2001). Finally, RPB1 has been shown to be quite phylogenetically informative at a shallow taxonomic scale (Schoch et al. Reference Schoch, Sung, López-Giráldez, Townsend, Miądlikowska, Hofstetter, Robbertse, Matheny, Kauff and Wang2009). Recently, these four loci were employed to aid in the generic delimitations of parmelioid lichens (Crespo et al. Reference Crespo, Kauff, Divakar, del Prado, Pérez-Ortega, Amo de Paz, Ferencova, Blanco, Roca-Valiente and Núñez-Zapata2010), and here we assess their utility in cetrarioid lichens.
In addition, we used genetic distance estimates as a proxy to compare generic concepts of the cetrarioid core with other genera in Parmeliaceae. Lumbsch (Reference Lumbsch2002), following an approach by Castresana (Reference Castresana2001), employed a quantitative framework within which to address the objectivity of genera in several euascomycete families. Later, Nilsson et al. (Reference Nilsson, Kristiansson, Ryberg, Hallenberg and Larsson2008) and del Prado et al. (Reference Crespo, Kauff, Divakar, del Prado, Pérez-Ortega, Amo de Paz, Ferencova, Blanco, Roca-Valiente and Núñez-Zapata2010) used a similar methodology to estimate the range of genetic distances at lower taxonomic levels (genera and species), with del Prado et al. (Reference Crespo, Kauff, Divakar, del Prado, Pérez-Ortega, Amo de Paz, Ferencova, Blanco, Roca-Valiente and Núñez-Zapata2010) focusing on intra- and interspecific genetic distances of parmelioid core taxa within Parmeliaceae. The study of Lumbsch (Reference Lumbsch2002) suggested that several genera in the cetrarioid core were excessively split, relative to other genera of Parmeliaceae examined. Since that time, sequences from additional taxa have been generated and generic concepts among parmelioid taxa have changed, resulting in some splitting (Blanco et al. Reference Blanco, Crespo, Divakar, Esslinger, Hawksworth and Lumbsch2004a; Divakar et al. Reference Crespo, Kauff, Divakar, del Prado, Pérez-Ortega, Amo de Paz, Ferencova, Blanco, Roca-Valiente and Núñez-Zapata2010) and some lumping (Blanco et al. Reference Blanco, Crespo, Elix, Hawksworth and Lumbsch2004b, Reference Blanco, Crespo, Divakar, Elix and Lumbsch2005) with a new generic classification of parmelioid taxa recently presented (Crespo et al. Reference Crespo, Kauff, Divakar, del Prado, Pérez-Ortega, Amo de Paz, Ferencova, Blanco, Roca-Valiente and Núñez-Zapata2010). Consequently, a re-assessment is timely.
Materials and Methods
Taxon sampling
Our sampling was focused on the cetrarioid core genera, where we selected species for which at least two of the target loci (see below) had been sequenced. In addition, we included a small number of taxa for which only ITS sequences were available; most of these taxa were included because they were the type species of the genus or the genus had no representatives with two or more loci sequenced. Ideally we would have obtained the missing sequences for these taxa, but we either did not have fresh material or DNA from them, or were unable to obtain sequences from the material we had. We still included these taxa, however, as it has been demonstrated that taxa with missing sequence data can still be placed accurately in a phylogeny (Wiens Reference Wiens2003, Reference Wiens2006). Finally, we included a number of outgroup taxa as well as taxa previously shown to be closely allied with the cetrarioid core. Outgroup taxa were chosen based on recent phylogenetic studies in Parmeliaceae (Crespo et al. Reference Crespo, Lumbsch, Mattsson, Blanco, Divakar, Articus, Wiklund, Bawingan and Wedin2007, Reference Crespo, Kauff, Divakar, del Prado, Pérez-Ortega, Amo de Paz, Ferencova, Blanco, Roca-Valiente and Núñez-Zapata2010). Altogether 72 taxa were analyzed, including 58 species of the cetrarioid core (Table 1).
Table 1 Taxa, voucher specimens, herbaria and GenBank accession numbers for the sequences used in the present study. Collection information is provided only for taxa with sequences newly generated in this study

Molecular methods
DNA isolates from previous studies (summarized in Thell et al. Reference Thell, Högnabba, Elix, Feuerer, Kärnefelt, Myllys, Randlane, Saag, Stenroos, Ahti and Seaward2009) were used in the present study. Samples were PCR amplified and sequenced using the mrSSU1, mrSSU2, mrSSU2R and mrSSU3R primers (Zoller et al. Reference Zoller, Scheidegger and Sperisen1999) for the mtSSU, the nu-LSU-155-5′ (Döring et al. Reference Döring, Clerc, Grube and Wedin2000) and LR6 (Vilgalys & Hester Reference Vilgalys and Hester1990) primers for nuLSU, and the gRPB1-A forward (Stiller & Hall Reference Stiller and Hall1997) and fRPB1-C reverse (Matheny et al. Reference Matheny, Liu, Ammirati and Hall2002) primers for RPB1. The 25 µl PCR reactions consisted of 1 µl of each PCR primer (10 µM), 2·5 µl dNTP mix (10 mM), 5 µl BSA, 2·5 µl PCR buffer, 2µl Taq, approximately 2 µl DNA and 8·5 µl water. The PCR cycling conditions were as follows: 95°C for 5 min, followed by 35 cycles of 95°C for 1 min, a locus-specific annealing temperature for 1 min, and 72°C for 1 min, followed by a single 72°C final extension for 7 min. An annealing temperature of 53°C was used for mtSSU, 57°C for nuLSU, and 55°C for RPB1. Samples were visualized on a 1% ethidium bromide-stained agarose gel under UV light and bands were gel extracted, heated at 70°C for 5 min, cooled to 45°C for 10 min, treated with 1 µl GELase (Epicentre Biotechnologies, Madison, WI) and incubated at 45°C for at least 24 h.
Samples were cycle-sequenced in 10 µl volumes and included 1·5 µl Big Dye Terminator version 3.1 (Applied Biosystems, Foster City, CA), 2·5 µl Big Dye buffer, 0·4 µl primer (10 µM), 1 µl Gelased PCR product and water. The cycle sequencing conditions were as follows: 96°C for 1 min, followed by 25 cycles of 96°C for 10 s, 50°C for 5 s and 60°C for 4 min. Samples were precipitated with ethanol and EDTA, re-suspended in Hi-Di formamide (Applied Biosystems) and sequenced in an Applied Biosystems 3730 DNA Analyzer. Sequences were then assembled in Sequencher 4.9 (Gene Codes Corporation, Ann Arbor, MI).
Phylogenetic analyses
Sequences in Table 1 were aligned using a combination of automated alignment (Muscle 3.6: Edgar Reference Edgar2004) and manual refinement in Mesquite 2.73 (Maddison & Maddison Reference Maddison and Maddison2010) and Se-Al v. 2.0a11 (Rambaut Reference Rambaut1996). Ambiguous regions and introns were removed and the alignment is deposited in TreeBase.
A maximum likelihood (ML) analysis was performed for each locus in RAxML 7.2.6 (Stamatakis Reference Stamatakis2006) using the GTRGAMMA model with 25 rate parameter categories. Support was then estimated by performing 1000 bootstrap pseudoreplicates (Felsenstein Reference Felsenstein1985) and clades with support of 70 or greater were considered strongly supported. Individual gene trees were compared to assess whether strongly supported topological conflict existed. Loci were then concatenated and two data sets created: the first data set (full) included all taxa in Table 1, while the second data set (3+) included only taxa with 3 loci or more present. These different data sets were used to examine relationships among taxa, and determine how support was affected by increased data representation. Partitioned ML analyses were performed on these data sets as described above, except that for the full data set, the GTRCAT model of evolution was used first to infer the tree topology which was subsequently evaluated under the GTRGAMMA model.
Bayesian analyses using Markov Chain Monte Carlo sampling (Larget & Simon Reference Larget and Simon1999) were also performed. Substitution models for individual loci were selected by using jModelTest 0.1.1 (Posada Reference Posada2008), which employs PhyML 3.0 (Guindon & Gascuel Reference Guindon and Gascuel2003) to estimate the likelihood of the data under 24 models of evolution with a fixed topology. AICc values for each model were then calculated and compared, and the model with the lowest AICc value was selected (GTR+Γ+I for ITS, mtSSU and nuLSU; K80+I for RPB1 first position; JC for RPB1 second position; SYM+G for RPB1 third position in the full analysis and K80+Γ for the 3 gene analysis). Partitioned Bayesian analyses were then performed using MrBayes 3.1.2 (Huelsenbeck & Ronquist Reference Huelsenbeck and Ronquist2001) in the CIPRES Science Gateway v. 3.0 (Miller et al. Reference Miller, Holder, Vos, Midford, Liebowitz, Chan, Hoover and Warnow2009). To obtain acceptance rates between approximately 0·1 and 0·7, which are suggestive of adequate levels of mixing (Ronquist et al. Reference Ronquist, Huelsenbeck and van der Mark2005, Reference Ronquist, van der Mark, Huelsenbeck, Lemey, Salemi and Vandamme2009), the temperature was set to 0·035–0·04. Two parallel analyses with four chains each were run for 5 M generations, sampling every 200 generations. The initial 25% (6251 trees) were discarded as burn-in, and convergence among parallel runs was assessed by creating bivariate plots of bipartitions in the program AWTY (Wilgenbusch et al. Reference Wilgenbusch, Warren and Swofford2004; Nylander et al. Reference Nylander, Wilgenbusch, Warren and Swofford2008).
Intrageneric genetic distance
We also wanted to determine how generic concepts within the cetrarioid core compared with other well-defined Parmeliaceae genera. To accomplish this, we estimated the maximum genetic distance encompassed within individual cetrarioid genera/clades and compared these estimates with those of other Parmeliaceae genera. The ITS sequences listed in Table 1 were added to the ITS alignment from the 2+gene data set from the ParSys project (Crespo et al. Reference Crespo, Kauff, Divakar, del Prado, Pérez-Ortega, Amo de Paz, Ferencova, Blanco, Roca-Valiente and Núñez-Zapata2010), and overlapping species between the two alignments were removed (leaving one representative per species), along with any additional ambiguous regions. Genera outside the cetrarioid core were included only if more than two species were present in the alignment. Dactylina arctica and Esslingeriana idahoensis were not considered to be part of the cetrarioid core in Thell et al. (Reference Thell, Högnabba, Elix, Feuerer, Kärnefelt, Myllys, Randlane, Saag, Stenroos, Ahti and Seaward2009), but closely allied with it. We included these species in the data set to determine whether the maximum genetic distance within the cetrarioid core was increased when these genera were included. Pairwise genetic distances were then computed under the HKY85 model in PAUP* 4.0b10 (Swofford Reference Swofford2002).
Results
No evidence for significant incongruence between loci was detected. The final concatenated alignment consisted of 2628 unambiguously aligned characters, and the number of characters and proportion of variable characters per locus can be found in Table 2. As illustrated in Table 2, ITS and RPB1 had the greatest number and proportion of variable sites, and contributed the most variability to the combined data set.
Table 2 The number of unambiguously aligned characters for individual loci in the full and 3+ data sets, along with the number and proportion of variable characters

The topology recovered in both the full (Fig. 1) and 3+ (Fig. 2) analyses are generally in agreement with previous topologies. However, support values are higher in the present study, and the backbone, though still weakly supported, has increased support relative to previous studies. Support values were not universally increased in the 3+ analyses (relative to the full analyses), but support for a large number of clades was increased.
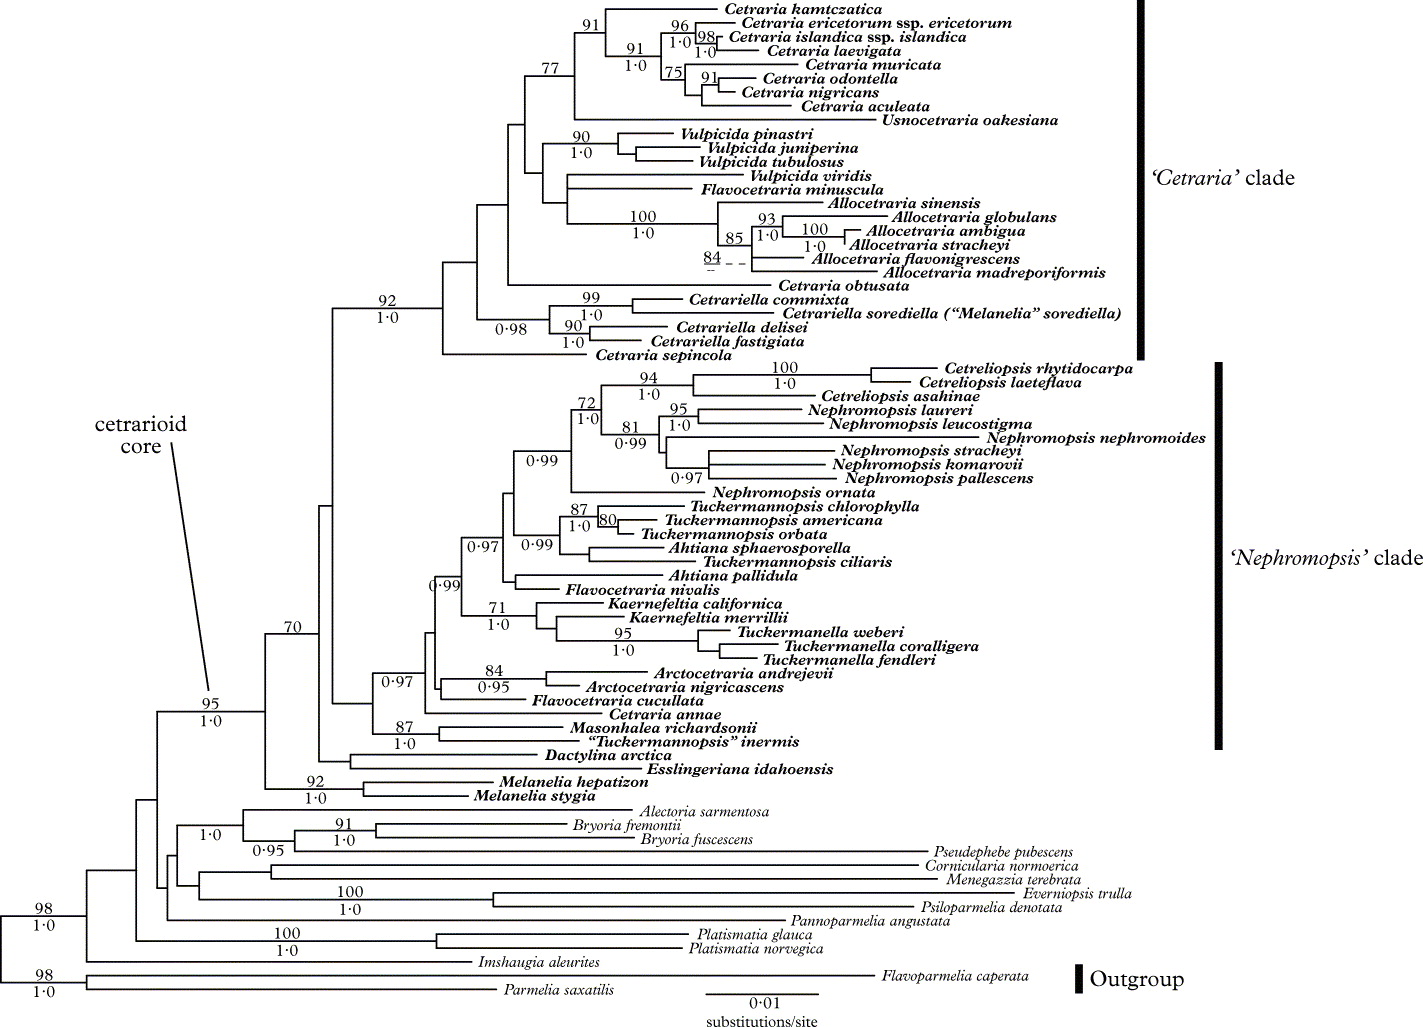
Fig. 1. The ML phylogram for the full data set. Bootstrap proportions of 70 and greater are listed above branches and Bayesian posterior probabilities of 0·95 or greater are listed below branches. Clades A and B are labelled sensu Thell et al. (Reference Thell, Högnabba, Elix, Feuerer, Kärnefelt, Myllys, Randlane, Saag, Stenroos, Ahti and Seaward2009). Taxa belonging to the cetrarioid core group are in bold, while those outside the group are in normal font.
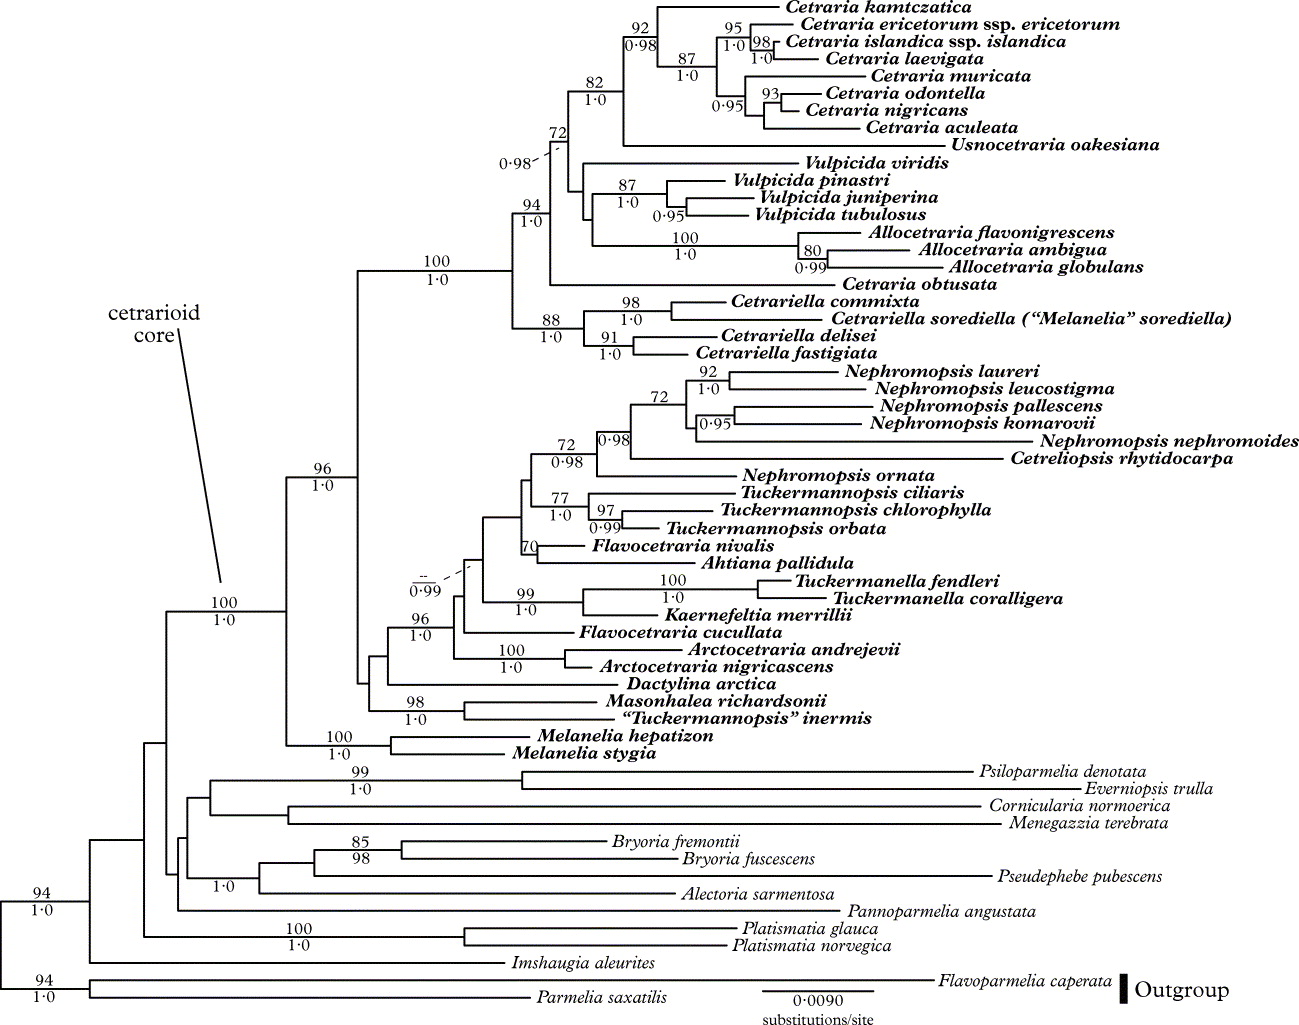
Fig. 2. The ML phylogram for the 3+ data set. Bootstrap proportions of 70 and greater are listed above branches and Bayesian posterior probabilities of 0·95 or greater are listed below branches. Taxa belonging to the cetrarioid core group are in bold, while those outside the group are in normal font.
Approximately half of the genera in the cetrarioid core (as currently circumscribed) do not appear to be monophyletic (i.e. Ahtiana, Cetraria, Cetrariella, Flavocetraria, Kaernefeltia, Nephromopsis, Tuckermannopsis, Vulpicida), though support for the non-monophyly of these genera is often lacking. Dactylina arctica, Esslingeriana idahoensis, Melanelia hepatizon and M. stygia were strongly supported as part of the cetrarioid core.
Figure 3 illustrates the maximum ITS genetic distance encompassed by various Parmeliaceae genera and clades. With the exception of the Nephromopsis + Cetreliopsis clade (which together form a monophyletic group – see Figs 1 & 2), nearly all investigated cetrarioid core genera fall in the lower half of the distribution of maximum ITS genetic distance among congeners. The greatest ITS genetic distance among taxa in the cetrarioid core was between Nephromopsis nephromoides and Allocetraria madreporiformis; the inclusion of Dactylina arctica, Esslingeriana idahoensis, Melanelia hepatizon and M. stygia as part of the cetrarioid core did not increase the maximum genetic distance between two taxa. The maximum genetic distance between taxa in the cetrarioid core was found to be close to that among congeners in the genera Cetrelia and Relicina. The ‘Nephromopsis’ clade (which corresponds to the cetrarioid core clade B of Thell et al. Reference Thell, Högnabba, Elix, Feuerer, Kärnefelt, Myllys, Randlane, Saag, Stenroos, Ahti and Seaward2009) was found to encompass approximately the same maximum genetic distance as was found in Parmotrema, and that of the ‘Cetraria’ clade (which corresponds to the cetrarioid core clade A of Thell et al. Reference Thell, Högnabba, Elix, Feuerer, Kärnefelt, Myllys, Randlane, Saag, Stenroos, Ahti and Seaward2009) was found to be between that of Xanthoparmelia, but less than that of the ‘Nephromopsis’ clade.

Fig. 3. Maximum ITS intra-clade genetic distance calculated for a range of Parmeliaceae clades and genera. Values for taxa belonging to the cetrarioid core group are in black, while those outside the group are white.
Discussion
Increased resolution
This study demonstrates that while ITS sequences contained the greatest amount of variability in the four markers examined (even with many ambiguous regions of the alignment excluded), RPB1 also contributed a large amount of variation, and little needed to be excluded due to ambiguity in the alignment. At the phylogenetic scale investigated here, mtSSU contributed relatively little information and individual gene trees showed very low bootstrap support throughout the tree (data not shown). To further resolve this clade, it may be best to continue to focus on protein-coding genes, such as RPB1, RPB2, TEF1α, and Mcm7; the last has recently been shown to have exceptional phylogenetic power (Aguileta et al. Reference Aguileta, Marthey, Chiapello, Lebrun, Rodolphe, Fournier, Gendrault-Jacquemard and Giraud2008; Schmitt et al. Reference Schmitt, Crespo, Divakar, Fanhauser, Herman-Sackett, Kalb, Nelsen, Nelson, Rivas-Plata and Shimp2009).
Phylogenetic relationships within the cetrarioid core
Previous studies have excluded Dactylina arctica, Esslingeriana idahoensis, Melanelia hepatizon and M. stygia from the cetrarioid core, instead suggesting that they are closely allied with it (Thell et al. Reference Thell, Stenroos, Feuerer, Kärnefelt, Myllys and Hyvönen2002, Reference Thell, Högnabba, Elix, Feuerer, Kärnefelt, Myllys, Randlane, Saag, Stenroos, Ahti and Seaward2009), while others (Crespo et al. Reference Crespo, Lumbsch, Mattsson, Blanco, Divakar, Articus, Wiklund, Bawingan and Wedin2007) placed D. arctica, M. hepatizon and M. stygia in the cetrarioid clade (E. idahoensis was not investigated in that study). Their inclusion in the cetrarioid core seems justified as these taxa have been considered to have the cetrarioid growth form (Thell et al. Reference Thell, Stenroos, Feuerer, Kärnefelt, Myllys and Hyvönen2002), though some studies have considered M. hepatizon and M. stygia to have a parmelioid growth form (Crespo et al. Reference Crespo, Lumbsch, Mattsson, Blanco, Divakar, Articus, Wiklund, Bawingan and Wedin2007). These taxa are also strongly supported as being sister to (Fig. 1) or included in (D. arctica in Fig. 2) what was previously referred to as the cetrarioid core. Finally, support for the previous cetrarioid core is lacking in the present study (Figs 1 & 2), a result also found in Crespo et al. (Reference Crespo, Kauff, Divakar, del Prado, Pérez-Ortega, Amo de Paz, Ferencova, Blanco, Roca-Valiente and Núñez-Zapata2010). For these reasons, we suggest their inclusion in the cetrarioid core. Consequently, the cetrarioid core group now comprises 17 genera with c. 100 species. See Randlane & Saag (Reference Randlane and Saag1993), Randlane et al. (Reference Randlane, Saag and Thell1997), and the ‘Third World List of Cetrarioid Lichens’ website (http://esamba.bo.bg.ut.ee/checklist/cetrarioid-checklist/home.php), for more information on taxa included in the cetrarioid core.
“Tuckermannopsis” inermis appears distantly related to Tuckermannopsis ciliaris (Fig. 1), the type species of Tuckermannopsis. Instead, “T.” inermis is strongly supported as being sister to Masonhalea richardsonii (Figs 1 & 2). Thell et al. (Reference Thell, Högnabba, Elix, Feuerer, Kärnefelt, Myllys, Randlane, Saag, Stenroos, Ahti and Seaward2009) recovered this same relationship and noted the similarities between these two taxa: lateral apothecia, conspicuous pseudocyphellae (which differ in their location and pattern), and an arctic distribution. We debated transferring “T.” inermis to Masonhalea despite their differences in gross morphology. This lack of gross morphological similarity would have probably surprised and disconcerted some researchers, but many genera, such as Cladia, Coenogonium, Icmadophila and Xanthoparmelia (Rambold et al. Reference Rambold, Triebel and Hertel1993; Blanco et al. Reference Blanco, Crespo, Elix, Hawksworth and Lumbsch2004b; Rivas Plata et al. Reference Rivas Plata, Lücking, Aptroot, Sipman, Umana, Chaves and Lizano2006; Crespo et al. Reference Crespo, Kauff, Divakar, del Prado, Pérez-Ortega, Amo de Paz, Ferencova, Blanco, Roca-Valiente and Núñez-Zapata2010; Parnmen et al. Reference Parnmen, Rangsiruji, Mongkolsuk, Boonpragob, Elix and Lumbsch2010), are composed of species with a broad range of morphologies. Ultimately, we have refrained from formally combining this taxon and prefer to wait for a second collection from which DNA can be obtained to confirm its phylogenetic position. If it is confirmed, taxonomists will be faced with the choice of erecting a new monospecific genus for “T.” inermis, or combining it with Masonhalea, thereby creating a genus of morphologically heterogeneous species.
Generic concepts
The non-monophyly of so many genera in the cetrarioid core ultimately results in a situation in which either new genera must be created to accommodate orphaned species (e.g. “Cetraria” annae, “Cetraria” obtusata, “Cetraria” sepincola, “Flavocetraria” minuscula, “Nephromopsis” ornata), or these orphaned taxa be included in previously described genera. We have refrained from making numerous taxonomic changes here, partly because the non-monophyly of these genera is weakly supported in many cases. A number of other taxa (such as Cetraria subalpina, Tuckermannopsis platyphylla and several Melanelia species) should be included in future studies to clarify further generic delimitations. However, to aid in the decision of whether to create new genera or lump orphaned taxa into existing genera, we chose to compare the genus concepts within the cetrarioid core with other Parmeliaceae genera by estimating the maximum intrageneric genetic distance within a number of genera. Our comparison of intrageneric distances was not intended to be exhaustive. Additionally, numerous genera were not included and only a fraction of the species encompassed within each genus was included; nevertheless, we feel this provides at least a preliminary estimate of the range of genetic variation cetrarioid genera contain relative to other Parmeliaceae genera.
A similar study was previously performed by Lumbsch (Reference Lumbsch2002), in which 58 Parmeliaceae ITS sequences were included, which allowed for intrageneric distance estimates for 15 Parmeliaceae genera (six from the cetrarioid core). In the present study, we have included 231 ITS sequences, from 22 Parmeliaceae genera outside the cetrarioid core and 20 genera or other assembleges (e.g. Kaernefeltia + Tuckermanella, Tuckermannopsis s. str. + Ahtiana sphaerosporella) of the cetrarioid core.
Differences in genetic distances may result from several factors (discussed in Lumbsch Reference Lumbsch2002), including differences among the ages of genera, the rates of molecular evolution within genera, the rates of morphological evolution within genera, and the historic tendencies of taxonomists (to split or lump). Because of these potential sources of variation in intrageneric genetic distances, we do not advocate a strict approach to generic delimitation based on genetic distance, rather, we simply wanted to estimate how genetically disparate generic delimitations were, and how those in the cetrarioid core compared to other Parmeliaceae genera. Our non-statistical comparison of maximum intrageneric ITS distances suggests that cetrarioid taxa are more narrowly circumscribed than other currently recognized groups of Parmeliaceae. We also note that some of these results are in conflict with those of del Prado et al. (Reference del Prado, Cubas, Lumbsch, Divakar, Blanco, Amo de Paz, Molina and Crespo2010), a study which included 491 ITS sequences from parmelioid genera. For instance, in the present study, Parmotrema was found to encompass a greater amount of genetic distance than Xanthoparmelia, a result which is the opposite of that in del Prado et al. (Reference Crespo, Kauff, Divakar, del Prado, Pérez-Ortega, Amo de Paz, Ferencova, Blanco, Roca-Valiente and Núñez-Zapata2010). These discrepancies may be due to a number of factors including taxon selection and the differing methods employed. We feel, however, that we still have a high proportion of the intrageneric diversity represented in the cetrarioid core genera; therefore our estimates within these groups may be more accurate than our estimates of non-cetrarioid core genera. The discrepancy with del Prado et al.'s (Reference del Prado, Cubas, Lumbsch, Divakar, Blanco, Amo de Paz, Molina and Crespo2010) results suggests that we may have underestimated the maximum intrageneric genetic distance of some genera outside the cetrarioid core. If this is the case, the ranks of cetrarioid core genera in Fig. 3 could drop lower than they currently are (relative to non-cetrarioid genera), further illustrating the point that cetrarioid core genera may be more finely divided (based on maximum intrageneric genetic distance) than other Parmeliaceae genera.
Additional independent support for this view is the current lack of anatomical or cell-wall chemical characters correlated with the current generic distinctions. In the case of the parmelioid core of the family, researchers have found and stressed differences in ascospores, conidia, and cell-wall polysaccharides correlated with the molecularly revealed clades when revising generic-level taxonomies (Crespo et al. Reference Crespo and Divakar2011). Where such correlations are absent, some lichenologists would question whether generic rank was appropriate as such differences would be expected for generic separations in both crustose lichens and especially non-lichenized ascomycetes. Further critical studies of anatomical features of the ascomata and conidiomata in the cetrarioid lichens would therefore be desirable before formalizing a revised generic system.
Taxonomy
Cetrariella sorediella (Lettau) V. J. Rico & A. Thell comb. nov
MycoBank No.: MB 561568
Cetraria commixta f. sorediella Lettau, Hedwigia 60: 119 (1918) (basionym).—Cetraria fahlunensis var. sorediella (Lettau) Räsänen, Kuopion Luon.Ystäv. Yhdist. Julk., ser. B, 2 (6): 38 (1952).—Melanelia commixta var. sorediella (Lettau) Hafellner & Türk, Stapfia 76: 153 (2001).—Melanelia sorediella (Lettau) V. J. Rico et al., Lichenologist 37: 205 (2005).
Rico et al. (Reference Rico, van den Boom and Barrasa2005) did not accept the placement of Cetrariella commixta in Cetrariella, instead referring to it as “Melanelia” commixta. Regardless of its generic name, this taxon appears sister to Melanelia sorediella, which in turn forms a clade sister to Cetrariella, a result which was strongly supported in the Bayesian analysis of the full data set (Fig. 1) and in both analyses of the 3+ data set (Fig. 2). The retention of these two taxa in Melanelia is not an option as they are distantly related to M. stygia, the type species of Melanelia. Rather than introduce another genus for “M.” sorediella and C. commixta, we propose to add “M.” sorediella to Cetrariella and support the inclusion of C. commixta in Cetrariella (rather than Melanelia).
Flavocetrariella D. D. Awasthi
Comp. Macrolich.India, Nepal Sri Lanka : 161 (2007). Type species: F. leucostigma (Lév.) D. D. Awasthi.
Awasthi (Reference Awasthi2007) introduced the new generic name Flavocetrariella for the species previously known as Nephromopsis leucostigma and N. melaloma, and suggested a relationship with Flavocetraria. In our molecular study the type species (F. leucostigma) is clustered within Nephromopsis and this result is in concordance with Thell et al. (Reference Thell, Randlane, Saag and Kärnefelt2005, Reference Thell, Högnabba, Elix, Feuerer, Kärnefelt, Myllys, Randlane, Saag, Stenroos, Ahti and Seaward2009); we therefore recommend the treatment of Flavocetrariella as a synonym of Nephromopsis Müll. Arg. 1891 and the retention of F. leucostigma and F. melaloma in Nephromopsis.
Conclusions
In this study, we have illustrated the potential the RPB1 gene offers for resolving the cetrarioid core group. The data set analyzed has confirmed many previously reported relationships, but often with increased support values. Approximately half of the genera in the cetrarioid core were not monophyletic, and two taxonomic changes have been made to help address this issue. Finally, maximum intrageneric genetic distance estimates suggested that many genera in the cetrarioid core group are narrowly defined relative to other Parmeliaceae genera. Consequently, justification for their continued retention needs to be sought through critical studies of ascomatal and conidiomatal features, in particular of a larger proportion of the taxa belonging to the cetrarioid core.
Kevin Feldheim and Fabian Ernemann are thanked for laboratory training and assistance. This work resulted from the Encyclopedia Of Life (EOL) Parmeliaceae meeting in Chicago, May 2010. We thank David Hawksworth and two anonymous reviewers for their helpful comments which improved the manuscript. Natali Chavez was supported by the DePaul University branch of the CIRRUS Program. Tiina Randlane was financed by the Estonian Science Foundation (grant 7470). All molecular work was performed in the Pritzker Laboratory for Molecular Systematics and Evolution at the Field Museum.


