


Introduction
Species richness is not evenly distributed across the tree of life and evolutionary forces have resulted in some lineages comprising an extraordinarily large number of species (Büdel et al. Reference Büdel, Colesie, Green, Grube, Lázaro Suau, Loewen-Schneider, Maier, Peer, Pintado and Raggio2014). Understanding how these exceptionally species-rich lineages arose is a central pursuit of evolutionary biology (Rabosky et al. Reference Rabosky, Donnellan, Talaba and Lovette2007). Elucidating potential causes of the vast disparities in species numbers among clades has broad-ranging implications, from evolutionary theory to biodiversity conservation and to systematics.
Clade age and differences in per-lineage rates of speciation have generally been invoked to explain disparities in the number of species among groups (Benton & Emerson Reference Benton and Emerson2007; McPeek & Brown Reference McPeek and Brown2007). These observations are based, in part, on studies investigating variation in diversification rates across deep phylogenetic and taxonomic scales, such as angiosperms (Magallón & Castillo Reference Magallón and Castillo2009), amphibians (Roelants et al. Reference Roelants, Gower, Wilkinson, Loader, Biju, Guillaume, Moriau and Bossuyt2007) or passerine birds (Jetz et al. Reference Jetz, Thomas, Joy, Hartmann and Mooers2012). However, other factors, in addition to clade age and speciation rates, are likely contribute to the creation of hyperdiverse radiations. These may include climatic shifts (Tolley et al. Reference Tolley, Chase and Forest2008), species interactions (Susoy & Herrmann Reference Susoy and Herrmann2014) and dispersal capacity (Claramunt et al. Reference Claramunt, Derryberry, Remsen and Brumfield2012). How these forces interact to create extremely diverse lineages and their relative importance can be investigated by focusing on radiations at lower taxonomic scales, and by investigating a broad range of factors potentially influencing discrepancies in species richness across lineages (Papadopoulou & Knowles Reference Papadopoulou and Knowles2016).
The current perspective of factors driving variation of species richness across extant clades is generally biased towards arctic and temperate/tropical forest regions, with much less focus on arid habitats (Byrne et al. Reference Byrne, Yeates, Joseph, Kearney, Bowler, Williams, Cooper, Donnellan, Keogh and Leys2008). However, arid and semi-arid regions occupy approximately one third of the Earth’s total terrestrial environments, incorporating diverse habitats across the world. Many of these regions, including arid and semi-arid habitats in Australia and the Cape Region of South Africa, harbour unique and diverse biological communities (Crisp et al. Reference Crisp, Cook and Steane2004) and are particularly vulnerable to environmental disturbances (Bowker et al. Reference Bowker, Miller, Belnap, Sisk and Johnson2008).
In lichen-forming fungi, only a limited number of genera are known to be ultradiverse (>500 species; two genera), hyperdiverse (201–500 species; 17 genera) or megadiverse (genera with 101–200 species) (Lücking et al. Reference Lücking, Hodkinson and Leavitt2016). These can provide singular examples to identify factors that generate disproportionately high levels of diversity. With more than 800 described species (Thell et al. Reference Thell, Crespo, Divakar, Kärnefelt, Leavitt, Lumbsch and Seaward2012), Xanthoparmelia is the most diverse genus of lichen-forming fungi. Congeners occur in exposed environments worldwide and are particularly abundant in arid regions (Hale Reference Hale1990; Elix Reference Elix1994). Radiations within this genus are hypothesized to be associated with a shift to a drier habitat (Lumbsch et al. Reference Lumbsch, Hipp, Divakar, Blanco and Crespo2008), a switch to rocks and soils (Divakar et al. Reference Divakar, Kauff, Crespo, Leavitt and Lumbsch2013), and the emergence of novel arid habitats in the Southern Hemisphere after the splitting of modern Australia from South America (Amo de Paz et al. Reference Amo de Paz, Cubas, Divakar, Lumbsch and Crespo2011). Recent research is consistent with these hypotheses, which show a correlation between the increased speciation rate in Xanthoparmelia and the expansion of drylands during the Oligocene-Miocene transition (Kraichak et al. Reference Kraichak, Divakar, Crespo, Leavitt, Nelsen, Lücking and Lumbsch2015).
Xanthoparmelia has two main centres of diversity, Australia and the Cape Region of South Africa. Each region harbours distinct assemblages of largely endemic species and more than 300 species are known to occur in each region. However, biogeographical patterns of regional endemism in both Australia and Africa cannot be explained by vicariance since these landmasses separated much earlier than the origin of Xanthoparmelia (Amo de Paz et al. Reference Amo de Paz, Cubas, Divakar, Lumbsch and Crespo2011). Therefore, both long-distance dispersal and regional radiations appear to have played important roles in shaping Xanthoparmelia diversity. For example, the ‘Xanthoparmelia pulla group’ originated in South Africa and diversified during the Miocene, with different lineages migrating to multiple distinct geographical regions via long-distance dispersal and subsequent radiations (Amo de Paz et al. Reference Amo de Paz, Cubas, Crespo, Elix and Lumbsch2012). Whether the high levels of diversity in Australia and southern Africa are associated with continuously high rates of speciation since its origin or more recent radiations tied to increasing aridification during the late Pliocene remains untested.
In contrast to the high diversity in Australia and the Cape Region, North and South America each harbour only c. 100 species, with even fewer species distributed across Asia and Europe (Hale Reference Hale1990). Current evidence indicates that the diversity of most North American Xanthoparmelia species originated during the Pliocene and Pleistocene (Leavitt et al. Reference Leavitt, Lumbsch, Stenroos and St. Clair2013), long after the initial diversification of the genus during the late Oligocene or early Miocene (Divakar et al. Reference Divakar, Crespo, Wedin, Leavitt, Hawksworth, Myllys, McCune, Randlane, Bjerke and Ohmura2015). However, it is not known whether the lower diversity in Asia, North and South America, and Europe is a result of more recent evolutionary histories than the diversifications in Africa and Australia. Alternatively, speciation rates may be accelerated in the two centres of Xanthoparmelia diversity (Lumbsch et al. Reference Lumbsch, Hipp, Divakar, Blanco and Crespo2008), thus reflecting differences in diversification dynamics rather than clade age.
To provide an insight into factors that have generated ultradiversity in Xanthoparmelia, we sampled 191 Xanthoparmelia specimens collected from populations throughout the world, with an emphasis on Australia, East Africa, the Cape Region of South Africa and North America. Our overall objective was to address diversification patterns and the historical biogeography in this species-rich genus. Specifically, our aim was to elucidate the geographical origin of Xanthoparmelia and better understand the temporal and geographical context for diversification in this lineage. To meet these aims, we used multilocus sequence data, including a novel approach to generate locus-specific molecular sequence data from high throughput metagenomic reads, to: 1) reconstruct evolutionary relationships in Xanthoparmelia, providing the most comprehensive phylogeny to date for this group; 2) estimate divergence times for major lineages; 3) reconstruct biogeographical histories.
Materials and Methods
Specimen sampling
Data from a total of 200 specimens were included in this study, including sequences from previous studies and newly generated sequences from 105 freshly collected specimens (see Supplementary Material Table S1, available online). The focal group, Xanthoparmelia, included 191 specimens representing 124 species/species-level lineages collected from worldwide populations. Our sampling emphasized species occurring in Africa (both South and eastern Africa), Australia and North America, in addition to a more limited sampling in Asia, Europe and South America. Specimens collected for this study were inspected under an Olympus SZH stereomicroscope and extrolites were identified using thin-layer chromatography (TLC) in solvent system A or G (Orange et al. Reference Orange, James and White2001). Specimen identifications followed Hale (Reference Hale1990), Esslinger (Reference Esslinger1977) and more recent taxonomic treatments (Nash et al. Reference Nash, Gries and Elix1995; Elix Reference Elix2001, Reference Elix2003; Nash Reference Nash2016). Representatives from other genera closely related to Xanthoparmelia were also included in the molecular phylogenetic analyses: Austroparmelina pruinata, Canoparmelia crozalsiana, C. texana, Canoparmelia sp., Cetrelia cetrarioides, Flavoparmelia marchantii, Parmotrema crinitum and Punctelia aff. bolliana. Outgroup taxa (Melanelixia glabroides and Melanohalea clairi) were selected based on previous studies (Crespo et al. Reference Crespo, Kauff, Divakar, del Prado, Pérez-Ortega, Amo de Paz, Ferencova, Blanco, Roca-Valiente and Núñez-Zapata2010; Divakar et al. Reference Divakar, Crespo, Wedin, Leavitt, Hawksworth, Myllys, McCune, Randlane, Bjerke and Ohmura2015).
DNA extraction, amplification and sequencing
Total genomic DNA was extracted from specimens collected for this study using either the USB PrepEase Genomic DNA Kit (Affymetrix, Santa Clara, CA, USA; product discontinued) or the ZR Fungal/Bacterial DNA Miniprep Kit (Zymo Research). For this study we generated molecular sequence data for a total of nine markers: two nuclear ribosomal loci including a gene encoding the large-subunit (nuLSU) and the internal transcribed spacer region (ITS); a fragment of the gene encoding the mitochondrial small subunit (mtSSU); fragments from six nuclear protein-coding loci, including β-tubulin, glyceraldehyde-3-phosphate dehydrogenase (GAPDH), mini-chromosome maintenance complex component 7 (Mcm7), RNA polymerase II subunit 1 (RPB1), RNA polymerase II subunit 2 (RPB2), and the pre-rRNA processing Trypanosoma serine–arginine 1 (Tsr1). Sequences were generated using either Sanger sequencing or assembling consensus sequences from metagenomic reads from Illumina’s NextSeq and MiSeq platforms (Illumina, San Diego, CA, USA). Conditions for polymerase chain reaction (PCR) amplifications for all loci follow previous studies (Blanco et al. Reference Blanco, Crespo, Elix, Hawksworth and Lumbsch2004; Schmitt et al. Reference Schmitt, Crespo, Divakar, Fankhauser, Herman-Sackett, Kalb, Nelsen, Rivas-Plata, Shimp and Widhelm2009; Leavitt et al. Reference Leavitt, Lumbsch, Stenroos and St. Clair2013). PCR amplifications were performed using Ready-To-Go PCR Beads (GE Healthcare, Pittsburgh, PA, USA) and cycling parameters followed a 55–50°C touchdown reaction (Lindblom & Ekman Reference Lindblom and Ekman2006). PCR products were visualized on 1% agarose gel and cleaned using ExoSAP-IT (USB, Cleveland, OH, USA), following the manufacturer’s recommendations. We sequenced complementary strands with the same primers used for PCR amplifications and sequencing reactions were performed using BigDye 3.1 (Applied Biosystems, Foster City, CA, USA). Products were run on an ABI 3730 automated sequencer (Applied Biosystems) at the Pritzker Laboratory for Molecular Systematics and Evolution at the Field Museum, Chicago, USA.
Metagenomic reads were generated from a total of 47 Xanthoparmelia specimens. Libraries were constructed from total DNA extractions (from intact Xanthoparmelia thalli) using either the TruSeq DNA PCR-Free Library Preparation Kit or the Nextera XT DNA Library Preparation Kit (Illumina, San Diego, CA), following the manufacturers’ recommendations. TruSeq libraries were sequenced on Illumina’s MiSeq platform at the Pritzker Laboratory for Molecular Systematics and Evolution at the Field Museum, Chicago, USA. Nextera libraries were sequenced on the NextSeq platform at the Core Genomics Facility at the University of Illinois at Chicago, USA.
Sequencing assembly and alignments
Sanger reads were assembled and edited using the program Sequencher 4.10 (Gene Codes Corporation, Ann Arbor, MI). Sequences were assembled from Illumina metagenomic reads for the nine sampled loci (ITS, nuLSU, mtSSU, β-tubulin, GAPDH, Mcm7, RPB1, RPB2 and Tsr1). Reads from each specimen were mapped to reference sequences of each of the nine markers (ITS, GenBank Accession no. AY581063; nuLSU, HM125760; mtSSU, KR995373; β-tubulin, HM577782; GAPDH, AY249628; Mcm7, HM579689; RPB1, EF092115; RPB2, MG695956 and Tsr1, MG696003) using the ‘Map to Reference’ feature in the program Geneious v.6.1.8. We used the ‘Medium-Low Sensitivity’ option, with fine tuning set to ‘Iterate up to 5 times’. The iterative read mapping extended the loci beyond the reference sequences and we exported consensus sequences from the extended mappings from each locus for subsequent analyses.
Sequences were aligned using the program MAFFT v.7 (Katoh et al. Reference Katoh, Kuma, Toh and Miyata2005; Katoh & Toh Reference Katoh and Toh2008). We implemented the G-INS-i alignment algorithm and ‘1PAM/K=2’ scoring matrix, with an offset value of 0·9, and the remaining parameters were set to default values for the protein-coding (β-tubulin, GAPDH, Mcm7, RPB1, RPB2 and Tsr1) and nuLSU markers. For the ribosomal ITS and mtSSU, we used the same parameters, with the exception of an offset value set to 0·1 rather than 0·9 and ‘unalignlevel’ set to 0·6. Furthermore, ambiguously aligned regions were delimited and removed from the mtSSU and GAPDH alignments using the Gblocks webserver (Talavera & Castresana Reference Talavera and Castresana2007; http://molevol.cmima.csic.es/castresana/Gblocks_server.html), implementing the options for a less stringent selection including ‘Allow smaller final blocks’, ‘Allow gap positions within the final blocks’ and ‘Allow less strict flanking positions’.
Phylogenetic inference
Phylogenetic relationships among the sampled fungal lineages were inferred using both maximum likelihood (ML) and Bayesian inference (BI) methods. Exploratory phylogenetic analyses of individual gene topologies showed no evidence of well-supported topological conflict (conflicting nodes with ≥70% bootstrap values; data not shown). Hence, we chose to infer relationships using a concatenated gene-tree approach based on the complete, nine-locus data matrix (n=200) which included c. 45% missing data (see Supplementary Material Table S1, available online). An ML topology was reconstructed from the nine-locus matrix using the program RAxML v.8.2.1 (Stamatakis Reference Stamatakis2006; Stamatakis et al. Reference Stamatakis, Hoover and Rougemont2008) in the CIPRES Science Gateway server (http://www.phylo.org/portal2/), treating each locus as a separate partition and implementing the ‘GTRGAMMA’ model. Nodal support was evaluated using 1000 bootstrap pseudoreplicates. Exploratory analyses of alternative partition strategies provided highly similar topologies and nodal support values.
Divergence estimates
We attempted to place the diversification history of Xanthoparmelia taxa in a temporal context using the program BEAST v.1.8.3 (Drummond & Rambaut Reference Drummond and Rambaut2007; Heled & Drummond Reference Heled and Drummond2010) and based on secondary calibrations. We used a node-calibrated approach based on recent divergence estimates for Parmeliaceae (Divakar et al. Reference Divakar, Crespo, Wedin, Leavitt, Hawksworth, Myllys, McCune, Randlane, Bjerke and Ohmura2015). Specifically, we set the age of the most recent common ancestor (MRCA) of Austroparmelina, Canoparmelia s. lat., Cetrelia, Flavoparmelia, Flavopunctelia, Parmotrema, Punctelia and Xanthoparmelia to 60·55 Mya (node ‘8’ in Divakar et al. (Reference Divakar, Crespo, Wedin, Leavitt, Hawksworth, Myllys, McCune, Randlane, Bjerke and Ohmura2015)), with a second node calibration set to 52 Mya for the MRCA of Austroparmelina, Flavoparmelia and Parmotrema (Divakar et al. Reference Divakar, Crespo, Wedin, Leavitt, Hawksworth, Myllys, McCune, Randlane, Bjerke and Ohmura2015). A normal prior distribution was set to calibrate both nodes, with standard deviations set to ‘5’ and ‘4’ for each node, respectively, to approximate the 95% confidence intervals inferred previously (Divakar et al. Reference Divakar, Crespo, Wedin, Leavitt, Hawksworth, Myllys, McCune, Randlane, Bjerke and Ohmura2015). The BI analyses were performed under a Yule speciation process prior and with the data matrix partitioned by individual gene regions. Substitution models for each locus were estimated using jModelTest v.2.1.10 (Darriba et al. Reference Darriba, Taboada, Doallo and Posada2012). Divergence times were estimated under both a strict molecular clock and an uncorrelated relaxed lognormal molecular clock (Drummond et al. Reference Drummond, Ho, Phillips and Rambaut2006). For both strict and relaxed lognormal estimates, two independent MCMC runs of 50 million generations were performed, sampling every 1500 steps. Chain mixing and convergence were inspected using the program Tracer v.1.6 (Rambaut & Drummond Reference Rambaut and Drummond2003), considering ESS (effective sample size) values >200 as good indicators. After excluding the first 25% of sampled trees as burn-in, trees from the two independent runs were combined using the program LogCombiner v.1.8.3 (Rambaut & Drummond Reference Rambaut and Drummond2013), and the final MCC tree was estimated from the combined posterior distribution of trees using TreeAnnotator v.1.8.3 (Rambaut & Drummond Reference Rambaut and Drummond2009).
Ancestral range reconstructions
The biogeographical history of Xanthoparmelia was reconstructed using the dispersal, extinction and cladogenesis model DEC (Ree & Smith Reference Ree and Smith2008) and the DEC + J (founder event speciation) model (Matzke Reference Matzke2014), with all analyses performed using the R package BioGeoBEARS (Matzke Reference Matzke2014). As an input topology for BioGeoBEARS, we used the BEAST chronogram inferred under a strict clock after excluding the outgroup specimens and all but one specimen in each species-level lineage in the concatenated BEAST tree using the ‘drop.tip’ function in the ‘ape’ R package (Paradis et al. Reference Paradis, Claude and Strimmer2004). Each tip was assigned to continent-wide geographical states where the lineage occurs, for example Africa, Asia, Australia, Europe, North America and South America (see Supplementary Material Table S1, available online). Species occurring across broad, intercontinental distributions were assigned to multiple states in the BioGeoBEARS analyses corresponding to their distribution. Since exploratory analyses revealed that Xanthoparmelia species in South Africa and East Africa (Kenya) were recovered in different lineages distributed across the phylogeny, specimens from Africa were divided into two geographical regions, ‘East Africa’ and ‘South Africa’, which included a single specimen from Namibia. Species/lineage distributions were generally obtained from selected literature (Hale Reference Hale1990; Amo de Paz et al. Reference Amo de Paz, Lumbsch, Cubas, Elix and Crespo2010 a, Reference Amo de Paz, Cubas, Crespo, Elix and Lumbsch2012; Leavitt et al. 2011 Reference Leavitt, Johnson and St. Claira , Reference Leavitt, Johnson, Goward and St. Clairb , Reference Leavitt, Lumbsch, Stenroos and St. Clair2013). In cases where a nominal taxon was found to have a well-supported phylogeographical substructure, we treated each clade comprised of specimens from a distinct geographical region as a separate species-level lineage. Similarly, lineages in nominal taxa that were not recovered as monophyletic or were recovered with a deep phylogenetic substructure were also treated as separate, putative lineages. Geographical distributions of each sampled species/species-level lineage can be found in Supplementary Table S1 (available online). Subsequently, we used the likelihood ratio test and the Akaike Information Criterion (AIC) for comparing different biogeographical history reconstructions.
Results
New sequences generated in association with this study have been deposited in GenBank under Accession numbers MG695404–MG696048 and MG825903–MG825905. The complete data matrix (n=200 specimens; Supplementary Material Table S1) included 11475 aligned nucleotide position characters across the nine selected loci and was submitted to TreeBASE (submission no. 20980). Additional alignment information, including the inferred substitution models, is reported in Table 1.
Table 1 List of loci included in the study, including alignment length (in number of base pairs =bp) and the nucleotide substitution model used in the analysis, selected by the Akaike Information Criterion (AIC) in jModelTest

Both the BEAST (Fig. 1; Supplementary Material Fig. S1) and ML (Supplementary Material Fig. S2) reconstructions resulted in similar branching patterns and nodal support values across the topology, although a limited number of well-supported clades in the BEAST topology (posterior probabilities (PP)>0·95) were recovered with only moderate to weak statistical support in the ML topology (bootstrap (BS)<70%). In all analyses, Xanthoparmelia was recovered as monophyletic with strong statistical support. Relationships among clades within Xanthoparmelia were generally recovered with strong statistical support, although a small number of backbone relationships remained unsupported (Fig. 1). A number of well-supported, infrageneric lineages were recovered within Xanthoparmelia, many of which consisted of species from distinct geographical regions, and multiple East African, South African and Australian clades were distributed across the phylogeny (Fig. 1). Other well-supported clades included species that corresponded to members of genera that were found to be nested within Xanthoparmelia in previous studies, such as Almbornia, Chrondropsis, Karoowia, Namakwa, Neofuselia, Omphalodiella, Paraparmelia and Xanthomaculina (Fig. 1).

Fig. 1 Time-calibrated chronogram for Xanthoparmelia inferred from a nine-locus, concatenated data matrix (only the Xanthoparmelia clade is shown; complete BEAST topology is reported in Supplementary Fig. S1, available online). Provisionally named clades are indicated to the right of the chronogram and shortened, abbreviated codes are found at corresponding nodes. In cases where the geographical origin of the specimen does not coincide with a clade’s provisional name, or the provisional name is geographically ambiguous, the geographical origin of the species is shown in red. Clades representing genera that have previously been synonymized with Xanthoparmelia are indicated with coloured dots along branches. Note that X. neotumidosa in the ‘South Africa 2’ clade was not previously circumscribed within Karoowia. Posterior probabilities ≥0·95 from the Bayesian analysis are indicated by thickened branches and nodal support<0·95 is represented by thinner, grey branches. The Oligocene (‘Oli’), Miocene, Pliocene (‘Pli’) and Pleistocene (‘Ple’) epochs and the scale of branch lengths (in Mya) are indicated above and below the chronogram, respectively.
Nodal support values were very similar across different BEAST analyses. Divergence estimates for Xanthoparmelia were also largely similar for inferences under both a relaxed and strict clock, although dates inferred under a relaxed clock tended to be slightly older (data not shown). However, low ESS values (<50) were obtained for many parameters in the analyses implementing a relaxed molecular clock. Therefore, the relationships and divergence dates estimated under a relaxed clock were not considered further. In contrast, ESS values for nearly all parameters were >200 for the analyses using a strict clock; therefore, we used a maximum clade credibility chronogram inferred from the combined posterior sampling of the two independent runs as our best estimate of divergence times for Xanthoparmelia (Fig. 1). Consistent with previous estimates, the MRCA for Xanthoparmelia was estimated near the Oligocene-Miocene boundary 23 million years ago (Mya) (Highest Posterior Density (HPD)=20·0–26·6 Mya; Fig. 1). Our results suggested a Miocene-dominated diversification history for Xanthoparmelia, with more limited diversification during the Pliocene and into the Pleistocene (Fig. 1).
Based on current sampling, Asian, European and North American Xanthoparmelia species generally comprised a single well-supported clade, ‘Holarctic clade’ (node ‘H’, Fig. 1), which also included a single South American representative, X. cordillerana (Gyeln.) Hale. Species recovered in this clade were estimated to share an MRCA c. 7·2 Mya (HPD=6·2–8·3 Mya), with diversification continuing into the Pliocene and Pleistocene (Fig. 1). A number of notable exceptions where Asian, European and/or North American species were recovered outside of the ‘Holarctic’ clade included: the widespread taxon X. mougeotii (Schaer.) Hale (‘tegeta clade’), European and Central Asian populations of X. tinctina (Maheu & A. Gillet) Hale (‘Kenya/South Africa 1’ clade), Asian populations of X. saxeti (Stizenb.) Amo de Paz et al. (‘saxeti group’), X. transvaalensis Hale et al. (‘South Africa 3’ clade), and some members of the Xanthoparmelia pulla group, such as X. loxodes (Nyl.) O. Blanco et al. and X. pulla (Ach.) Blanco et al. (‘pulla group’ clade) (Fig. 1).
Australian species were recovered in three well-supported clades including ‘Australia 1’, ‘Australia 2’ and intermixed with species from other locations in the ‘pulla’ clade (node ‘pu’, Fig. 1). The majority of Australian species sampled were recovered within the ‘Australia 1’ clade (node ‘A1’, Fig. 1) and comprised a number of closely related species sharing an MRCA at c. 6·9 Mya (HPD=5·5–8·7 Mya), with a number of closely related species estimated to have diverged during the Pleistocene (Fig. 1). Clade ‘Australia 2’ (node ‘A2’, Fig. 1) comprised three specimens, two of which were identified as X. hypoprotocetrarica but shared an MRCA at c. 5 Mya. Brown Australian Xanthoparmelia species in the ‘pulla’ group (formerly recognized as Neofuscelia) were recovered as monophyletic within the ‘pulla group’ clade.
African species were recovered in nine well-supported clades (three East African, four South African and two East/South African lineages), widely distributed across the phylogeny (nodes ‘K1’, ‘K2’, ‘K3’, ‘S1’, ‘S2’, ‘S3’, ‘S4’, ‘KS1’ and ‘KS2’; Fig. 1). Xanthoparmelia species from East and South Africa were consistently recovered in multiple divergent clades, suggesting a deep evolutionary independence between East and South African Xanthoparmelia species.
Distinct phylogeographical patterns were observed for a number of nominal Xanthoparmelia species, including X. saxeti, X. tinctina and X. verrucigera. Xanthoparmelia saxeti specimens were recovered in four distinct clades corresponding to distinct geographical regions: East Africa, East Asia, Taiwan and South America (node ‘sa’, Fig. 1). The ‘saxeti group’ shares an MRCA near the end of the Pliocene, c. 3·3 Mya. Specimens representing X. tinctina were recovered in two separated clades within the more broadly circumscribed ‘Kenya/South Africa 1’ clade (node ‘KS1’, Fig. 1), one with specimens from East Africa and the other comprising specimens from Europe, with an estimated MRCA at c. 6·4 Mya. A similar pattern was observed for X. verrucigera, within the more broadly circumscribed ‘Kenya/South Africa 2’ clade (node ‘KS2’, Fig. 1), which consisted of two clades, one with specimens from East Africa and the other from Europe. Other nominal taxa were recovered with substantial phylogenetic substructure at regional scales: X. aff. plittii (Kenyan populations; ‘Kenya 2’ clade), X. subramigera (‘Kenya 1’ clade) and X. perspera (‘South Africa 3’ clade) (Fig. 1). The X. subramigera group, clade ‘Kenya 1’, was estimated to share an MRCA at c. 10·1 Mya.
Our ancestral area reconstructions supported an African origin for Xanthoparmelia, with the most likely geographical origin for most species reconstructed as South Africa (Fig. 2). These data support multiple, independent dispersal events from Africa into other continental landmasses where independent radiations occurred (Fig. 2). Specific models and parameters in the ancestral area reconstruction analysis are reported in Table 2.
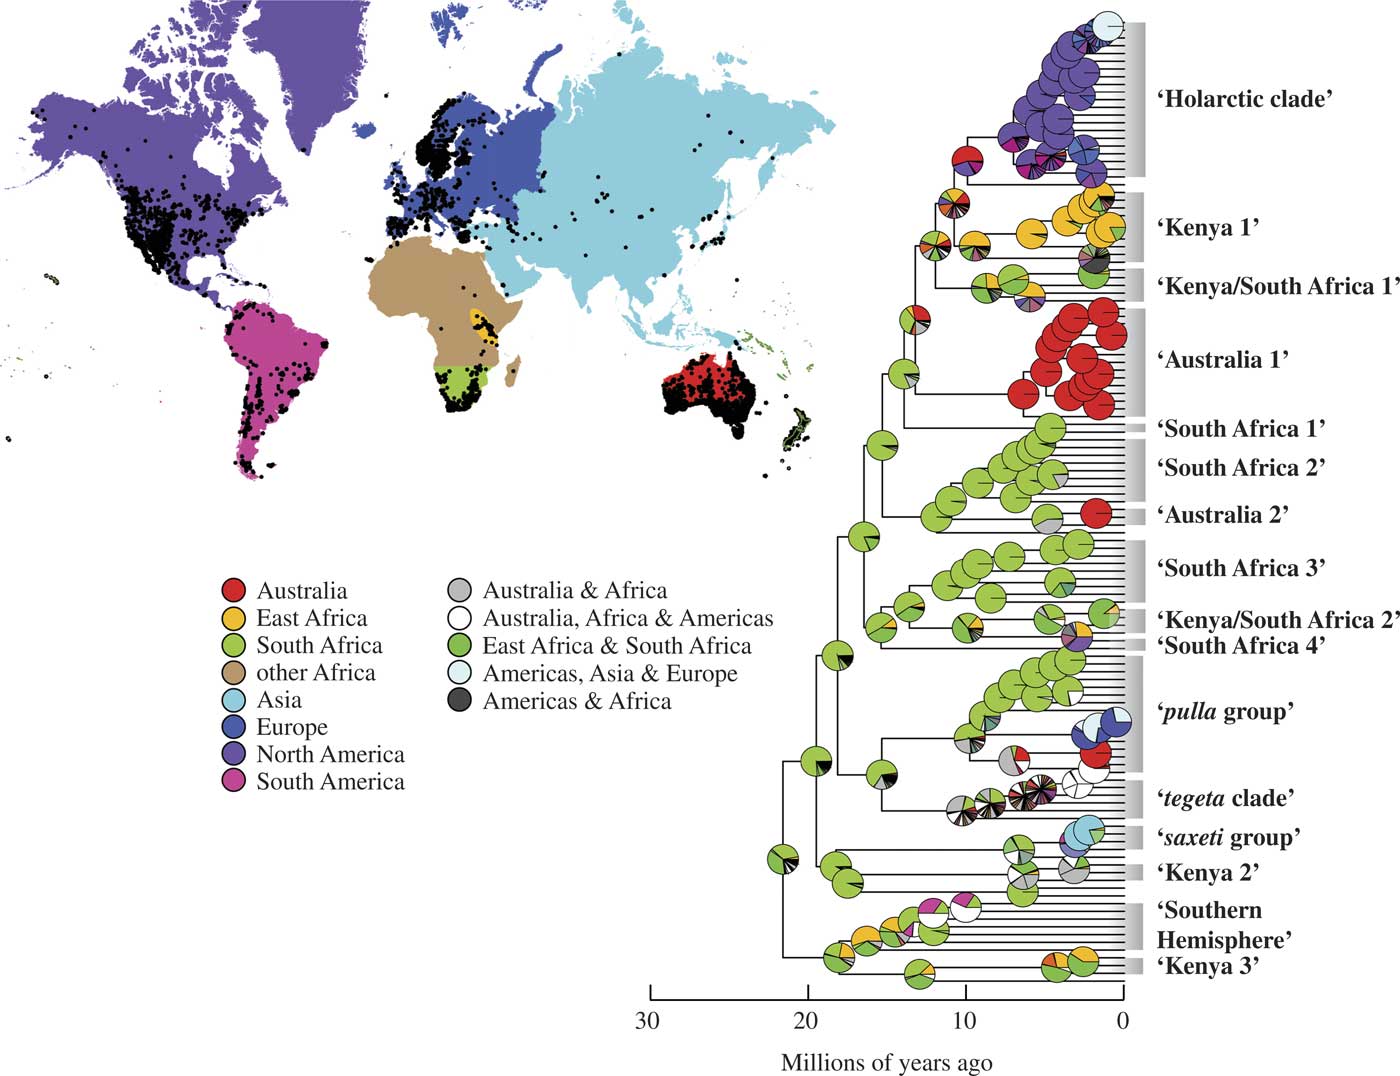
Fig. 2 Maximum likelihood reconstructions of geographical range evolution in Xanthoparmelia according to the DEC (dispersal, extinction and cladogenesis) model using a BioGeoBEARS analysis (only the Xanthoparmelia clade is shown; complete BEAST topology is reported in Supplementary Fig. S1). Pie charts at the nodes represent the relative probabilities of possible geographical ranges, including reconstructions supporting broad, intercontinental ancestral areas. The map represents the geographical distribution of Xanthoparmelia populations and the delimited geographical regions used in ancestral area reconstructions.
Table 2 Parameters of biogeographical models used in the ancestral area reconstructions analysis, including the DEC (dispersal, extinction, and cladogenesis) model and the DEC + J (founder event speciation) model

Parameters: the rate of range expansion (“dispersal”), parameter d; range contraction (“extinction”), parameter e; weight of each jump dispersal event in the cladogenesis matrix, parameter j. Akaike Information Criterion, AIC.
Discussion
The genus Xanthoparmelia is the most species-rich genus of lichen-forming fungi (Jaklitsch et al. Reference Jaklitsch, Baral, Lücking, Lumbsch and Frey2016; Lücking et al. Reference Lücking, Hodkinson and Leavitt2016), despite its relatively recent origin. In this study, we demonstrated that Xanthoparmelia most likely originated in Africa near the Oligocene-Miocene boundary (23·3 Mya; Fig. 2), with a general pattern of subsequent diversification coinciding with global aridification and development of open habitats (Flowers & Kennett Reference Flowers and Kennett1994; Sepulchre et al. Reference Sepulchre, Ramstein, Fluteau, Schuster, Tiercelin and Brunet2006). Other genera in Parmeliaceae that have a similar age of origin, such as Canoparmelia (26 Mya), Montanelia (23 Mya) or Parmelia (23 Mya), have considerably lower species-level diversity (Divakar et al. Reference Divakar, Del-Prado, Lumbsch, Wedin, Esslinger, Leavitt and Crespo2012, Reference Divakar, Crespo, Wedin, Leavitt, Hawksworth, Myllys, McCune, Randlane, Bjerke and Ohmura2015; Molina et al. Reference Molina, Divakar, Goward, Millanes, Lumbsch and Crespo2017).
Xanthoparmelia is known for its broad, intercontinental geographical distribution (Hale Reference Hale1990). Phylogenetic relationships inferred in this study revealed more biogeographical structure within the genus than previously recognized, with a number of well-supported lineages restricted to distinct regions, especially Australia and East or South Africa (Fig. 1). For example, the general pattern of phylogenetic separation of East African vs. South African species of Xanthoparmelia was not expected. In addition, most species occurring in Australia, a centre of diversity for Xanthoparmelia, were recovered in clades exclusively comprised of Australian species (e.g. ‘Australia 1’, ‘Australia 2’ and the Australian clade within the ‘pulla group’ clade; Fig. 1). However, in other lineages, such as the ‘Southern Hemisphere’ and ‘tegeta clade’ (Fig. 1), biogeographical patterns are less apparent and additional sampling may help elucidate a more nuanced perspective.
Given that in the early Miocene the continents had already separated, these results suggest that the evolution of Xanthoparmelia was driven to a large degree by diversification restricted to continents with infrequent intercontinental exchange by long-distance dispersal (see also Amo de Paz et al. Reference Amo de Paz, Cubas, Crespo, Elix and Lumbsch2012). This is consistent with other groups of lichen-forming fungi in which infrequent long-distance dispersal was found (Otálora et al. Reference Otálora, Martínez, Aragón and Molina2010; Sérusiaux et al. Reference Sérusiaux, Villarreal, Wheeler and Goffinet2011; Amo de Paz et al. Reference Amo de Paz, Cubas, Crespo, Elix and Lumbsch2012; Del-Prado et al. Reference Del-Prado, Blanco, Lumbsch, Divakar, Elix, Molina and Crespo2013). Recent studies highlight the promise of incorporating fossil evidence into divergence dating of lichen-forming fungi (Divakar et al. Reference Divakar, Crespo, Wedin, Leavitt, Hawksworth, Myllys, McCune, Randlane, Bjerke and Ohmura2015; Kaasalainen et al. Reference Kaasalainen, Heinrichs, Krings, Myllys, Grabenhorst, Rikkinen and Schmidt2015); however, we caution against over-interpreting our divergence estimates and only include them as a hypothesis-generating approach for considering the temporal context of diversification in this group.
Our study further suggests that the main diversification of the genus took place in Australia and Africa, as indicated by the radiation of early diverging clades within the genus being largely restricted to these continents, with at least two migrations into the Holarctic in the late Miocene or Pliocene. Holarctic samples fell into two clades: the derived ‘Holarctic clade’ and the ‘pulla group’ (Fig. 1). Specimens collected in the Holarctic were also recovered in the ‘tegata’ clade (X. mougeotii), ‘South Africa 3’ clade (X. transvaalensis), ‘Kenya/South Africa 1’ clade (X. tinctina) and the ‘Kenya/South Africa 2’ clade (X. verrucigera) (Fig. 1).
In addition to improved phylogenetic resolution, especially at the backbone of the phylogeny which lacked support in previous studies, and phylogenetic placement of previously unsampled lineages, especially from African and Australian lineages within Xanthoparmelia (Fig. 1), our extended taxon sampling also confirmed the phylogenetic placement of morphologically or chemically diverse taxa which were recently grouped together with Xanthoparmelia (i.e. Almbornia, Chondropsis, Karoowia, Namakwa, Neofuscelia, Paraparmelia, Omphalodiella, Placoparmelia, Xanthomaculina) (Blanco et al. Reference Blanco, Crespo, Elix, Hawksworth and Lumbsch2004; Thell et al. Reference Thell, Feuerer, Elix and Kärnefelt2006; Amo de Paz et al. 2010 Reference Amo de Paz, Lumbsch, Cubas, Elix and Crespoa , Reference Amo de Paz, Lumbsch, Cubas, Elix and Crespob , Reference Amo de Paz, Cubas, Divakar, Lumbsch and Crespo2011; Crespo et al. Reference Crespo, Kauff, Divakar, del Prado, Pérez-Ortega, Amo de Paz, Ferencova, Blanco, Roca-Valiente and Núñez-Zapata2010; Divakar et al. Reference Divakar, Crespo, Wedin, Leavitt, Hawksworth, Myllys, McCune, Randlane, Bjerke and Ohmura2015). In some cases, such as the subcrustose Xanthoparmelia spp. (previously recognized in Karoowia), our phylogenetic estimates suggest that these phenotypes evolved several times independently within the genus (Fig. 1), although this should be tested further. In another lineage, the ‘Southern Hemisphere’ clade (Fig. 1), members of three former genera (Almbornia, Neofuscelia and Omphalodiella) were recovered along with species traditionally recognized as Xanthoparmelia. This phenotypic diversity of growth forms in a single clade within Xanthoparmelia is remarkable given that our estimates suggest that the genus has a relatively recent origin during the early Miocene (Fig. 2). In comparison, fossils of another genus in the Parmeliaceae, Anzia, are dated from the Eocene (c. 40 Mya; Kaasalainen et al. Reference Kaasalainen, Schmidt and Rikkinen2017), and this genus represents markedly less diversity in growth forms than Xanthoparmelia.
In addition, our study indicates issues with species delimitation in Xanthoparmelia, highlighting the fact that in spite of the high levels of species diversity in this genus, traditional taxonomic approaches have failed to adequately characterize this diversity (Leavitt et al. 2011 Reference Leavitt, Johnson and St. Claira , Reference Leavitt, Johnson, Goward and St. Clairb ). While the present study was not designed for dense, intraspecific sampling, multiple representatives of nominal taxa were recovered in separate, well-supported clades in a number of cases. This is consistent with results found in other groups of Parmeliaceae, and lichen-forming fungi in general, further supporting the suggestion that phenotypic delimitation of species in these symbiotic fungi might misrepresent true diversity (Crespo & Pérez-Ortega Reference Crespo and Pérez-Ortega2009; Crespo & Lumbsch Reference Crespo and Lumbsch2010; Lumbsch & Leavitt Reference Lumbsch and Leavitt2011; Leavitt et al. 2016 Reference Leavitt, Divakar, Crespo and Lumbscha ). In contrast to the high morphological variability in Xanthoparmelia, in a number of cases morphologically similar specimens, such as nominal X. plittii (‘Kenya 2’ and ‘Holarctic’ clades, Fig. 1) and X. tasmanica (Hodkinson & Lendemer Reference Hodkinson and Lendemer2011), were found in distinct, deeply divergent clades. A number of specimens from Kenya were identified as X. aff. plittii (‘Kenya 2’ clade, Fig. 1) but were only distantly related to North American and European populations of X. plittii (‘Holarctic clade’, Fig. 1), which was originally described from eastern North America (Gyelnik Reference Gyelnik1931). In fact, the clade comprising all X. aff. plittii lineages from Kenya was recovered as one of the earlier diverging clades in Xanthoparmelia and shared an estimated MRCA with X. plittii populations in North America (‘Holarctic clade’) at c. 19 Mya (Fig. 1).
In some species, including X. saxeti and X. tinctina, populations from distinct geographical regions formed monophyletic groups separated for several million years (Fig. 1). These results revealed that some nominal taxa in Xanthoparmelia have a phylogeographical substructure that potentially corresponds to evolutionarily independent species-level lineages occurring on different continents. A similar pattern was found in the Cladia aggregata complex, where geographically distinct lineages were often interpreted as different species (Parnmen et al. Reference Parnmen, Rangsiruji, Mongkolsuk, Boonpragob, Nutakki and Lumbsch2012, Reference Parnmen, Leavitt, Rangsiruji and Lumbsch2013).
Relative to other genera in the Parmeliaceae, Xanthoparmelia has been shown to associate with a much broader range of algal partners (Leavitt et al. Reference Leavitt, Kraichak, Nelsen, Altermann, Divakar, Alors, Esslinger, Crespo and Lumbsch2015). How this diversity varies across regions and how patterns in symbiont interactions relate to patterns in Xanthoparmelia diversity have not yet been tested. Specifically, whether certain symbiotic associations or the switch between partners might pertain to a higher speciation rate remains untested in lichen-forming fungi. Evaluating the effect of symbiotic relationships, as well as trait-dependent and evolutionary time-dependent factors, on speciation dynamics will provide an insight into how megadiverse lineages arise in symbiotic fungi.
While diversification dynamics associated with increased aridity have been studied for a number of plant (Crisp et al. Reference Crisp, Cook and Steane2004; Griffin & Hoffmann Reference Griffin and Hoffmann2014) and animal groups (Rabosky et al. Reference Rabosky, Donnellan, Grundler and Lovette2014), the diversification dynamics of symbiotic fungal radiations remain poorly characterized. Our study of the ultradiverse lichen-forming fungal genus Xanthoparmelia provides a valuable framework for continued research. However, the exact mechanisms by which Xanthoparmelia became extremely successful in Australia and South Africa are still not clear. Here we show that Xanthoparmelia likely originated in Africa and relatively high levels of species diversity may reflect, in part, clade age. Based on our sampling, Xanthoparmelia in Australia appear to have a more recent origin than African lineages (Fig. 1) but with similar levels of species diversity compared to the African Cape Region. In fact, it appears that diversification in Australian lineages generally coincides with Xanthoparmelia diversification in the Holarctic (‘Australia 1’ and ‘Australia 2’ clades, Fig. 1) but resulted in approximately three times the number of species (Hale Reference Hale1990). Xanthoparmelia has recently been shown to have increased rates of speciation relative to other genera in the Parmeliaceae (Kraichak et al. Reference Kraichak, Divakar, Crespo, Leavitt, Nelsen, Lücking and Lumbsch2015), and the present study suggests there are differences in speciation and/or extinction rates among lineages within Xanthoparmelia. Future studies identifying clades with increased rates of speciation will assist in more precisely identifying factors that drive diversification in this group of symbiotic fungi.
As metagenomic reads from lichen samples become increasingly available, utilizing these data for phylogenetic studies remains largely untested (but see Grewe et al. Reference Grewe, Huang, Leavitt and Lumbsch2017). This study highlights a novel approach for generating multilocus datasets from high-throughput metagenomic sequencing reads. While we generated data for only nine loci here, hundreds to thousands of homologous genomic markers could be recovered from metagenomic data using appropriate genomic references, such as the core eukaryotic genes (Leavitt et al. 2016 Reference Leavitt, Grewe, Widhelm, Muggia, Wray and Lumbschb ) or for universal single-copy orthologs in fungi (Simão et al. Reference Simão, Waterhouse, Ioannidis, Kriventseva and Zdobnov2015), and used to infer robust phylogenomic datasets.
We dedicate this publication to our friend and colleague, Ana Crespo de las Casas, on the occasion of her 70th birthday. Ana has been our mentor and collaborator and contributed enormously to our knowledge of lichenized fungal evolution, especially in the family Parmeliaceae. We appreciate the thoughtful comments and perspective from Associate Editor Mats Wedin and constructive feedback from anonymous reviewers. We thank Drs. Trevor Goward, Matthew Nelsen, Roger Rosentreter and Larry St. Clair for invaluable conceptual help and insightful comments. We are also indebted to various colleagues for providing material and field assistance, notably Trevor Goward, Larry St. Clair, Prof. Mark Seaward, Roger Rosentreter and the Leavitt family. We thank Dr Kevin Feldheim for his invaluable help with sequencing. The authors thank the Negaunee Foundation and the Field Museum for financial support, and the Lauer family for the generous gift of the MiSeq sequencer to the Pritzker Laboratory for Molecular Systematics at the Field Museum. Additional support was received from the USDA Forest Service and the College of Life Sciences, Brigham Young University.
Supplementary Material
For supplementary material accompanying this paper visit https://doi.org/10.1017/S0024282918000233


