


Introduction
As a simple, cost-effective and easy to use chromatographic technique, thin-layer chromatography (TLC) remains today the primary method used to assess the secondary product content of lichens (Orange et al. Reference Orange, James and White2010; Le Pogam et al. 2015 Reference Le Pogam, Herbette and Boustiea ). The use of new plates for each separation avoids memory effects associated with column-based chromatographic techniques so that TLC is a fitting tool for the direct analysis of crude extracts with minimal preparation procedures. Likewise, the application of multiple samples onto a TLC plate makes this technique appropriate for high-throughput analyses.
In the specific field of lichenology, much effort has been made to improve both the reproducibility and the separation efficiency of TLC.
Standardized methods for routine identification of lichen products by TLC were published in 1970 (Culberson & Kristinsson Reference Culberson and Kristinsson1970; Culberson et al. Reference Culberson, Culberson and Johnson1981) and are still widely used. These guidelines include three standard solvent systems for migration and assign unknown spots to Rf classes defined by comparison with two common lichen metabolites used as marker controls (atranorin and norstictic acid) to limit problems associated with variation in Rf values. Identification possibilities can be narrowed down further according to the 1) appearance of the spot under visible light, 2) colour reaction under short and long-wave UV after H2SO4 spraying, and 3) microchemical reactions. In cases when metabolites cannot be satisfactorily separated by TLC, some pretreatments such as acidic hydrolysis or methylations are required to identify the parent molecule (Culberson Reference Culberson1972). It is noteworthy that two-dimensional TLC was sometimes used for the separation of complex mixtures (Culberson & Johnson Reference Culberson and Johnson1976). To improve separation efficiency, refined TLC techniques arose including high performance TLC (HPTLC) which uses gel particles of small diameter as the stationary phase (4–6 μm instead of the nominal 5–20 μm for regular TLC plates) to increase the number of interactions with the chromatographed molecules (Siouffi Reference Siouffi2005; Sherma Reference Sherma2008). HPTLC separation was performed in the same standardized conditions on a set of 69 lichen substances and their Rf values were collated by Arup and co-workers (Arup et al. Reference Arup, Ekman, Lindblom and Mattsson1993).
To characterize unknown metabolites, one can refer to the aforementioned papers that summarize the chromatographic behaviour of lichen metabolites. Digital tools can now also assist in the identification process. LIAS metabolites is a database containing 881 lichen compounds in which identification of metabolites is made using a combination of characters such as Rf values in standardized solvents, long-wavelength UV exposure and microchemical reactions among others (Rambold et al. Reference Rambold, Elix, Heindl-Tenhunen, Köhler, Nash, Neubacher, Reichert, Zedda and Triebel2014). Although such techniques enable sensitive detection of lichen compounds, these methods are not comprehensive and, being based on functional groups, they poorly discriminate between individual compounds. Hence, even when Rf values and spectroscopic characteristics are fully consistent with those of a standard, one has to keep in mind that the ability to determine molecular structures through such detection techniques remains limited and risky (Cheng et al. Reference Cheng, Huang and Shiea2011). As such, numerous unsafe shortcuts have led to erroneous assignments when distinguishing closely related metabolites. However, TLC still remains the prevalent analytical approach to study the chemistry of lichens, often without the support of other analytical strategies.
Such observations account for the long-held interest in the hyphenation of TLC with analytical tools dedicated to proper structural elucidation. One such tool, mass spectrometry, represents an array of spectroscopic techniques which mainly aim to determine the molecular mass of a molecule and ultimately lead to its identification. To this end, mass spectrometric techniques proceed by measuring the mass to charge ratio (m/z) of charged species (Rathahao-Paris et al. Reference Rathahao-Paris, Alves, Junot and Tabet2016). The production of these charged species, through the so-called ionization process, can lead an individual chemical compound to give rise to one or more fragments that will be observed in the same mass spectrum. Depending on the analytes to be detected, mass spectrometric acquisitions can be carried out either in positive- or in negative-ion mode, based on the trend for the expected analytes to either gain or lose protons. In the case of lichen metabolites, negative ion electrospray mass spectrometry has evolved over recent decades as a useful tool for structural investigation of various classes of polyphenols (Schmidt Reference Schmidt2016). Subsequently, the mass analyzer is the component of the mass spectrometer that separates the ionized masses based on their m/z ratio and forwards them to a detector which will subsequently convert the signal to a digital output. This whole analytical process results in a mass spectrum that is the two-dimensional representation of signal intensity (ordinate) versus m/z (abscissa).
Additional signals might correspond to, for example, fragment ions or adducts (Kuhl et al. Reference Kuhl, Tautenhahn, Böttcher, Larson and Neumann2011). While the detection of the protonated or deprotonated molecule (the so-called pseudomolecular ions) represents the primary aim of mass spectrometric analyses to determine the molecular mass of the whole structure, these supplementary ions provide valuable hints regarding the substructures present in the molecule or the occurrence of specific moieties (Demarque et al. Reference Demarque, Crotti, Vessecchi, Lopes and Lopes2016).
Mass spectrometric approaches represent prevalent strategies in holistic metabolite profiling owing to their high sensitivity and widespread availability. Nevertheless, one should keep in mind that the sensitivity of these techniques is highly dependent upon analyte-specific features and is not universally high (Theodoridis et al. Reference Theodoridis, Gika, Want and Wilson2012).
Since mass spectrometry stands among the most versatile analytical approaches for structural elucidation, the coupling of planar chromatography with mass spectrometry has been a field of intensive research over recent decades (Sherma Reference Sherma2010), resulting in a commercially available TLC-MS interface in mid-2009. While these hyphenated approaches have garnered considerable interest in the wider field of natural products chemistry, no application to lichen material has previously been described as far as could be ascertained.
Accordingly, the present study evaluates the adequacy of negative ion electrospray ionization mass spectroscopy (NI-ESI-MS) for the straightforward identification of lichen metabolites directly from TLC plates. For this purpose, a wide range of lichen substances was analyzed as single molecules to assess both the versatility and sensitivity of the technique. This TLC hyphenated approach was then applied to the crude acetone extracts of a set of lichens of known chemical composition to validate the method in standard TLC conditions. A specific emphasis is given to cases where traditional methods of detection do not provide a reliable identification of lichen metabolites. Finally, the ability of the TLC-NI-ESI-MS to identify unknown molecules is shown using the subantarctic lichen Usnea trachycarpa as a case study
Material and Methods
Lichen material and compounds
Single compounds used in this study were obtained from the library of pure lichen compounds in our laboratory; these had been previously isolated and identified during extensive spectroscopic studies of lichen secondary products. Collection sites and herbarium codes for all species considered in this paper are given in Table 1.
Table 1 Lichen species studied together with the dates and locations of collection. Solvent system used for migration of the plate given as a superscript: a=toluene/ethyl acetate/formic acid (70/25/5, v/v/v); b=toluene/acetic acid (17/3, v/v) (standard solvent C); c=chloroform/acetone (3/1, v/v)

Chromatographic procedures
Samples were loaded onto 10×20 cm silica gel pre-coated 60F254 plates (Merck) using an Automatic TLC Sampler III (Camag Muttenz, Switzerland). For pure compounds, the analyses were first attempted by loading 10 μl of a sonicated dichloromethane solution at 0·1 mg ml−1. If the molecule was accurately detected at this concentration, new analyses were performed reducing the concentration of the solution (down to 0·01 mg ml−1) and/or the loaded volume (down to 5 μl). In the case of unsatisfactory detection, these initial parameters were increased with maxima of 0·5 mg ml−1 and 20 μl. Thus, the loaded quantities ranged between 0·05 and 10 µg. Crude acetone extracts were prepared at a concentration of 0·5 mg ml−1 in dichloromethane while single molecules were prepared at different concentrations to determine the limit of detection (LOD). For single molecules, all tested concentrations were applied to the same TLC plate so that the location of spots of lower concentration could be extrapolated from that of higher concentrations which are suitably visualized under UV light. In both cases, 10 µl aliquots of the samples were applied as 5 mm bands, 10 mm from the lower edge, unless otherwise specified. Thereafter, each plate was transferred to a pre-saturated development chamber (i.e. saturated with the chromatographic solvent for 30 min at room temperature) containing solvent systems described in Table 1. The plates were developed with an appropriate solvent mixture to a migration distance of 70 mm. Plates were then dried and monitored under white and ultraviolet light (254 and 365 nm) and the spots to be desorbed were circled with a pencil. Pure compounds (Table 2) were dissolved in acetone and run on TLC plates using toluene/acetic acid (17/3, v/v) as a mobile phase (usually referred to as standard solvent C). Acetone extracts of lichen thalli were obtained using 1·0 g of the ground lichen in 3 ml of analytical grade solvent for 2 h at room temperature. Mobile phases affording a satisfactory separation of the main compounds in lichen extracts were then selected (Table 1). The LOD was determined as the lowest deposited quantity affording a signal-to-noise ratio > 3.
Table 2 Mass spectrometric signals and limits of detection for the lichen metabolites encompassing the main structural series. Rf values were determined using toluene/acetic acid (17/3, v/v) as mobile phase. λmax values for these reference substances can be found in Huneck & Yoshimura (Reference Huneck and Yoshimura1996)

a.m.u.=arbitrary mass unit
TLC-NI-ESI-MS analysis
The TLC-MS interface (Camag TLC-MS Interface, Muttenz, Switzerland) was fitted with a flow pump with the inlet connected to an HPLC pump (TSP Spectra System P1000XR, Thermo Scientific, Waltham, Massachussets, USA) and the outlet attached to an expression CMS single quadrupole (Advion, Ithaca, USA) equipped with an electrospray ionization (ESI) probe. The oval-shaped extraction head (4×2 mm) was used for the extraction of the compounds from the TLC plate. The mass spectra were obtained in situ using a 9/1 (v/v) mixture of methanol/water+0·1% formic acid as the extracting solvent with a flow rate of 0·2 ml min−1 for a duration of 1 min per spot of interest. Full scan mass spectra were recorded in the negative-ion (NI) mode in a mass range of 100 to 1200 Da applying the following parameters: detector gain 1200, ESI voltage −3·5 kV, capillary voltage 180 V, source voltage 20 V, source voltage dynamic 20 V, nebulizer gas pressure 60 psig, desolvation flow gas rate 4 l min−1, capillary temperature 250 °C and gas temperature 20 °C. Data processing and evaluation for MS measurement were performed with the Data and Mass Express 2.2.29.2 software (Advion). A didactic overview of the analytical process of TLC-ESI-MS is provided in the Supplementary Material (see Figures S1 & S2, available online).
Results
Analysis of single lichen metabolites
Single lichen metabolites from various structural series were first analyzed by TLC-MS. Both their spectral signatures and limits of detection are given in Table 2. Their molecular structures are displayed in Figure S3 (see Supplementary Material, available online).
Most molecules could be detected in the low microgram range but two tested molecules displayed higher limits of detection: variolaric acid and secalonic acid D. As an illustration, four of the mass spectra obtained after TLC migration of a two-fold LOD concentration of each compound are depicted in Fig. 1.
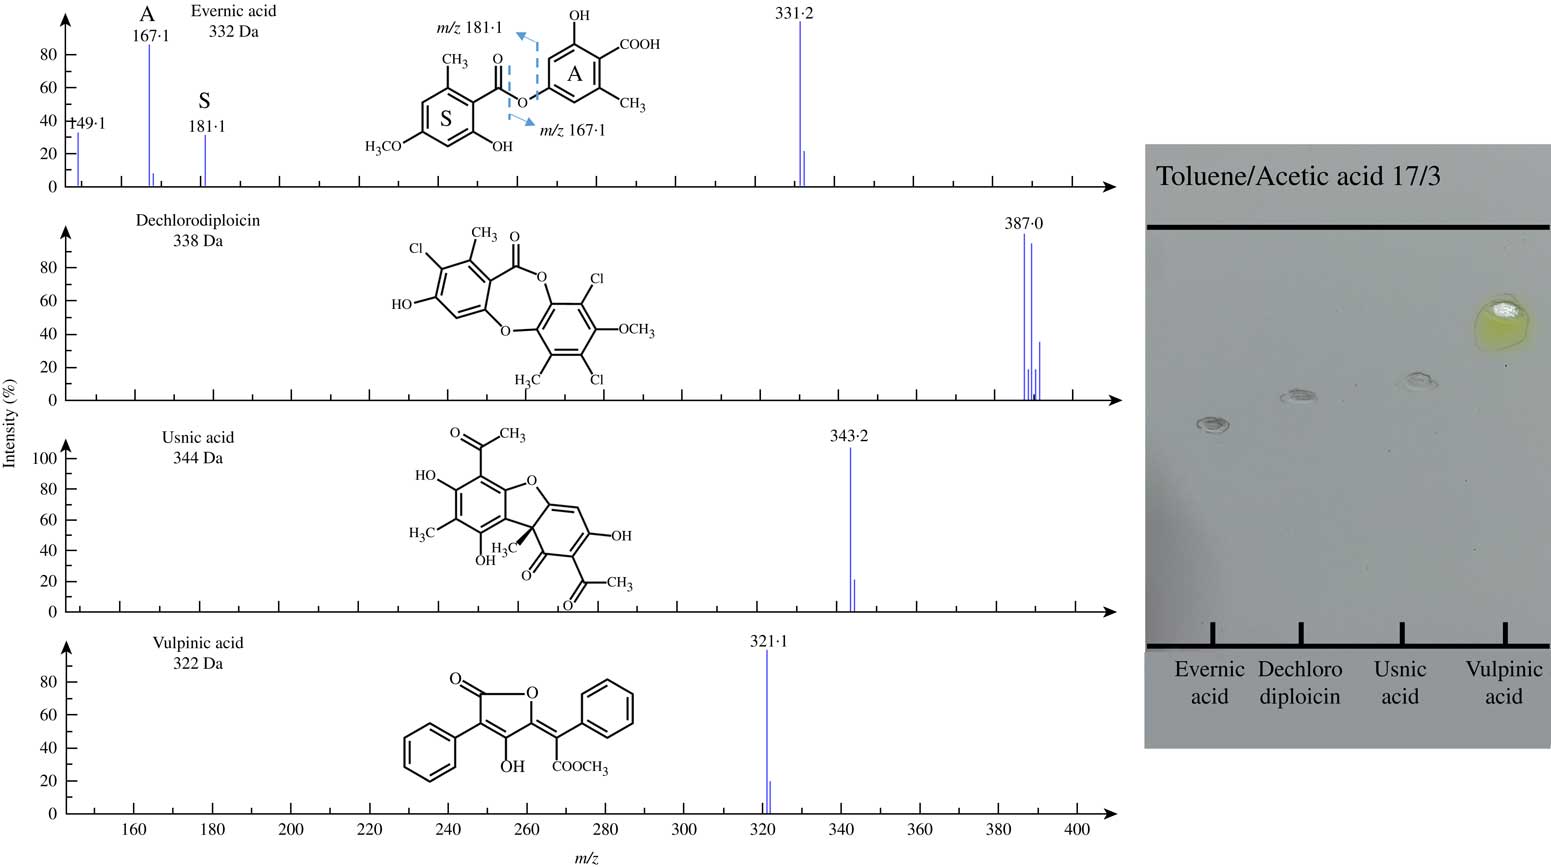
Fig. 1 NI-ESI mass spectra recorded directly from TLC plates for some single lichen metabolites (at twice the limit of detection given in Table 1). All molecules displayed here exhibit deprotonated molecules M-1 signals as base peaks. The fragmentation of evernic acid reveals its monoaromatic building blocks; dashed lines refer to the bonds that are cleaved during mass spectrometric analyses. The complex signal pattern of dechlorodiploicin is related to the isotopic abundance of chlorine atoms in this depsidone. The image on the right illustrates the imprints left after using the oval elution head.
TLC-NI-ESI-MS chemical profiling of lichens of known chemical composition
TLC-MS afforded a quick and straightforward identification of lichen metabolites produced by an array of different lichens (Table 3), with most compounds being detected as deprotonated molecules. To further evaluate the extent of the advantages offered by TLC-MS hyphenation, MS detection was attempted on metabolites that are problematic to discriminate using TLC. An example is aliphatic chain-bearing depsides such as divaricatic acid (Ophioparma ventosa) and perlatolic acid (Cladonia portentosa). To assess whether TLC-MS is able to address these routine questions, TLC loading was performed manually, following the guidelines published by Elix (Reference Elix2014). Although Rf values of these very common depsides are supposed to increase with the total length of their side chains, their TLC behaviour remains virtually identical in reference solvent systems, precluding their unambiguous assignment (Culberson & Culberson Reference Culberson and Culberson1966; Culberson Reference Culberson1972). Hence, reliable TLC identification of these molecules should rely on separating their hydrolysis products which are readily distinguishable (Culberson & Culberson Reference Culberson and Culberson1966; Culberson Reference Culberson1972). However, using MS as an ancillary technique bypasses the need for chemical derivatization and provides a straightforward and unambiguous identification of these depsides, as illustrated in Fig. 2.
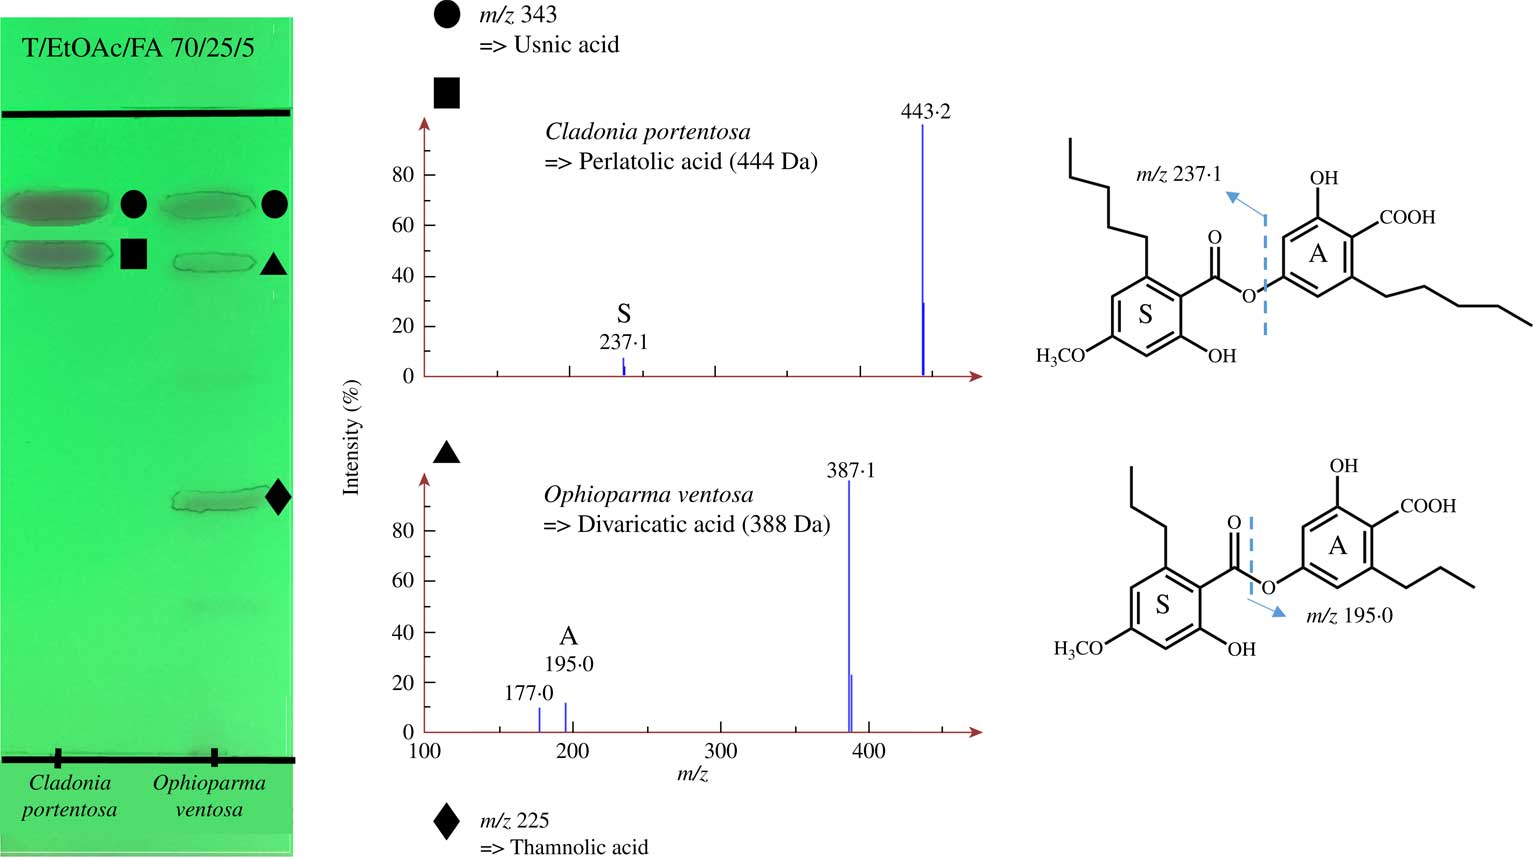
Fig. 2 NI-ESI mass spectra of the acetone extracted aliphatic depsides with their chemical structures from Cladonia portentosa and Ophioparma ventosa together with the developed TLC plate (under UV 254 nm). Mass spectra correspond to plots of m/z values (x axis) against their relative abundance (y axis). Dashed lines refer to the bonds that are cleaved during mass spectrometric analyses.
Table 3 Chemical profiling of lichen species using TLC-NI-ESI-MS

* Solvent systems used as mobile phases given in Table 1.
** Secondary metabolites identified by NI-LDI-MS and HPLC-DAD-MS (Le Pogam et al. 2015 Reference Le Pogam, Schinkovitz, Legouin, Le Lamer, Boustie and Richommeb )
*** Secondary metabolites identified by HPLC-DAD-MS.
While TLC-MS afforded complete chemical profiles for most lichens in this study, profiling of Xanthoria parietina revealed only emodin and failed to detect other anthraquinones, including parietin, a major compound in this lichen (Table 3). Conversely, the chlorinated xanthones of Lecidella asema could be detected satisfactorily. The mass spectra obtained from these lichens, as well as the chemical formulae of the detected and undetected compounds supporting further discussion (see below), are shown in Fig. 3.
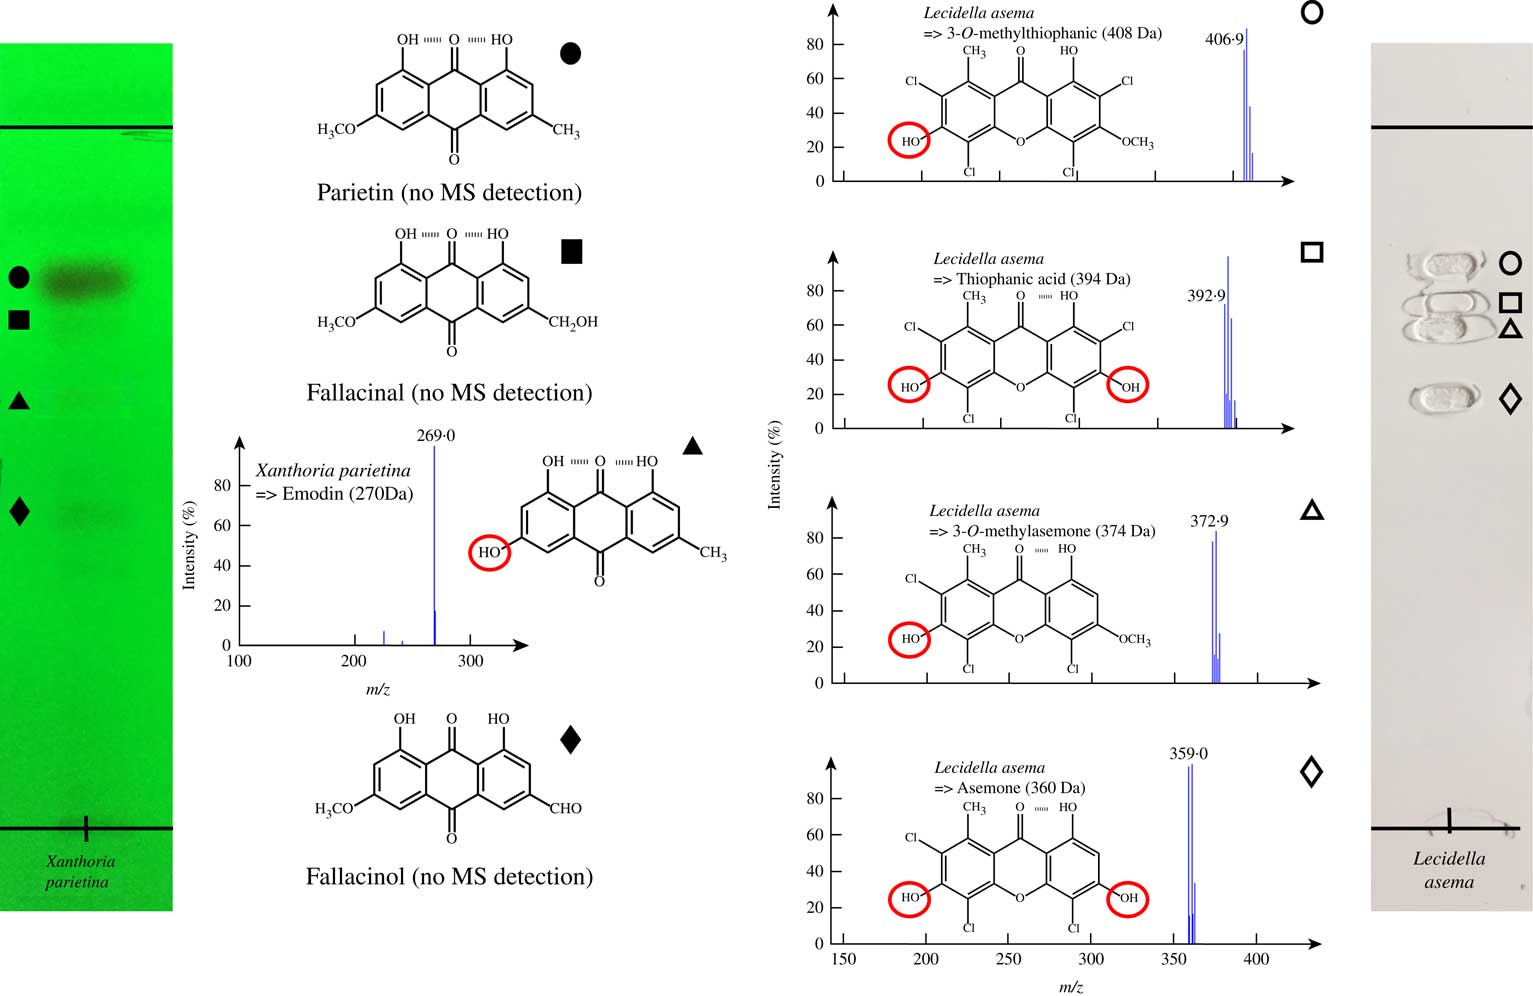
Fig. 3 TLC plates of acetone extracts of Xanthoria parietina (under UV 254 nm) and Lecidella asema (under white light) together with NI-ESI mass spectra of the detected compounds. Their chemical structures are represented with specific emphasis on the chemical features of interest (hydrogen bonds and red circled free phenol groups) by comparison with that of secalonic acid D. The Lecidella asema plate reveals the imprints left after desorption by the oval elution head.
TLC-NI-ESI-MS chemical profiling of Usnea trachycarpa
The chemical profile of Usnea trachycarpa has not previously been studied by HPLC-DAD-MS, making it an example of particular significance in assessing the dereplication value of the TLC-NI-ESI-MS approach. This lichen produces various secondary metabolites including usnic acid, depsidones (norstictic and salazinic acids) and six closely related paraconic acid derivatives (Walker Reference Walker1985; Elix et al. Reference Elix, Wirtz and Lumbsch2007). Hence, three couples of paraconic acid-derived isomers differing in the position of the double bond (both exocyclic and endocyclic) were described for this species: muronic and isomuronic acids (366 Da), murolic and neuropogolic acids (368 Da) and 13-acetoxyprotolichesterinic and 13-acetoxylichesterinic acids (382 Da), respectively (Bodo & Molho Reference Bodo and Molho1980; Ghogomu & Bodo Reference Ghogomu and Bodo1982). All these substances could be detected in a straightforward manner even though couples of paraconic acids could not be discriminated by TLC owing to their very close physico-chemical features (Fig. 4, Table 4). Indeed, such derivatives of lichesterinic and protolichesterinic acid are known to be very difficult to separate using classical chromatographic techniques, requiring the development of refined strategies to purify them (Horhant et al. Reference Horhant, Le Lamer, Boustie, Uriac and Gouault2007). These analyses also revealed the occurrence of an unknown metabolite with a molar mass of 340 Da. Subsequent DART-HRMS analyses undertaken on pieces of U. trachycarpa established the formula C19H31O5 for this unidentified molecule (see Supplementary Material Figure S3 & Table S1, available online).
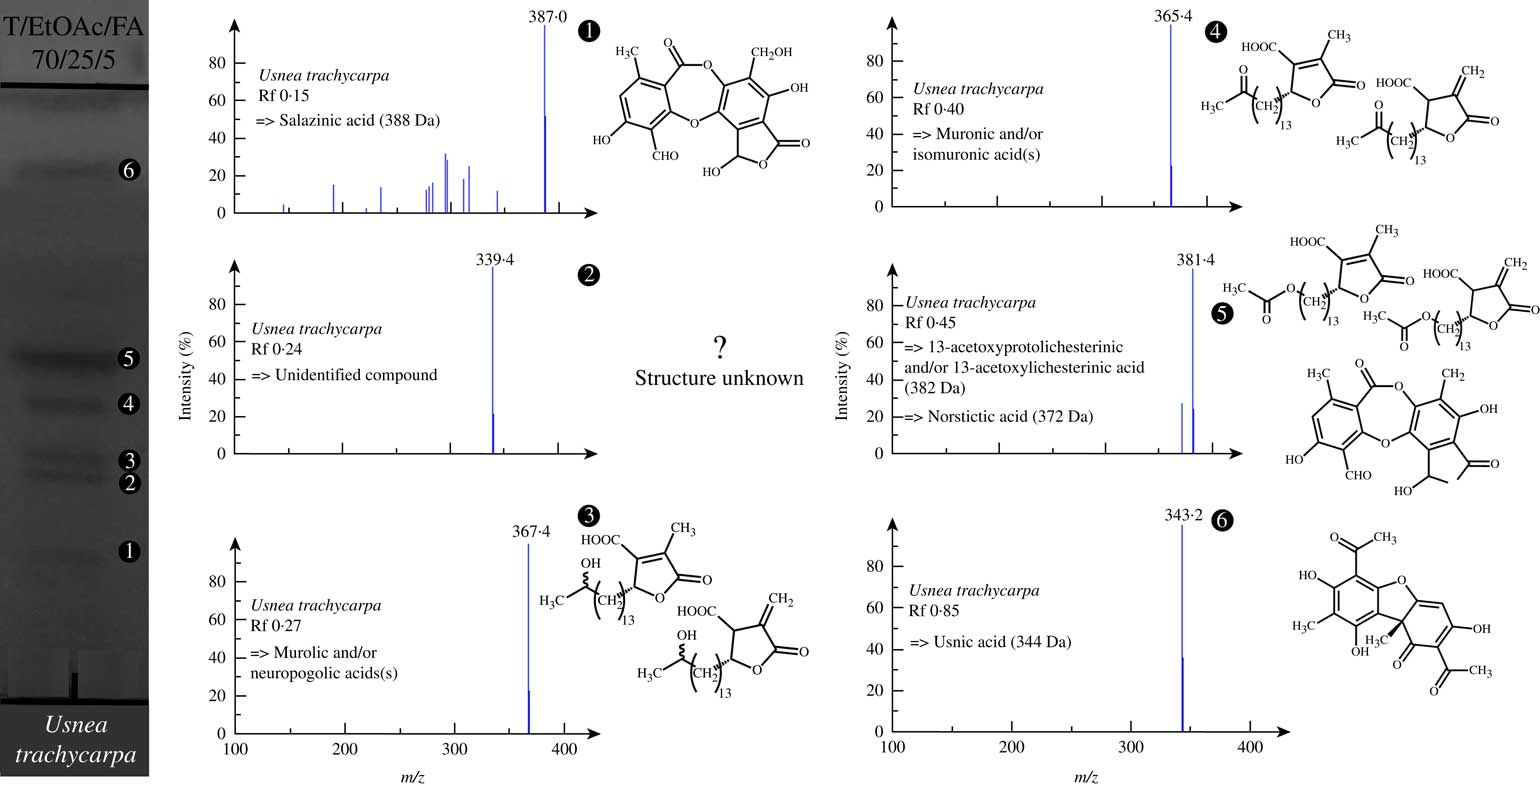
Fig. 4 Developed TLC plate of the acetone extract of Usnea trachycarpa (under UV 254 nm) with NI-ESI mass spectra of the detected compounds.
Table 4 Chemical profiling of Usnea trachycarpa using TLC-NI-ESI-MS. Rf values determined using toluene/ethyl acetate/formic acid (70/25/5, v/v/v)

Discussion
The overall findings of this study highlight the versatility of mass spectrometric detection to afford expeditious identification of various lichen structures from all the main structural series directly from TLC plates, and within a minute. An interesting outcome is that the mass spectra obtained from lichen compounds most often display prevalent deprotonated molecules (i.e. molecules having simply lost a proton), leading to an easy and straightforward interpretation of the spectra. Of the compounds tested, which were chosen to cover a major part of lichen chemodiversity, only depsides were significantly fragmented. Such fragmentation might be considered added value in the identification process of depsides as it provides further clues regarding the monoaromatic subunits of the depside structure, especially when the deprotonated molecule is still present in the mass spectrum (e.g. erythrin, divaricatic acid, evernic acid, perlatolic acid, chloroatranorin) (Demarque et al. Reference Demarque, Crotti, Vessecchi, Lopes and Lopes2016). The observed fragments are released through the cleavage of the ester bond to allow the detection of either the carboxylic acid (S ring) and/or alcohol part (A ring) of the depside (Fig. 2). These fragmentations are consistent with those described from various mass spectrometric techniques (Huneck et al. Reference Huneck, Djerassi, Becher, Barber, Von Ardenne, Steinfelder and Tümmler1968; Holzmann & Leuckert Reference Holzmann and Leuckert1990; Le Pogam et al. 2015 Reference Le Pogam, Schinkovitz, Legouin, Le Lamer, Boustie and Richommeb , Reference Le Pogam, Le Lamer, Legouin, Boustie and Rondeau2016). To the best of the authors’ knowledge, no structural features have been proposed to account for the mass spectrometric behaviour of depsides (i.e. why either or both of the S and A fragments are detected for a specific depside). A mass spectrometric study is ongoing to better understand these fragmentation processes. In a rather limited number of cases (i.e. atranorin and thamnolic acid), the lack of the deprotonated species complicates the assignment of the metabolite. Nonetheless, the occurrence of characteristic fragment ions still represents a valuable contribution to the identification process in conjunction with mutually supportive data (Rf, microchemical tests, UV visualization etc).
Most elements appear as several isotopes meaning that such atoms can harbour nuclei displaying the same number of protons (defining their position in the periodic table of elements) but different masses owing to a different number of neutrons. Of atoms regularly encountered within lichen metabolites, one such example is that of chlorine which occurs in two isotopic forms in significant abundance, 35Cl and 37Cl, in a 3:1 ratio. Such di-isotopic distribution gives rise to recognizable signal patterns that enables both the presence and number of such atoms within molecules to be determined. One such example is that of 3-dechlorodiploicin which displays an isotopic pattern typical of a trichlorinated compound (Fig 1).
With regard to the sensitivity of the technique, most molecules could be detected in the low microgram range. It was observed, however, that two pure molecules displayed higher LODs which emphasizes two limitations of the technique. Firstly, variolaric acid displays a slightly higher LOD of 2·0 μg, which is 20 times higher than that of the other depsidone studied, 3-dechlorodiploicin, indicating that the difficulty in detecting the former is not related to its depsidone scaffold. This difference is also not connected to the ionization efficiency of these two depsidones because the same detection threshold is obtained when injecting them directly into the mass spectrometer. Therefore, it can be assumed that variolaric acid, as a very polar compound, is hardly extracted from the silica gel, accounting for the higher detection threshold when compared to that of the apolar 3-dechlorodiploicin. Further support for this assumption is provided by a strong negative relationship between the detection thresholds and Rf values of all single molecules tested (Fig. 5) even though the sensitivity of mass spectroscopic techniques is known to vary considerably, based on structural features of the molecules analyzed. The difficulty in elution of low Rf compounds from the plate might account for the poor TLC-MS detection of such metabolites. Secondly, secalonic acid D detection by TLC/MS is much less sensitive than that of the other compounds tested. Secalonic acid D was the sole lichen xanthone reference compound tested. Nevertheless, the extensive chemical profiling of the xanthone-producing Lecidella asema demonstrates that TLC-MS can afford sensitive detection of xanthones (Le Pogam & Boustie Reference Le Pogam and Boustie2016). A comparable situation was recorded for secondary products in Xanthoria parietina where parietin (an anthraquinone accounting for 95% of its acetonic extract (Piattelli & de Nicola Reference Piattelli and de Nicola1968)), fallacinol and fallacinal could not be detected whereas the minor compound emodin (1·5%) was satisfactorily detected (Fig. 3). These limitations do not refer to a specific drawback of TLC-MS hyphenation but relate to the electrospray negative ionization process that mainly facilitates the formation of deprotonated molecules (Mann Reference Mann1990). The phenolic groups of these molecules are close to hydrogen bond acceptor moieties, bringing about intramolecular hydrogen bonds that prevent the formation of the deprotonated molecules. On the other hand, metabolites displaying a free phenolic group could be easily deprotonated and satisfactorily detected (emodin and all chlorinated xanthones of Lecidella asema) (Le Pogam et al. 2015 Reference Le Pogam, Schinkovitz, Legouin, Le Lamer, Boustie and Richommeb ). One possible way to overcome this limitation would be to hyphenate TLC with ion sources that enable the formation of radical ions, bypassing the need to deprotonate the molecule. A good candidate for such purposes is the laser desorption ionization (LDI) source which was recently shown to provide a complete chemical profile of the lichen Xanthoria parietina from its acetone extract (Le Pogam et al. 2015 Reference Le Pogam, Schinkovitz, Legouin, Le Lamer, Boustie and Richommeb ). Several publications have reported successful TLC/LDI-MS hyphenation for the detection of different structural groups (Shariatgorji et al. Reference Shariatgorji, Spacil, Maddalo, Cardenas and Ilag2009). We are currently attempting to use this analytical strategy for the identification of lichen metabolites from TLC plates. In all these cases, it appears that the lower sensitivity observed for these molecules depends on their individual physico-chemical properties rather than on their structural class. These limitations should be kept in mind when accounting for the poor detection of some lichen compounds. Additional studies attempting other elution conditions (i.e. modifying the elution solvent flow rate, introducing ammonium formate instead of formic acid, etc) might represent valuable options for compounds which cannot be detected.
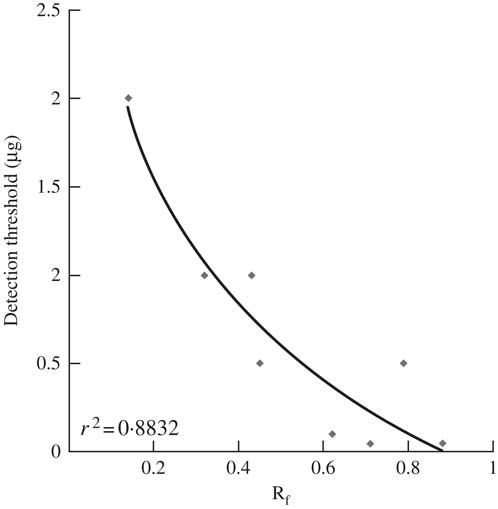
Fig. 5 Logarithmic trendline between Rf (in toluene/acetic acid, 17/3, v/v) and detection thresholds using TLC-NI-ESI-MS. Secalonic acid D, whose detection threshold mainly depends on specific structural features, was excluded from this plot. The plotted molecules are those collated in Table 2. r² value was obtained from the curved regression line.
We demonstrate that TLC-MS is able to expeditiously discriminate between closely related metabolites such as aliphatic depsides that remain a vexing problem when using traditional TLC. In this paper, the very closely related perlatolic acid and divaricatic acid are unambiguously differentiated.A further outcome is that the mass spectra presented in Figs 2 and 3 were obtained from manually loaded plates. Hence, TLC-MS is versatile regarding the quantity of extract deposited on the plate and routine manually-prepared TLC plates are perfectly suitable for mass spectrometric detection, bypassing the need for expensive automated sample application. It can therefore be imagined that equivocal TLC plates prepared by lichenologists could be forwarded to analytical chemistry platforms for subsequent mass spectrometric analyses.
While TLC-NI-ESI-MS appears to be a valuable approach for the identification of lichen compounds for chemotaxonomic purposes, this technique might also be of interest for the verification of putative novel lichen compounds and possibly streamline their isolation, as shown here through the example of Usnea trachycarpa. The mass difference between the murolic/neuropologic acids and the unknown compound could correspond to two CH2 units. This might indicate a shorter side chain compared to murolic/neuropogolic acids, which would be in agreement with its higher polarity. This finding paves the way for further phytochemical investigation of Usnea trachycarpa to confirm this assumption by clarifying the structure of this metabolite. The TLC-MS interface also enables the collection of the eluted compounds for any further offline analyses, including NMR spectroscopy (Adhami et al. Reference Adhami, Scherer, Kaehlig, Hettich, Schlotterbeck, Reich and Krenn2013).
It is worth noting that all mass spectrometric data presented in this study were acquired in low resolution, including all associated limitations. However, the use of high resolution mass spectrometry that enables the determination of elemental compositions through exact mass measurements can lead to the differentiation of isobaric species (i.e. ions having the same nominal mass but different exact masses owing to different elemental composition), further narrowing down identification possibilities. Ultimately, isomer distinction still represents one major mass spectrometry bottleneck. Generally speaking, isomers cannot be distinguished in a single MS dimension but this can be achieved using complementary analytical tools in conjunction with MS detection (Rathahao-Paris et al. Reference Rathahao-Paris, Alves, Junot and Tabet2016). The discrimination of isomers can be achieved through chromatographic separation such as the TLC separation of various chloroxanthones (Leuckert & Knoph Reference Leuckert and Knoph1992). Using tandem MS or ion trap (MSn) might also reinforce isomer distinction by comparison of fragmentation patterns. The targeted compound can be ionized and selected in the first mass spectrometer among all other ionized species. Subsequently, the selected primary ion can be dissociated by collision, with the final mass analyzer discriminating the secondary ions characteristic of the targeted compound (McLafferty Reference McLafferty1981). Likewise, ion mobility provides an additional orthogonal metabolite feature that can represent an alternative approach for isomer discrimination, separating ions based on their mass, charge and cross-section (which is linked to ion size and shape) (Kanu et al. Reference Kanu, Dwivedi, Tam, Matz and Hill2008).
This study was supported by the University of Rennes 1 through the project “Défi Emergent LICHENMASS”. The authors are grateful to Pr. David Rondeau for DART-HRMS analyses that used the mass spectrometry facilities of the DReAM platform of IETR. Dr Joël Esnault is gratefully acknowledged for providing the sample of Pannaria rubiginosa.
Supplementary Material
For supplementary material accompanying this paper visit https://doi.org/10.1017/S0024282917000433


