


1. Introduction
The generation of high energy density plasmas using soft X-ray lasers that are not absorbed either due to skin depth effects in solids or critical density effects in plasmas is of global interest as it allows the investigation of well defined volumetrically heated states created by photo-absorption.
Warm dense matter (WDM) is a complex regime between cold solids and hot dilute plasmas, which is of great interest in high energy density physics (Davidson, Reference Davidson2003), planetary physics and astrophysics (Saumon et al., Reference Saumon2000; Nettelmann et al., Reference Nettelmann2008). It occurs, for instance, in the interior of the large gaseous planets, within stars in late stages of evolution, and also, transiently, in inertial confinement fusion implosion, and in laser-solid matter interactions (Lindl et al., Reference Lindl2004).
Theoretically, such matter is difficult to handle, with electrostatic and thermal energies at the same order of magnitude, rather than one being a perturbation of the other, as in solid state physics or classical plasma physics (Ziaja et al., Reference Ziaja and Weckert2007). Experimentally, the difficulty in producing WDM with a sufficient volume and lifetime for experimental studies is a challenge (Cao et al., Reference Cao and Uschmann2007). Further, sophisticated methods such as X-ray scattering have undergone both theoretical and experimental developments (Lee et al., Reference Lee2002; Riley et al., Reference Riley and Khattak2007; Fortmann et al., Reference Fortmann and Bornath2009; Glenzer & Redmer, Reference Glenzer and Redmer2009) in the last decade to probe such dense plasmas.
1.1. Warm Dense Matter
In WDM, the density is high and temperature is relatively low so that the ions are strongly coupled and/or electron states are degenerate. The conditions for strongly coupling may be specified in terms of the ratio of potential energy between the ions, V ii, to their kinetic thermal energy, kT, expressed by the parameter Γ = (Ze)2/r 0kT, where Ze is the ion charge, T is the temperature, and ![]() is the average of a typical distance between the particles, where n e is the electron density. WDM is characterized by Γ ≥ 1; Γ ~ 1 would correspond to modestly coupled and Γ > 1 to strongly coupled regime.
is the average of a typical distance between the particles, where n e is the electron density. WDM is characterized by Γ ≥ 1; Γ ~ 1 would correspond to modestly coupled and Γ > 1 to strongly coupled regime.
In this work, we produced aluminum (Al) plasma (Lomonosov, Reference Lomonosov2007) with near-solid density in the warm dense matter regime. For Z > 1 and temperatures T ≤ 10 eV, we find for solid Al that Γ is between 1 and 10, i.e., well into the WDM regime, as shown in Figure 1.

Fig. 1. (Color online) Phase diagram of Al. Figure from Lee et al. (Reference Lee2003).
Over a period of more than four years, the authors have conducted a series of experimental, theoretical, and computational investigations (Zastrau et al., Reference Zastrau and Fortmann2008; Vinko et al., Reference Vinko and Gregori2009, Reference Vinko and Zastrau2010; Nagler et al., Reference Nagler and Zastrau2009; Cihelka et al., Reference Cihelka and Juha2009; Toleikis et al., Reference Toleikis and Fäustlin2010; Dzelzainis et al., Reference Dzelzainis and Chalupsky2010; Galtier et al., Reference Galtier and Rosmej2011; Medvedev et al., Reference Medvedev and Zastrau2011) at the extreme ultraviolet (XUV) free-electron laser in Hamburg (FLASH (Tiedtke et al., Reference Tiedtke and Azima2009)) aiming at the generation and characterization of photo-induced Al plasma. Our knowledge about optical parameters and the primary response of the sample under irradiation with FLASH was significantly increased.
1.2. Femtosecond Laser Absorption Mechanisms
The most obvious difference from common optical and infrared laser-matter interactions is that for 13.5 nm radiation, the critical density, n c, is above the density of charge carriers in solids. For optical lasers, n c is in the of order 1021 to 1022 cm3, and hence penetration is limited to dilute plasmas. At solid density, absorption of visible and infrared light is dominated by non-linear effects due to the high electric and magnetic field strengths within the skin depth only. In contrast, in the XUV regime, the usual absorption processes in play with infrared and visible lasers are not relevant in XUV and X-ray experiments, but direct photoionization in the bulk volume plays the major role. Further, with XUV intensities of even 1012 < I L < 1019 W/cm2 any parametric processes, which scale as I Lλ2 (Wilks et al., Reference Wilks and Kruer1992), are still unimportant. It can therefore be expected that radiation-matter single-photon processes will dominate the absorption. If the XUV photon energy exceeds the L-shell binding energy, deeply bound core electrons are dominantly photo-ionized.
To demonstrate the paramount difference in plasma generation using soft X-rays compared to optical laser pulses, Figure 2 shows two emission spectra of a bulk Al sample, one for FEL and one for infrared laser irradiation. Following soft X-ray excitation, the plasma emission is dominated by scattering of the free-electron-laser (FEL) and radiation at 13.5 nm, by fluorescence radiation and few ionic lines. In contrast, the optically excited aluminum plasma is dominated by plasma lines of higher ionization stages, indicating a hot surface plasma.

Fig. 2. (Color online) The upper curve shows an unfiltered soft X-ray spectrum obtained from bulk Al following impact of 92 eV FEL radiation and the lower curve the spectrum for 1.6 eV infrared laser radiation using a 200 nm Zr filter. The intensities were 4 × 10¹⁴ W/cm2 and 4 × 10¹⁵ W/cm2, respectively. Figure from Toleikis et al. (Reference Toleikis and Fäustlin2010).
2. EXPERIMENTAL SETUPS
The XUV free-electron laser FLASH, located at DESY Hamburg, Germany, was used as a radiation source to generate plasmas on the surface of solid-density Al samples.
2.1. The Free-Electron Laser FLASH
The FLASH facility was operating in the self-amplified spontaneous emission mode. In FLASH, very low emittance electron bunches are generated in a photo-injector and are immediately accelerated to avoid space charge effects. After two compression steps using magnetic chicanes, the electrons are accelerated to their final energy of 300 to 1000 MeV, producing soft X-ray FEL radiation, in a fixed gap 30 m long permanent magnet undulator, in the range 30 to 200 eV (Tiedtke et al., Reference Tiedtke and Azima2009). In the considered experiments, we used 92 eV photon energy (13.5 nm), which corresponds to an electron energy of 700 MeV. In the employed operation mode of FLASH, the electron bunch, which has a higher density on its leading edge, generates X-ray pulse durations of 15 to 50 fs with a bandwidth near 1.0%. These X-ray pulses are transported to the experiments.
The laser was operated at a repetition rate of 5 Hz, and the pulse energy was varied from 6 to 30 µJ and measured by a photo-ionization gas monitor-detector. Because of the unseeded nature of self-amplified spantaneous emission FEL generation (Ackermann et al., Reference Ackermann2007), the pulse energy fluctuated during the data acquisition by several μJ around the mean value. We extracted the FLASH beam from two beamlines, either from BL2 or BL3 (Tiedtke et al., Reference Tiedtke and Azima2009).
During our experiments, these two beamlines offered different experimental conditions for the users at FLASH. While BL2 provided a permanently installed focusing mirror, BL3 offered an unfocused beam, and the users are able to install their own focusing device and thus generate different focal conditions. Meanwhile, both beamlines offer a focused and an unfocused option to the user.
At BL2, the FLASH beam was focused by an amorphous carbon coated grazing incidence elliptical mirror (with a focal length of 2 m) to a focal spot of 20 µm in diameter (Chalupský et al., Reference Chalupský and Juha2007). The total BL2 beamline transmission is considered to be 64 ± 4% (Tiedtke et al., Reference Tiedtke and Azima2009). The typical irradiance was estimated to range between 1012 W/cm2 and 1014 W/cm2 for a 25 µm spot.
In the experimental chamber at BL3, an off-axis parabolic mirror coated with a Si/Mo multilayer for 13.5 nm was incorporated, allowing us to tightly focus the beam on a sub-micron spot (Bajt et al., Reference Bajt and Chapman2009). The parabola has a focal length of 269 mm, and the smallest focal spot was usually 1 µm in diameter. The typical irradiance was about 1013 W/cm2 and 1016 W/cm2 for 20 µm and 1 µm spots, respectively. Meanwhile, we achieved a focus of ≈ 700 nm in March 2011, which allows us to comfortably exceed 1017 W/cm2 on target at λ = 13.5 nm.
In all setups, the pressure of residual gases was reduced by turbo-molecular pumps down to 10−6 mbar in the interaction chamber.
2.2. XUV Emission Spectroscopy (XES)
In experiments at BL2, the compact and light weight soft X-ray spectrograph, high transmission and resolution spectrograph for XUV light (HiTRaX) (Fäustlin et al., Reference Fäustlin and Zastrau2010) was employed. It covers a wavelength range of 5–35 nm and employs a toroidal mirror and a variable line space reflection grating. The spectrum is imaged onto a Princeton Instruments back illuminated charged-coupled device (CCD) camera, having pixel size of 13.5 × 13.5 µm2 on a 2048 × 512-pixel chip with air-cooled Peltier elements. In the HiTRaX design, particular emphasis has been placed on achieving a large collection solid angle (1.9 × 10⁻³ sr) and high efficiency of the components. The instrument achieves a resolution λ/Δλ = 330, which was measured at 21 nm, and the dispersion was calibrated at the BW3 beamline at the DORIS synchrotron (DESY Hamburg). The instrument is housed inside a DN100 CF ultra high vacuum manipulator, which allows precise positioning relative to the target. It is equipped with a motorized filter wheel with thin-foil filters (Al, Zr), and a shutter.
In experiments at BL3 (Dzelzainis et al., Reference Dzelzainis and Chalupsky2010), we employed a single-optics grating spectrometer. This setup is based on a Hitachi 1200 lines/mm variable line spacing grating (Nakano et al., Reference Nakano1984) and creates a flat spectral focus plane on an Andor DX420-BN CCD camera positioned on a vacuum flange with the chip in vacuum. A thin Al foil filter was used to establish the spectral resolution. We achieved a resolution of 0.1 nm, determined from the steepness of the Al L absorption edge (Dzelzainis et al., Reference Dzelzainis and Chalupsky2010). As target, an Al foil target 10 µm thick was moved across the FLASH focus continuously, to expose a fresh surface to each shot. The schematic of the experimental layout at BL3 is shown in Figure 3. Experimental spectra were obtained by integrating typically a few thousand single-pulse events.

Fig. 3. (Color online) Schematic of the experimental layout at BL3, using the Hitachi XUV spectrometer. (Dzelzainis et al. Reference Dzelzainis and Chalupsky2010).
Since 2009, the HiTRaX spectrometer was also used for experiments at the beamline BL3. The experimental schemes using the HiTRaX spectrometer at both beamlines are sketched in Figure 4. Further details about the XUV spectrometers at FLASH can be found in Zastrau et al. (Reference Zastrau and Hilbert2011).

Fig. 4. (Color online) Schematic view of the two experimental setups at BL2 and BL3 using the HiTRaX spectrometer. The combination of the two setups enables accessing an intensity range between 1013−1016 W/cm2. Figure from Vinko et al. (Reference Vinko and Zastrau2010).
2.3. Optical Emission Spectroscopy
Since the authors also observed optical emission (OE) from the excited plasmas, the experiments were equipped with additional instrumentation to better survey the plasma self-emission.
For the optical spectroscopy (Cihelka et al., Reference Cihelka and Juha2009), the authors employed an Oriel MS 257 grating spectrometer equipped with Andor iStar 720 iCCD head for the spectroscopy analysis of optical emission from FLASH-produced plasmas in the spectral range from 200 to 600 nm. The spectral resolution was primarily given by the grating used in a particular measurement. A grating with 150 lines/mm made it possible to obtain a survey spectrum (i.e., the width of the whole spectrum is about 400 nm) with a resolution of about 1 nm (100 µm slit). In 2007, a spectro-microscope was developed and used at BL2 (Cihelka et al., Reference Cihelka and Juha2009). During the experiments in 2007–2009 at BL3, a commercial objective (with a focal length of 35 mm purchased from Ocean Optics) focused the optical emission from the plasma plume to quartz fiber. The quartz fiber guided the OE signal by a feed-through from the evacuated chamber to the spectrometer equipped with a piezo-slit (piezosystem Jena, Germany). The irradiated sample was moved during the data acquisition because of craters created by laser ablation at the surface. Each FLASH pulse hits a new position on the surface. Final OE spectra were combined from typically 200 to 500 accumulations.
3. PLASMA EVOLUTION
FLASH emits bright XUV laser pulses of femtosecond duration. Such ultrashort pulses give an access to fundamental electronic processes in solids, since their pulse duration is comparable to characteristic times of collisional processes like electron-electron interaction, as well as collisions of electron with other bound or core electrons, which occur on a timescale of a few femtoseconds. These processes in the electronic subsystem are of essential interest for all materials behavior from the initial light absorption to further energy dissipation and eventual material modification, reaching from local damage spots to phase transitions as well as melting or transition to warm dense matter (Medvedev & Rethfeld, Reference Medvedev and Rethfeld2009). In order to study the dynamical reaction of material from the very first initiation, these fundamental processes can be temporally separated: due to the mass difference of electrons and ions, excitation, including creation of secondary generations of free electrons, is completed within some femtoseconds (or the time of pulse duration) (Kaiser et al., Reference Kaiser and Rethfeld2000; Rethfeld et al., Reference Rethfeld and Kaiser2002), while the energy exchange with the lattice lasts up to the picosecond time regime (Lorazo et al., Reference Lorazo and Lewis2006).
3.1. Femtosecond Time Scales
Considering an Al sample and a photon energy of 92 eV, the time evolution of the laser XUV-matter interaction is described as follows (see Fig. 5): First, the laser creates in the L shell (2p 6) holes by direct photo-ionization of the neutral Al. As the conduction band excitation cross section, σ, is small (σPI ~ E I5/2 with E IM ≪ E IL) for photons at 92 eV in Al (Vinko et al., Reference Vinko and Gregori2009), the dominant absorption channel is the excitation of one of the electrons in the 2p core states, which gives rise to the L edge at 73 eV (Henke et al., Reference Henke1993). An overview of the photo-absorption coefficient of Al for a wide range of photon energies is given in Figure 6.

Fig. 5. (Color online) Schematics of the processes after excitation at different timescales.

Fig. 6. (Color online) The photo-absorption coefficient of Al as a function of photon energy. Using FLASH, the accessible XUV photon range is indicated and covers typically the L absorption edge. The values are taken from Henke et al. (Reference Henke1993). Figure from Vinko (Reference Vinko2010).
This excitation reduces the screening of the remaining 2p electrons and shifts the L edge to 93.4 eV (Dufour et al., Reference Dufour and Mariot1976), an energy greater than the XUV photon energy, thus rendering the photo excited Al atom largely transparent to the rest of the pulse. This mechanism was recently used to demonstrate for the first time saturable absorption in the XUV, where the FLASH pulse was focused to intensities sufficiently high to excite every Al atom in the focal region of the target sample (Nagler et al., Reference Nagler and Zastrau2009).
The subsequent 2p core hole recombination is dominated by Auger decay, and has a lifetime of about 40 fs (Almbladh et al., Reference Almbladh and Morales1989). The photo-ionized electron is sent into the conduction band, leading to the K 2L 7M 4 state. Then, during the pulse duration, the Auger process occurs leaving each atom in the state K 2L 8M 2 + e auger−. Auger electrons are transferred to the continuum with an average kinetic energy of the L-shell absorption edge (73 eV), broadened by the amount of the Fermi energy E fermi = 11.2 eV. In the saturated absorption regime, almost all Al atoms will provide an Auger electron. Therefore, with progressing excitation, the number of electrons in the conduction band will be increased from three, in the cold solid, to a maximum of four at the highest intensities, when a single core electron is excited from every atom. Rapid partial redistribution (within femtoseconds) between the existing cold M electrons may lead to a complex, non-equilibrium energy distribution in the conduction band. At the same time, fluorescence or radiative decay from the conduction band electrons into the L-vacancies takes place.
As it takes several picoseconds for the electron energy to transfer to the lattice (Siwick et al., Reference Siwick2003), the ion cores themselves remain close to their original positions, defined by the face-centered-cubic lattice of the solid. At this stage in its evolution, the system is not in thermal equilibrium, as all of the absorbed XUV energy has been transferred to the electrons, while the ions are cold. However, the properties of this exotic state are of great interest, as the matter corresponds to a novel form of plasma.
To illustrate the hydrodynamic processes and to estimate the electron temperature, one-dimensional radiation hydrodynamics simulations using HELIOS (MacFarlane et al., Reference MacFarlane2006) have been performed (Zastrau et al., Reference Zastrau and Fortmann2008). HELIOS features a Lagrangian reference frame i.e., the grid moves with fluid, separate ion and electron temperatures, and flux-limited Spitzer thermal conductivity. It allows the deposition of laser energy via inverse bremsstrahlung as well as bound-bound and bound-free transitions, using a SESAME-like equation of state. Per atom, 2.6 conduction band electrons were assumed to contribute to the laser absorption (Zastrau et al., Reference Zastrau and Fortmann2008). The results are shown in Figure 7. On the femtosecond time scale of the FEL pulse, both electron density and temperature rise up to values of n e~1023 cm−3 and k BT e~26 eV, respectively, without any steep gradient.

Fig. 7. (Color online) HELIOS simulation results for the electron density (left) and electron temperature (right) as a function of time and radius. Figure from Zastrau et al. (Reference Zastrau and Fortmann2008).
Additionally, the simulation shows that these WDM conditions exist for about 200 fs, at almost constant plasma density and temperature, and hydrodynamic motion is negligible.
3.2. Picosecond Time Scales
The subsequent process to happen is electron-phonon coupling and, on a time scale of 1 ps (Lin et al., Reference Lin and Zhigilei2008), after the irradiation, the Al lattice will start to collapse. Now, a dense coupled plasma is created allowing ionization of M shell electrons.
At the highest excitation intensities of 1016 W/cm2, intense plasma line emission appears. These plasma lines are given by the emission from the lower-density plasma (≈ 1022 cm−3) formed upon expansion of the rapidly heated solid-density target. As electron-ion relaxation (and hence expansion) occurs on picosecond time scales (Siwick et al., Reference Siwick2003), we infer this emission occurs significantly later than conduction-band to core-hole emission at solid density.
3.3. Nanosecond Time Scales
The optical emission from plasma generated at highest irradiances of several 1016 W/cm2 shows mostly emission lines of neutral atoms, accompanied by few lines from weakly charged ions (Cihelka et al., Reference Cihelka and Juha2009). The observation of neutral atoms is only possible in a dilute plasma, since in the metallic state, the outer three M electrons form the conduction band, the initial state is Al3+. The plasma temperatures derived from the OE spectra are well below 1 eV, and we most likely observe the plasma plume expanding free into the vacuum with a few times the initial sound speed. In the case of Al, the initial sound speed is about 6.4 nm/ps, and after one nanosecond the plasma has expanded already up to 10 µm. During expansion, the recombination into free neutral atoms is the dominant source of the observed optical emission.
4. RESULTS
4.1. Overview of XUV Emission Spectroscopy
In Figure 8, all XES data obtained with the HiTRaX spectrometer are presented. On a logarithmic scale, we identify several independent features in these spectra. First, the scattering of the irradiating FLASH photons at 93 eV is very dominant at the lower fluences. It is less pronounced for the higher fluences at BL3, because here the spectrometer observed the plasma in the polarization plane of the FLASH pulses and hence scattering is highly suppressed. At BL2, the spectrometer observed the Al sample perpendicular to the FLASH polarization, leading to a strong contribution of direct scattered light.

Fig. 8. (Color online) Summary of Al XES obtained with the HiTRaX spectrometer (the lower three intensities at BL2, upper three at BL3) covering a wide range in irradiances.
Secondly, we observe the radiative decay between 60 eV up to the position of the L-edge at 73 eV, which is a dominant contribution at lower fluencies and will be analyzed in Section 4.3. Further, we observe a smooth continuum radiation, which is a function of irradiance both in absolute amplitude and slope. Note that the spectra are given in absolute photon numbers. Hence their offset on a logarithmic scale is due to the continuum radiation. This will be analyzed in Section 4.4. Finally, at higher fluences, ionic line emission starts to be present, indicating higher plasma temperatures. The composition of these lines is the subject of Section 4.5.
4.2. Saturable Absorption
Nagler et al. (Reference Nagler and Zastrau2009) observed the absorption coefficient of a 50 nm thin Al foil. It decreased drastically if the irradiation intensity at 13.5 nm wavelength exceeded an energy flux of 10 J/cm2, as reproduced in Figure 9. The setup of this transmission experiment is shown in Figure 3.

Fig. 9. (Color online) Transmission of Al target as a function of fluence. The circles are the experimental data points with a 1σ error bar; the solid line is a theoretical prediction (Nagler et al., Reference Nagler and Zastrau2009). The dashed curve is the predicted electron temperature in eV (right y axis) in the conduction band after the FEL pulse has passed, but before the L-shell holes are filled and the Auger recombination heats the band further (Nagler et al., Reference Nagler and Zastrau2009).
The decrease in the absorption of light with increasing intensity is a well-known effect in the visible and near-visible spectrum (Lewis et al., Reference Lewis and Lipkin1941), it is a widely exploited phenomenon in laser technology, e.g., as a cavity component in pulsed lasers. In the simplest two-level system, saturable absorption will occur when the population of the lower, absorbing level is severely depleted, which requires light intensities sufficiently high to overcome relaxation from the upper level.
During the very intense FLASH pulse, the thin Al sample absorbs the XUV photons predominantly through inner L-shell photo-ionization. As the pulse intensity is increased, the rate of photo ionization surpasses the recombination rate, so that the inner-shell absorbers are severely depleted, leading to a saturation of the absorption. This means, the solid Al becomes highly transmissive to the XUV light.
4.3. Radiative Decay
In Figure 10, a spectral window of the XES obtained with the HiTRaX at BL2 and BL3 (Fig. 8) is presented. The origin of this emission at low fluence is the radiative decay of conduction band electron into the L-shell vacancies (Nagler et al., Reference Nagler and Zastrau2009; Vinko et al., Reference Vinko and Zastrau2010).

Fig. 10. Conduction-band to 2p emission in solid-density Al for an increasing range of FEL irradiation intensities. The temperature can be deduced mainly from the slope of the Fermi function at 72 eV. QMD calculations (lines fitted to the four lowest intensities) are compared to the measured data for a final state with 0, 1, 3, and 10 core holes per 32-atom super-cell. Emission from atomic transitions in the Al plasma formed later in time as the target expands dominates the spectra at high intensities. Spectra are normalized to the same intensity at 72 eV and offset for clarity. Figure from (Vinko et al., Reference Vinko and Zastrau2010).
The emission spectrum is given by the local density of states of the final state in the recombination process, via the so-called final state rule (von Barth & Grossmann, Reference von Barth and Grossmann1982). At low irradiances, and thus low ionization fractions, it is highly unlikely that any neighboring atom is in an excited state. In this case, the emission will map the available partial DOS of the system in the ground state, where all of the ionic cores are Al3+. The average laser intensity above which an emitting atom will have a nearest neighbor in an excited state can be roughly estimated for a cubic system by I min = gE pha 0−3τ−13η(E ph), where g is the ratio between the number of atoms in the unit cell and the number of nearest neighbors, E ph is the excitation photon energy, a 0 the lattice constant, τ the core hole recombination time, and η the penetration depth within the sample. For bulk Al, I min is of order 2 × 10¹³ W/cm2, which is readily accessible in our experimental setup. Above this intensity the emitting atom has a non-negligible probability of having another excited (Al4+ core) atom as its neighbor, and thus the relevant final state of the system probed by the XES is in fact the local density of states of an Al3+ ion surrounded by neighbors that can be either Al3+ or Al4+, in a proportion that is a function of the XUV laser intensity.
The majority of electrons recombine via Auger decay. The radiative yield is only 0.24% (Bambynek et al., Reference Bambynek1972). Vinko et al. (Reference Vinko and Zastrau2010) used 32 atoms in the simulation cell with a Brillouin zone sampling using a 10 × 10 × 10 k-point grid. By comparing the core state energies of the two potentials, the authors find the L-edge shift upon excitation to be (−20.4 ± 0.1) eV, a result in good agreement with measurements from Auger spectroscopy of (−20.5 ± 0.2) eV (Dufour et al., Reference Dufour and Mariot1976)). The derived temperatures are about 0.4 eV at low intensities (~1013 W/cm2) and 1.1 eV at medium intensities (~1014 W/cm2), with an uncertainty less than 0.1 eV, which are used as an input for the quantum-molecular dynamics (QMD) calculations. These confirm that a change in electron temperature alone, up to several eV, does not modify significantly the band structure of Al (Recoules et al., Reference Recoules and Clérouin2006).
The conduction band temperature is seen to increase up to 1.1 eV, as can be seen from the changing slope of the Fermi function at 73 eV, which is the dominant effect to the emission spectrum as the intensity is increased up to moderate values.
4.4. Bremsstrahlung
The authors' observation of a non-zero continuum radiation in the XES (Fig. 8), which increases with higher irradiance, led to the interpretation as XUV continuum radiation. Zastrau et al. (Reference Zastrau and Fortmann2008) analyzed the XES from bulk Al irradiated at I ~ 1014 W/cm2 at BL2 for the first time using fundamental relations (Griem, Reference Griem1997). The electron temperature and density were inferred from the continuum background radiation due to bremsstrahlung. We compared the experimental data to Kramers' law (Kramers, Reference Kramers1923)

for the free-free emissivity j ff(λ). Here, m e is the electron mass and g T(λ) is the wavelength dependent Gaunt factor (Gaunt (Reference Gaunt1930)), accounting for medium and quantum effects. It is calculated in the Sommerfeld approximation (Fortmann et al., Reference Fortmann and Redmer2006). Statistical analysis of the data in this range yielded 40.5 eV for the free-electron-temperature with a root-mean-square (RMS) error of ± 5.5 eV.
Dzelzainis et al. (Reference Dzelzainis and Chalupsky2010) also investigated the continuum emission from Al and higher Z targets such as Fe and Co at peak intensities of several 1016 W/cm2 at BL3. In all cases, both teams got similar temperatures from 30 to 40 eV, which is significantly lower than the expected temperatures for linear absorption. For the linear absorption coefficient of Al at 13.5 nm excitation, neglecting the saturable absorption (Nagler et al., Reference Nagler and Zastrau2009), the predicted temperature would have reached 150 eV. (Dzelzainis et al., Reference Dzelzainis and Chalupsky2010).
We observe that the continuum radiation is significantly changing in amplitude as function of irradiance, but the slope (which defines the temperature) is similar, as can also be seen from Figure 8. For all considered fluences, the dominant process of fast-electron creation is the Auger effect which injects electrons at about 73 eV into the continuum. The electron distribution hence does not vary in energy, but only in concentration. This is most likely the reason why we observe temperature from 30 to 40 eV, but at amplitudes differing over five orders of magnitude. We recall from Eq. (1), that the emissivity scales as j ff(λ) ~ n e2 with the number of free electrons.
Vinko et al. (Reference Vinko and Gregori2009) have conducted calculations of the XUV absorption in crystalline and warm dense Al at solid density over an extended range of temperatures and frequencies using both analytical and density-functional theory molecular dynamics (DFT-MD) first-principle methods. For photo excitation below the L-edge, or in the saturation regime, a rise in the absorption as a function of temperature is predicted, the degree of which is dictated by the behavior of both the ion and electron structure factors.
4.5. XUV Ion Line Emission
As reproduced in Figure 11, Dzelzainis et al. (2010) showed that in the low intensity case (I ≈ 1014 W/cm2) we observe only the scattered FEL light in first and second order. In the tight focus case (I ≈ 1016 W/cm2), we identified strong additional features at 13 nm and 16 nm using the NIST database (Kaufman & Martin, Reference Kaufman and Martin1991) as the AlIV lines; 2s 22p 6 − 2s 22p 5 (2P 0) 3d1P and 3D lines at 12.97 nm, and 13.04 nm, respectively, and the 2s 22p 6 − 2s 2 2p 5 (2P0) 3s 1P and 3P lines at 16.01 nm and 16.17 nm, respectively.
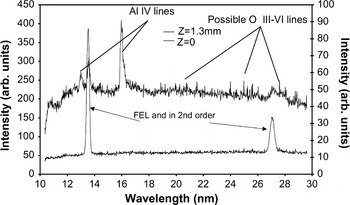
Fig. 11. Upper curve: Emission spectra taken at best focus, integrated over 3000 shots and lower curve: far from focus integrated over 1000 shots. The intensity is scaled to account for the different number of integrations. Figure from Dzelzainis et al. (Reference Dzelzainis and Chalupsky2010).
The width of the 16.01 nm and 16.17 nm lines has been modeled and found to correspond to an electron density of 3.0 ± 0.5 × 1021 cm3. This is somewhat lower than solid density, but is not unexpected because of the time-integrated nature of the data.
By applying hydrodynamic simulations with the one-dimensional HYADES code (see Fig. 12), we can see that within 5 ps the plasma outer layers have cooled from about 23 eV peak locally equilibrated temperature to about 10 eV, just at the upper limit of the inferred temperatures from the spectra. Looking at the 50 ps case, it is clear that the plasma emission from Al IV can last many tens of picoseconds. Given the fact that the reciprocal of the A-rates of these transitions is about 100 ps, we can make the assumption that the emission comes from the later time stages when the temperatures are indeed generally less than 10 eV. The line ratios from these spectra give temperatures of about 8 ± 1 eV in accordance with these simulations. Further, the absence of Al V emission lines suggests that the peak locally equilibrated temperature is not over 40 eV. For a linear coefficient of Al (or: no saturable absorption) the temperature would have reached 150 eV (Dzelzainis et al., Reference Dzelzainis and Chalupsky2010), which is clearly not observed.

Fig. 12. (Color online) HYADES simulations of the plasma evolution. Figure from Dzelzainis et al. (Reference Dzelzainis and Chalupsky2010).
The transitions at shorter wavelengths are related to transitions 1s 22s 22p 6–1s 22s 22p 5 3d 1P, 3P and 3D at 13.0 nm, 13.1 nm and 13.2 nm, respectively (Galtier et al., Reference Galtier and Rosmej2011). Also, we observed significant transitions identified as 1s 22s 22p 6–1s 22s 22p 5(2P o)3s 1P and 3P lines at 16.1 nm and 16.2 nm, respectively, and intra-shell 2p-2s transitions around 26 nm. The satellites and intra-shell transitions, allow the authors to identify the Auger electrons to be the predominant contribution to the heating process in the XUV laser-matter interaction for the first time.
The red fit curve in the spectrum presented in Figure 13 is the result of the following procedure embedded in the RAMA code (Galtier et al., Reference Galtier and Rosmej2011). This is a collisional radiative code to simulate emission spectra. The spectral distribution

of all line transitions originating from the configurations K 2L 7M 1 have been calculated for kT e = 8 eV, whereas those from K 2L 7M 2 and K 2L 7M 3 configurations have been calculated with the MARIA/RAMA-codes for kT e = 25 eV (Galtier et al., Reference Galtier and Rosmej2011). In the equation, g j is statistical weight, and A ji is the transition probability. The K 2L 7M 2 and K 2L 7M 3 configurations are screened configurations of the resonance K 2L 7M 1 state. Note that the fit between theory and experiment is good only if the screened configurations are calculated at a different temperature. One reveals the important ability of this spectroscopy to resolve the XUV laser/matter interaction process even if it's time integrated. Moreover, the emission from K 2L 7M 2 and K 2L 7M 3 configurations corresponds to a plasma created right after the destruction of the Al lattice, thus, still at a high electron density, calculated by the RAMA code to be about 1022 to 1023 cm−3. At such high density and moderate temperature the matter is well within the WDM regime.

Fig. 13. (Color online) The red curve is the sum of the K 2L 7M 1 contribution at T e = 8 eV and the K 2L 7M 2 and K 2L 7M 3 both at T e = 25 eV (separate lines labeled as C I, C II, and C III). Figure from Galtier et al. (Reference Galtier and Rosmej2011).
In Figure 14, the three most intense irradiations from Figure 8 are presented together with a computational XUV emission spectrum obtained by using FlyChk (Chung et al., Reference Chung and Chen2005). The FlyChk code utilizes accurate sets of auto-ionization rates, collisional excitation cross-sections, and photo ionization cross-sections for super-configuration levels, that is, for ions with more than three electrons. Note that the experimental spectra have a different slope due to the bremsstrahlung contribution on femtosecond time scales. On time scales of several ten to hundred picoseconds, we can reproduce the contribution of the line spectrum at best by a plasma with temperature T = 17 eV at density ρ = 2.3 × 1021 cm−3.

Fig. 14. (Color online) XES data of the three most intense irradiations, together with a simulation of the plasma emission using the FlyChk code. The XES spectra contain bremsstrahlung, which is the reason for the different slopes of the spectra. Beside, the composition of ionic lines can be reproduced with an expanded plasma of 2.3 × 1021 cm−3 density and T = 17 eV.
4.6. Aluminum Surface Oxide Layer
In Dzelzainis et al. (Reference Dzelzainis and Chalupsky2010), the authors discuss that one should expect a layer of 5 nm contaminants on the target surface due to the exposure to normal atmosphere.
According to Rus et al. (Reference Rus and Mocek2011), an important feature of their simulated transmission of 21 nm femtosecond pulses through thin Al foils is the delayed onset relative to the laser pulse when an Al2O3 oxidation layer is included. The delay is dictated by the time taken for the compression wave to breakout on the far side of the foil. This compression wave arises due to the enhanced, virtually total, absorption of the soft X-ray radiation in the Al2O3 layer, which is in contrast to the pure Al case. Upon breakout of the compression wave at the back, i.e., the non-irradiated side, the sample density drops rapidly and the transmission increases. The simulations indicate that the sample has enhanced absorption due to a thin oxidation layer, which is in fact reasonable given the high oxidation rate of Al.
It may be noted that the measured transmission is lower than that predicted (0.48) for pure Al by the Center for X-ray Optics in Berkeley, while other independent measurements of transmission through solid Al (Henke et al., Reference Henke1993) suggest a lower value (0.32) than that measured in reported experiments (Rus et al., Reference Rus and Mocek2011).
4.7. Optical Emission Spectroscopy
An optical emission spectrum of the Al plasma plume, obtained by Cihelka et al. (Reference Cihelka and Juha2009), is shown in Figure 15.

Fig. 15. The time-integrated optical emission spectrum of Al plasma plume formed by 13.5 nm FLASH beam focused by the off-axis parabola to achieve irradiances exceeding 1016 W/cm2. Figure from Cihelka et al. (Reference Cihelka and Juha2009).
The strongest lines, 308.2 nm, 394.4 nm, and 396.2 nm can be assigned to the neutral atoms of Al (Al I). Several weak lines indicate a presence of singly and doubly charged ions. The strongest line among these ionic lines can be found at 358.7 nm; the line belongs to Al+. Very weak lines of Al+ and Al2+ have also been found in the spectral range above 450 nm. The intensity ratio of atomic and ionic lines is about 100. The very low abundance of ions in the plume indicates its low temperature. It should be pointed out, that this was the first instance of ionic lines being observed in an optical emission spectrum of a plume generated by focused FLASH radiation.
Surprisingly, only lines belonging to the neutral atoms were observed at intensities around 1013 W/cm2. No lines of atomic ions have been identified in ultra-violett and visible spectra emitted from the plasmas formed by the FLASH beam focused in a 20 µm spot.
The Al spectrum was analyzed using the simplified version of the time-dependent, multi-level, multi-ion stage metastable resolved collisional irradiative code MARIA (Rosmej, Reference Rosmej2001). The spectral distribution
where g j is statistical weight, A ji is j → i transition probability, b j = exp(−E j/kT ext) is the Boltzmann factor, and P ji represents the line profile, which is strongly sensitive to the excitation temperature (Griem, Reference Griem1997; Lochte-Holtgreven, Reference Lochte-Holtgreven1995). The best agreement between the experimental spectra and simulations was found to be kT e = 0.7 ± 0.2 eV according to the intensity ratio of lines at 308.2 nm, 394.4 nm, and 396.2 nm (Cihelka et al., Reference Cihelka and Juha2009).
These temperatures in the range of 0.5 to 1.0 eV characterizing the OE spectra are by one order of magnitude lower than those obtained from XUV emission spectra. The XUV emission comes from the interior of the plasma plume (because of higher critical densities corresponding to the shorter wavelengths) which likely stays at higher temperatures and densities for a longer period of time than the surface of expanding plume.
5. Summary and Concluding Remarks
The capability of XUV FEL radiation to create WDM by interaction with a solid has been investigated. We discuss that the dominant absorption process even at intensities of 1016 W/cm2 is photo-absorption of the L-shell.
Radiative decay spectra are emitted within the first 40 fs after irradiation and reveal the temperature of the conduction electrons close to the Fermi energy. The slope of the degenerate electron distribution at the Fermi energy can be fitted with temperatures of around 1 eV. On the same timescale, radiation-less decay injects Auger electrons at higher energies into the continuum. They form an electron distribution with higher energies (around 72 eV) within the conduction band electrons and are the source of bremsstrahlung emission with temperatures ranging from 20 to 40 eV for irradiances of 1013–1016 W/cm2.
On a picosecond time-scale, we observe emission from ions, most dominantly from Al IV. The number of lines increases as the irradiance increases, indicating higher plasma temperatures. Anyhow, the absence of higher ionization stages leads to an upper limit of 40 eV for the plasma temperature due to saturable absorption.
Finally, we observe neutral atomic lines in the optical spectra. At highest irradiances, the ratio of ionic to atomic lines is still 1:100. Here, we observe the absorption plasma plume expanding into the vacuum with temperatures of 0.5 to 1.0 eV. These temperatures are about one magnitude lower than the ionic lines observed in the XUV, indicating cooling of the plasma plume on nanosecond time-scales.
In general, we emphasize that the assumption of a single temperature and density for the plasma modeling still limits the presented results. The spatial and temporal distribution of the complex plasma gradients is the subject of present and future research. Our results strongly influence the models approaching warm dense matter. We already stimulated theoretical descriptions of the fast electron dynamics via Monte-Carlo approaches (Medvedev et al., Reference Medvedev and Zastrau2011). The proper description of bremsstrahlung emission has been tested for the first time using our data (Zastrau et al., Reference Zastrau and Fortmann2008). Further, the observation of saturable absorption leads to new perspectives of generating homogeneously heated warm dense matter samples. These are crucial to obtain further knowledge on the phase diagram of Al and other low-Z elements at warm dense matter conditions. This will finally lead to a more detailed equation-of-state, impacting not only the physics of dense plasmas and inertial confinement fusion, but also theoretical astrophysics.
ACKNOWLEDGMENTS
We thankfully acknowledge financial support by the German Helmholtz association via the Virtual Institute VH-VI-104 and the Helmholtz Institute Jena, the German Federal Ministry for Education and Research via project FSP 301-FLASH, and the Deutsche Forschungsgemeinschaft DFG via the Sonderforschungsbereich SFB 652. S.M.V., T.W., and J.S.W. are grateful to the UK EPSRC for funding under grant numbers EP/F020449/1, EP/H035877/1 and EP/G007187/1. Work of T.D., C.F., S.H.G., R.W.L., and A.J.N. was performed under the auspices of the U.S. Department of Energy by Lawrence Livermore National Laboratory under Contract No. DE-AC52-07NA27344 and supported by Laboratory Directed Research and Development Grant No. 11-ER-050. Further, we thank the Czech Ministry of Education via projects LC510, LC528, ME10046, and LA08024, Czech Science Foundation via projects 208/10/2302, 108/11/1312 and 205/11/0571 and Czech Academy of Sciences via project AV0Z10100523, IAAX00100903, and KAN300100702. Finally, the authors are greatly indebted to the machine operators, run coordinators, scientific and technical teams of the FLASH facility for enabling an outstanding performance.


