


1. INTRODUCTION
Properties of materials in a warm dense state are of interest concerning interiors of giant planets, white dwarfs, and hydrodynamics of fuel pellet of inertial confinement fusion (ICF) (Davidson, 2003; Lindl, 1995; Ichimaru et al., 1987). Those structures and behaviors are strongly affected by an equation of state (EOS) and transport coefficients. The warm dense regime is characterized by the coupling parameter Γ for ions and the degeneracy parameter θ for electrons. Here, Γ is a measure of Coulomb interactions and is defined as a ratio of average Coulomb interaction energy to average kinetic energy
where a = (3/4πni)1/3 is the ion-sphere radius, Zeff is an effective ion charge, kB is the Boltzmann constant, ni is the ion density, and T is the plasma temperature. The degeneracy of electron is

where EF is the Fermi energy, ne is the electron density, and me is the mass of electron. To understand this regime, two theoretical works were carried out. One approach is to evaluate electron exchange-correlation by quantum molecular dynamics (QMD) simulation (Renaudin et al., 2002; Clerouin et al., 2005), and the other approach is to evaluate ionization effect in strongly coupled and degenerated plasma by statistical way (Desjerlais, 2001; Kim and Kim, 2003; Kuhlbrodt et al., 2005). Although these theoretical approaches give similar results of conductivity at a warm dense regime, they are not examined experimentally in some aspects of this regime.
In recent years, we are able to produce the warm dense state in a laboratory by some experimental methods (Renaudin et al., 2002; Krisch & Kunze, 1998; DeSilva & Katsouros, 1999; Saleem et al., 2001; Sasaki et al., 2005; Yoneda et al., 2003; Lee et al., 2002; Ng et al., 2005). They are based on the way to use irradiation of ultra-short laser pulses, a plasma formation in isochoric vessels and/or a wire explosion using pulse discharges. A new approach using irradiation of heavy ion beam is also proposed by some research-groups at GSI (Hoffmann et al., 2002; Dewald et al., 2002; Constantin et al., 2004; Tahir et al., 2004; Hoffmann et al., 2005; Temporal et al., 2005) and virtual national laboratory (VNL) (Davidson, 2003; Grisham, 2004). They are planning to study the high energy density (HED) and/or warm dense matter (WDM) physics, based on heated plasma with well-defined energy deposition by an ion beam at high incident energy region or the Bragg-peak region. One of the important points of this measurement is to keep a consistency in determination of density, temperature, an average ionization state, and pressure. In warm dense region, the behavior of degenerated electrons and strongly coupled ions can affect EOS, and transport coefficients. Therefore, HED and/or WDM physics are reduced to establish a reliable method in determination of self-consistent physical parameters.
In this study, we measured electrical conductivities of WDM, and proposed a method that semi-empirically evaluates the EOS from the comparison of experimental results with numerical simulation. In order to make a comparative study of WDM, the experimental conditions should be as simple as possible. For this reason, a cylindrical plasma in a warm dense state is produced by a wire explosion in water driven by a cylindrical, fast pulse generator. If the discharge occur in vacuum (Hammer & Sinars, 2001), in air or in a high pressure gas, the wire/plasma is not tamped well to keep a dense state. Figure 1 shows typical plasma parameters and expected parameter region of a wire-explosion plasma in water. With this method we can compare the hydrodynamic behaviors both experimentally and numerically, and investigate the warm dense plasma over a wide range of parameter region on the density-temperature diagram.

Typical plasma parameters and expected parameter regime of wire explosion plasma on density-temperature diagram.
2. EXPERIMENTAL SETUP
A schematic diagram of the experimental arrangement is shown in Figure 2 (Sasaki et al., 2005; Horioka et al., 2004). A capacitor bank; C consists of cylindrically arranged 8 × 0.4 μF low inductance capacitors, which drove a wire explosion. The capacitor bank was charged to at least 10 kV to ensure vaporization of wire, and it was switched by a low-inductance triggered spark gap switch. The current and the voltage were measured by a Rogowski coil and a voltage divider as shown in Figure 2. The test chamber was filled with water, and the expanding plasma was moderately tamped by the surrounding water. The plasma boundary (contact surface) was measured by an image converter camera (Imacon 468: DRS Technologies, Parsippany, NJ) mounted with a microscopic lens (QM100: Questar, New Hope, PA). The fast streak/image converter camera was triggered by a delay pulser to synchronize with the discharges. The evolutions of a shock surface were observed by the shadow graph method using a fast streak camera (C3366: Hamamatsu Photonics, Japan) and a LD laser (λ = 532 nm). The temperature of wire/plasma were estimated by a spectroscopic method at visible wave length.

Schematic diagram of experimental arrangement for exploding wire discharges in water.
The experimentally obtained voltage waveform was composed of resistive and inductive parts. The stray inductance of the discharge device was estimated to be L = 105 nH from shunted waveforms of the current and voltage. Thus, the effective resistance R(t) of wire/plasma can be evaluated using the next equation;

and leading to the conductivity of wire σ(t) by
where l is the length of a wire/plasma, and rp(t) is its radius. The time evolution of input energy E(t) can be evaluated using,
The wire diameter was selected to be 50 μm or 100 μm, considering the skin depth. For all wires (aluminum, copper, and tungsten) employed in this experiment, the skin depth was larger than the diameter of the wires (e.g., from the typical waveform in Fig. 3, basic frequency was estimated to be about 0.5 MHz, and the conductivities of aluminum, copper, and tungsten at solid state are 60, 38, 19 MS/m, respectively. Then, the skin depth of these wires are estimated to be about 90, 120, and 160 μm which are larger than the wire radius).

Typical waveforms of (a) aluminum, (b) copper, (c) tungsten-wire explosion in water.
3. RESULTS AND DISCUSSION
Figure 3 shows typical voltage and current waveforms of exploding discharges of wires with 100 μm in diameter and 18 mm in length. As shown, the current waveforms of all wires have two peaks. The first peak corresponds to liquid-vapor phase transition. This result can be corroborated by the comparison of time-evolved resistance, temperature, and images of plasma boundary. The vaporization times are estimated to be about 200 ns for aluminum, copper, and 300 ns for tungsten wire.
All images of the fast framing camera show symmetric expansion at least up to discharge time of 2 μs (Sasaki et al., 2005). Time-evolutions of the plasma boundary are shown in Figure 4. Behaviors of the boundaries depended on the input energy history of wire explosion. The density distribution of plasma is made uniform through the propagation of rarefaction (sound) wave; in our experimental condition, the sound wave in plasma propagates within a hundred nanoseconds. Assuming a homogeneous expansion, the plasma density ρ(t) is obtained from
where r0 is the initial wire radius and ρs is the solid density of wire. As the plasma was tamped by water, the density of all plasma is to be ρ ≥ 0.01ρs until 2 μs.

Time evolution of plasma surface taken from images of fast framing camera.
The wire/plasma temperature can be estimated from intensity ratio of plasma light emission at visible wavelength. The wavelength is calibrated by two-lasers (He-Ne; λ = 632 nm, frequency doubled YAG; λ = 532 nm). A typical time-evolution of plasma radiation at 532 nm and 632 nm is shown in Figure 5. The radiation can be correlated to the input energy. In this experimental condition, the wire/plasma is assumed to be in local thermodynamic equilibrium (LTE). The black-body radiation intensity is
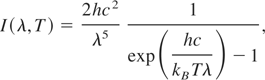
where λ and c are wavelength and speed of light, respectively, and h is the Planck's constant. The time evolution of intensity ratio from the tungsten plasma is shown in Figure 6. Although the intensity ratio between λ = 532 nm and 632 nm is not sensitive enough to estimate the wire/plasma temperature accurately at more than one electron volt due to their closer wavelengths, it represents well the wire evolution at low temperature.

Evolution of spectral intensity of tungsten wire/plasma at 532 nm and 632 nm with Δλ = 0.15 nm.

Time evolution of intensity ratio I532 /I632 of tungsten wire/plasma with visible spectroscopy.
The first peak of the line ratio corresponds to the vaporization temperature (about 6000 K) at about 300 ns. Then, the ratio decreases sharply with expanding and cooling. The tungsten wire/plasma temperature decreases to 3000–5000 K from 0.5 μs to 1.5 μs. Thus, the wire/plasma in the expanding phase is mainly composed of dense neutral gas. From the spectroscopic measurement, the temperature of wire/plasma is estimated to be 1–3 eV at 2 μs.
The effective ion charge is one of the important parameter to define a coupling constant of ions, degeneracy of electrons, electron pressure, and transport coefficients. In this regime, an average ionization state is calculated by such a theoretical model as the Thomas-Fermi model of More (1981). Assuming LTE, the relation between the input energy and the temperature of wire/plasma is given by the following equation:
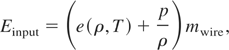
where Einput is the input energy, e(ρ,T) is the internal energy per unit mass, p is the pressure, ρ is the density, and mwire is the mass of wire. The measuring time scale of wire/plasma is comparable to the input energy history. Therefore, the energy translation can be the hydrodynamic motion. When we neglect the p/ρ term, with the ideal EOS approximation leads to,
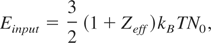
where N0 is the total particle number. Using the simplified assumption of Eq. (9), the temperature is estimated to be about 5–10 eV, and the average ionization is predicted to be 2.5–3 eV at 2 μs. The temperature and density with the approximation indicate that the plasma is in a warm dense state. From the time evolution of density and temperature, this model predicted the coupling parameter Γ ∼ 2 for aluminum wire, Γ ∼ 2.5 for copper, and Γ ∼ 3 for tungsten wire at 2 μs. These predicted values indicate that all of the materials in the water-tamped exploding wires are estimated to be in strongly coupled state with Γ > 2 at 2 μs.
Curves of the wire/plasma conductivity are obtained as a function of discharge time from the time-evolution of radius and resistance, which are shown in Figure 7 for aluminum, copper, and tungsten wires. The wire plasmas evolve from solid, liquid, to gaseous state then dense plasma. After the liquid-vapor phase transition (at about 200–300 ns), conductivities of copper and aluminum show the minimum values at 500 ns, and tungsten at 1 μs, and the regions are supposed to be dominated by a dense low temperature vapor. After this phase, conductivities of wires gradually increase according to the plasma evolution. We take the Coulomb logarithm with extended degenerated electrons (Lampe, 1968) into account for estimation of Spitzer's (Spitzer & Harm, 1953) conductivity, compared with that of the strongly coupled plasmas, and showing dashed lines in Figure 7. As shown, the observed values are 10 times as large as the Spitzer's conductivities.

Time evolutions of conductivities for copper, aluminum and tungsten-wire explosion, and comparison of those experimental conductivities with Spitzer's models.
Figure 8 shows the comparison of experimental results with theoretical estimation by Kuhlbrodt et al. (2005). Although the qualitative behavior of conductivities is similar, these results show that more accurate model is needed especially at low temperature region.

Comparison of theoretical model by Kuhlbrodt et al. with experimental results (a)aluminum, (b)copper, and (c)tungsten.
A streak shadow-graph of the copper explosion is shown in Figure 9a. It indicates that the copper evolves with a cylindrical symmetric shock wave. The evolutions of the shock surface of each material are shown in Figure 9b. In the case of instantaneous line explosion, a shock radius evolves in the framework of a self-similar solution (Zel'dovich & Raizer, 1966);
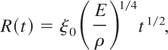
where ξ0 is the normalized length, E is the energy per length, ρ is the density, t is the time. Eq. 10 predicts that a cylindrical shock radius is depending on t1/2. However, as shown in Figure 9b, the experimental results are far from this scaling and this means the shock behavior is affected by the history of plasma pressure.

(a)Streak image of copper plasma and shock surface from 1.17 μs to 1.77 μs. (b)Time evolution of shock surface in water.
4. SIMULATION MODEL AND RESULTS
4.1. Simulation model
In our study, we intend to make a semi-empirical scaling of an EOS and transport coefficients of WDM. To describe the hydrodynamic motion triggered by a pulsed electro-magnetic energy applied to a wire, a one-dimensional-magneto hydrodynamic (MHD) calculation was carried out. We calculated the hydrodynamic behavior of wire plasma using the RCIP-CUP method (Xiao et al., 1996; Yabe et al., 2001). Here, a high temperature, solid density vapor column is assumed, and the other region is filled with water. The initial temperature is assumed to be the evaporation temperature for the wire region and 300 K for the water. To compare the numerical results with experiments, experimentally observed current, and conductivity profiles are used for the energy input into the plasma. The EOS of water is obtained from Wagner and Pruss (2002). To solve the hydrodynamic motion, the ideal EOS, or the QEOS (More et al., 1988) is used. The first step to understand the evolution of warm dense state is to make a comparison of the hydrodynamic evolutions with the ideal EOS and the QEOS. In this calculation, the coefficient of thermal diffusion is introduced from the Spitzer's model. For the undefined parameter of Coulomb logarithm, Lampe's degeneracy factor is used (Lampe, 1968; Brysk et al., 1975).
4.2. Simulation results and discussion
Figure 10 shows a shock wave and a plasma boundary with the use of the ideal EOS or the QEOS of aluminum. As shown in the figure, the shock trajectory obtained by the MHD simulation using the ideal EOS is faster than that with the QEOS. Please note that the shock trajectory can be determined by the propagation of “characteristics” (Zel'dovich & Raizer, 1966) through water from the contact surface to the shock front, and it needs transit time of 0.1 μs in this condition. Accordingly, the shock wave trajectory reflects the contact surface motion at ∼0.1 μs before the arrival of characteristics up to the shock front, and the corresponding pressure history of wire plasma in a wider spatial and temporal region.

Comparison of shock wave and plasma boundary trajectories. Crosses denote the experimental results, solid lines are fitting curve for experimental data, and dotted lines show numerical results using QEOS, and dashed-dotted lines show the numerical results using ideal EOS.
Figure 11 shows a shock wave and plasma boundary of the numerical results with the QEOS and the experimental results. The hydrodynamic behaviors depended on a wire material. The experimentally obtained shock wave behaviors at initial phase are almost the same with the numerical results. In contrast, the experimentally obtained contact surfaces are faster than the numerical ones. For this reason, the condition of water at shock behind was estimated to be about T ∼ 400 K, ρ ∼ 1.3 g/cc, and P ∼ 2 GPa, but the water's EOS by IAPWS95 covers a validity range for temperatures from melting line (lowest temperature 251.2 K at 209.9 MPa) to 1273 K and pressures up to 1 GPa. Therefore, the water's EOS at dense and high pressure regime is extrapolated in this calculation. To estimate the wire's EOS, we have to evaluate effect of the water's EOS quantitatively.

Comparison of shock wave; (1), (2), and plasma boundary; (3), (4), trajectories. Crosses denote the experimental results, and solid lines are fitting curve for experimental data, and dotted lines show the numerical results using the QEOS (More et al.).
5. CONTROLLABILITY OF WARM DENSE STATE
One of the factors that affect temperature evolution is an initial resistance. The resistance of tungsten wire at room temperature is two times higher than that of aluminum wire, and three times higher than that of copper. Therefore, we can characterize WDM in large parameter region by changing charged voltage, length, and/or diameter of wire.
To understand a behavior of WDM in wider parameter range, we investigated controllability of plasma parameters. Figure 12 shows voltage-current waveforms of aluminum, copper, tungsten, and silver wires with 50 μm in diameter and 18 mm in length. The current waveform has a small spike which is due to vaporization in the beginning of discharge, and after an insulation phase, the discharge restarted. Compared with the voltage-current waveform by a difference in diameter, 50 μm in diameter case has long insulation time. We are concerned about the dependence of insulating time for a control of plasma condition. Figure 13 shows a time interval versus a radius and a length of wires. The insulation times of aluminum and tungsten wires are proportional to the length. However, the behaviors of copper and silver with 100 μm in radius show different dependence, probably because of the difference of internal structure caused by a non-uniform energy deposition.

Typical waveforms of (a) aluminum, (b) tungsten, (c) copper, and (d) silver wire explosion with initial diameter of 50 μm.

Time interval versus a radius and a length of wires.
The behavior of copper wire/plasma in this region is shown in Figure 14, the copper wire/plasma column has a cylindrical symmetry and the radius is about 200 μm and resistance R ∼ 300 Ω at 3 μs. The extrapolated density from the photograph data is 0.01ρs at 10 μs, and the conductivity is estimated to be σ ∼ 102 S/m. The wire/plasma radius behaviors in the insulating phase can be estimated by the line-explosion scaling of Eq. (10). Thus, the same density is to be about 2 μs with 100 μm in diameter case, and the arrival time interval is to be about 5 times. The evolution of wire/plasma parameter on density-temperature diagram can be controlled by the duration of the insulating phase, and the wire/plasma density at gaseous phase has a possibility to define an onset point of input energy.

Input energy evolution of copper at 50 μm in diameter and framing photograph evolved wire at 180 ns and 3000 ns.
6. CONCLUSION
We investigated behaviors of exploding wire discharges for aluminum, copper, and tungsten in water as a method for study on warm dense matter physics. The behaviors of plasma were evaluated by a fast framing camera and a spectroscopic method together with basic electrical diagnostics, and estimated the parameter regime based on a simpli-fied analytical model. The estimation indicates that the wire/plasma evolves as a function of discharge time accompanied with phase transitions from solid, liquid, to dense vapor, and finally warm dense plasma, showing that the evolution depends not only on charge voltage but also on material. The wires at 10 kV in charged voltage, 18 mm in length, and 100 μm in diameter typically reached ∼0.01ρs, and a few electron-volts, at discharge time of 2 μs, which indicates that plasma is in a warm dense state with coupling parameter Γ of 2–3. The parametric survey also indicates that, by the pulse discharges in water, we can make a WDM over a wide range of parameter region.
We compared an experimentally obtained electrical conductivity in a warm dense state with a theoretical model. Although, the qualitative behavior of conductivities is similar, these results indicate that detailed analyses are needed especially at low temperature region. We have also investigated a behavior of a plasma boundary and a shock wave in water both experimentally and numerically. The comparison shows that the hydrodynamic behaviors are strongly affected by EOS models. This indicates that we can get not only measurements of conductivity but also possibility of “semi-empirical” EOS scaling (Sasaki et al., 2005) from the comparison.
ACKNOWLEDGMENTS
This work was partly supported by the Grant-in-Aid of the ministry of education, science and culture of Japan. The authors would like to thank Prof. S. Kawata and Dr. T. Kikuchi at Utsunomiya University and Prof. M. Shiho at JAEA (Japan Atomic Energy Agency) for fruitful discussions on this subject.


