1. INTRODUCTION
Interaction phenomena of ion-beam and laser radiation with matter have a large range of application in different fields of science, ranging from basic research of plasma properties to application in energy science. While interaction processes of ion beams with solid and gaseous matter have been studied in detail for many decades, the interaction with ionized matter is still difficult to address experimentally, due to the transient nature of plasma targets. This became possible only, when intense beams from ion accelerators were coupled to plasma devices of all kinds. Pioneering work in this field has been performed at GSI-Darmstadt starting in the early 1990s and is continued there until today. In 1990, they succeeded for the first time to induce hydrodynamic motion in a solid target by irradiation with an intense low energy heavy ion beam (Jacoby et al., 1990; Funk et al., 1998). The emphasis then shifted to the investigation of energy loss and charge exchange phenomena (Dietrich et al., Reference Dietrich, Hoffmann and Boggasch1992; Jacoby et al., Reference Jacoby, Hoffmann, Laux, Müller, Wahl, Weyrich, Boggasch, Heimrich, Stöckl and Wetzler1995). Recently, hot dense laser plasmas were employed to study charge exchange and energy loss processes (Frank et al., 2010). The stopping power of ionized matter today is a topic of considerable interest due to the fact that intense ion beams are considered to be an effective driver for inertial confinement fusion (ICF) (Renk et al., Reference Renk, Mann and Torres2008; Ter-Avetisyan et al., Reference Ter-Avetisyan, Schnurer, Polster, Nickles and Sandner2008; Adoin et al., Reference Adonin, Turtikov, Ulrich, Jacoby, Hoffmann and Wieser2009; Meyertervehn et al., 1990; Osmani et al., 2010; Deutsch & Didelez, 2011; Deutsch et al., 2011; Didelez & Deutsch, 2011; Hu et al., 2011; Kawamura et al., 2011; Nersisyan & Deutsch, 2011). At the Institute of Modern Physics (IMP), Lanzhou, and other laboratories in China as well, we started to enter this field, using the available facilities in China. We present an overview on recent results and developments of beam-plasma interaction physics addressed with heavy ion and laser beams combined with accelerator and nuclear physics technology.
2. RESEARCH ON LOW ENERGY ION AND PLASMA INTERACTION (Y. Zhao, R. Cheng, D. Zhang, Y. Wang, A. Golubev, X. Zhang, X. Zhou, X. Wang, Z. Hu, G. Xu, J. Ren, Y. Li, Y. Lei, Y. Wang, and G. Xiao)
The progresses of the research on low energy ion and plasma interaction at the 300 high-voltage-electron-cyclotron-resonant ion source (HV-ECR) platform at heavy ion research facility (HIRFL) in Lanzhou are introduction (Xu, Reference Xu2009). Both proton and heavy ions with kinetic energy ranging from several tens to hundreds keV/u were applied in the experiments. The gas discharging plasma with temperature around 2 eV and electron density around 1017/cm3 has been tested and will be setup on the beam line soon. The simulation results on stopping power, charge effect, and transportation of ion beams passing though such plasma is presented. It is first found that, low energy ion beams will be strongly focused and pulsed due to the oscillation of the weak-field formed in the plasma.
Investigation of the interaction processes of ion beams with plasma has attracted a lot of attention during the last decades. The motivations are mainly listed as follows: (1) the energy deposition process of heavy ions in ionized matter is one of the most important processes of heavy-ion-driven high energy density and ICF; (2) Plasma devices could be served as an important accelerator equipment to focus ion beams (so-called plasma lens), and or to strip ion beams (so-called plasma stripper). Beside these applications, such research is also an important fundamental topic to understand the atomic processes in plasma, such as the di-electron recombination process, the radiative electron capture process, and the effective charge in Coulomb interaction process, and so on (Sigmund, Reference Sigmund1969; Hoffmann et al., Reference Hoffmann, Weyrich, Wahl, Gardés, Bimbot and Fleurier1990; Dietrich et al., Reference Dietrich, Hoffmann and Boggasch1992; Jacoby et al., Reference Jacoby, Hoffmann, Laux, Müller, Wahl, Weyrich, Boggasch, Heimrich, Stöckl and Wetzler1995; Golubev et al., Reference Golubev, Turtikov, Fertman, Roudskoy, Sharkov, Geissel, Neuner, Roth, Tauschwitz, Wahl, Hoffmann, Funk, Süß and Jacoby2001; Sharkov, Reference Sharkov2001; Bock et al., Reference Bock, Hoffmann, Hofmann and Logan2005; Hoffmann et al., Reference Hoffmann, Blazevic, Ni, Rosmej, Roth, Tahir, Tauschwitz, Udrea, Varentsov, Weyrich and Maron2005; Logan et al., Reference Logan, Bieniosek, Celata, Henestroza, Kwan, Lee, Leitner, Roy, Seidl, Eylon, Vay, Waldron, Yu, Barnard, Callahan, Cohen, Friedman, Grote, Kireeff Covo, Meier, Molvik, Lund, Davidson, Efthimion, Gilson, Grisham, Kaganovich, Qin, Startsev, Rose, Welch, Olson, Kishek, O'shea, Haber and Prost2005; Tahir et al., Reference Tahir, Deutsch, Fortov, Gryaznov, Hoffmann, Kulish, Lomonosov, Mintsev, Ni, Nikolaev, Piriz, Shilkin, Spiller, Shutov, Temporal, Ternovoi, Udrea and Varentsov2005; Piriz et al., Reference Piriz, López Cela, Serna Moreno, Tahir and Hoffmann2006; Zhao et al., Reference Zhao, Xiao, Xu, Zhao, Xia, Jin, Ma, Liu, Yang, Zhang, Wang, Li, Zhao, Zhan, Xu, Zhao, Li and Chen2009; Teske et al., Reference Teske, Jacoby, Senzel and Schweizer2010; Tahir et al., Reference Tahir, Stöhlker, Shutov, Lomonosov, Fortov, French, Nettelmann, Redmer, Piriz, Deutsch, Zhao, Zhang, Xu, Xiao and Zhan2010; Pikuz et al., Reference Pikuz, Chefonov, Gasilov, Komarov, Ovchinnikov, Skobelev, Ashitkov, Agranat, Zigler and Faenov2010; Xin et al., Reference Xin, Zhu and Lei2010; Zhang et al., Reference Zhang, Zhao, Hoffmann, Yang, Chen, Xu, Li and Xiao2011).
As was shown in previous experiments, the stopping power of ionized matter is increased compared to that of cold, non-ionized matter. This effect is especially pronounced at low ion energies (E < 100 keV/u) where an enhancement factor of up to 35 has been observed (Bock et al., Reference Bock, Hoffmann, Hofmann and Logan2005). This effect is less dramatic at higher projectile energies (E > 1 MeV/u), but is still in the order of 2–3, depending on the projectile ion species, and the free electron density of the plasma (Hoffmann et al., Reference Hoffmann, Weyrich, Wahl, Gardés, Bimbot and Fleurier1990; Dietrich et al., Reference Dietrich, Hoffmann and Boggasch1992; Jacoby et al., Reference Jacoby, Hoffmann, Laux, Müller, Wahl, Weyrich, Boggasch, Heimrich, Stöckl and Wetzler1995). The energy loss of ions dE/dx in plasma can be calculated in terms of the well-known Bethe formula (Hoffmann et al., Reference Hoffmann, Weyrich, Wahl, Gardés, Bimbot and Fleurier1990; Peter & Meyer-ter-Vehn, Reference Peter and Meyer-Ter-Vehn1991a, Reference Peter and Meyer-Ter-Vehn1991b; Jacoby et al., Reference Jacoby, Hoffmann, Laux, Müller, Wahl, Weyrich, Boggasch, Heimrich, Stöckl and Wetzler1995),
 $$-\displaystyle{{dE}\over{dx}} = \displaystyle{{4{\rm \pi} e^4 Z_{eff}^2}\over{m_e v_p^2}} \left[\sum_k n_{bek} \ln \left(\displaystyle{{2m_e v_p^2}\over{I_k}} \right)\right. \left. + G \left(\displaystyle{{v_p}\over{v_{th}}} \right)n_{\,fe} \ln \left(\displaystyle{{2m_e v_p^2}\over {{\rm \hbar} {\rm \omega}_p}} \right)\right].$$
Where m e and e are the electronic mass and charge; Z eff and v p are the effective charge and velocity of projectile ions during traversing the target; n bek and I k are, respectively, the density and the mean ionization energy of the bound electrons for ion species k in the target; while n fe and ħωP are the free electron density and the plasmon energy of the target;  $G\left(\displaystyle{{v_p}\over{v_{th}}} \right)$ is the Chandrasekar's function accounting for the reduction of stopping power formula at low velocities, where
  $v_{th} = \sqrt{\displaystyle{{kT}\over{m}}}$ is the thermal velocity of the free electrons over the Maxwell distribution.
Since the capture/recombination cross-sections of the free electrons in plasma is dramatically reduced compared to that of the bound electrons in neutral or partially ionized matter, the charge state of ions is remained, even increased during traversing a fully ionized plasma. For slow ions, the effective charge will be much higher than that in a same amount of neutral target, which will for sure cause a dramatic increasing of the energy loss (Hoffmann et al., Reference Hoffmann, Weyrich, Wahl, Gardés, Bimbot and Fleurier1990).
On the other hand, the transporting property of ion beam in plasma has drawn a lot of attentions in the field of heavy ion accelerators. It was found that plasma can be used as a universal window to strip and focus a heavy ion beam (Hoffmann et al., Reference Hoffmann, Weyrich, Wahl, Gardés, Bimbot and Fleurier1990; Jacoby et al., Reference Jacoby, Hoffmann, Laux, Müller, Wahl, Weyrich, Boggasch, Heimrich, Stöckl and Wetzler1995; Drozdovskiy et al., Reference Drozdovskiy, Golubev, Novozhilov, Sasorov, Savin, Yanenko and Bochkov2011). Those researches were mainly concentrated on heavy ions with energy on order of MeV/u; however, if an ion beam could be striped at low energy, the accelerating efficiency of the accelerator behind the window will be increased by several times.
Here in this work, the progresses of research on low energy ion and plasma interaction at the HV-ECR platform at HIRFL are presented. This platform and the recent progresses on testing of the gas discharging plasma device are introduced. Based on the experimental condition, the energy loss, charge state revolution as well as the transportation of ion beam in the plasma was simulated.
2.1. Experimental Setup and Progresses on System Upgrading and Testing
The HV-ECR platform contains one ECR ion source, one lineal accelerator with maximum high voltage of 320 kV and five beam lines with research topics including highly charged ion physics, atomic physics, material science, biophysics, and astrophysics. Both proton and heavy ion beams with intensity on the order of tens to several thousands of enA can be produced by this ion source. The beam transporting efficiency from ion source to the target chamber is around 10 to 80 percent.
As shown in Figure 1, in order to investigate ion-plasma interaction, a 45° bending magnet with radius of 500 mm has been installed for measuring the charge state distribution and energy loss. The energy resolution of the magnet is around 0.1%.

Fig. 1. (Color online) The upgraded terminal for ion-plasma interaction at HV-ECR platform.
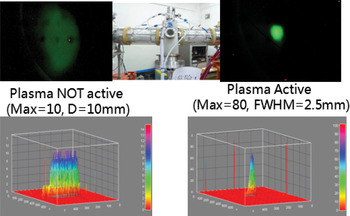
A Gabor plasma lens was built and tested on this beam line. Figure 2 shows a typical results that was recorded by a scintillator (on the left-hand side, the plasma was not active, and on the right-hand side, the Gabor plasma lens is active). From the picture, the focus effect of the plasma lens is very obvious: the brightness is about eight times higher and the diameter is about four times smaller when the plasma lens is active than that when plasma lens is not active. A normal micro-channel plate detector could provide us the exact beam intensity, but it cannot bear an intense beam. A fast gated micro-channel plate detector with a scintillator and charge coupled device will be applied in the future.

Fig. 2. (Color online) Ion beam after passing through a Gabor plasma lens (on the left-hand side, the plasma was not active; on the right hand side, the Gabor plasma lens is active).
An experimential setup for research of the interaction of low energy heavy ions with laser produced plasma has been built as well. The laser frequency is 1 HZ and pulse duration is 8 ns. Since the plasma duration time is about 1 µs and the chamber vacuum degree is about 10−7 mbar, the measurement of the projectile charge state distribution after passing through the plasma also inculde the contribution from the background (interaction with the residual gas in the chamber along the transversing path).
Figure 3 shows the preliminary typical results of the charge state distribution after 100 keV O2+ (up) and O5+ (below) ion beams passing through the laser induced plasma (red line), and the background contribution is also presented (black line). It indicates that for projectiles of low charge state, the average charge state increases after passing through the plasma, while the average charge state for highly charged projectiles gets lower. Furthermore, an energy loss of about 0.3–5% of the initial energy was estimated through the shift of the ion beam position. In the future, pulsed ion beams (pulse width <10 ns) will be used for the next experiment and the energy loss will be measured with time-of-flight system instead of position sensitive detector system.
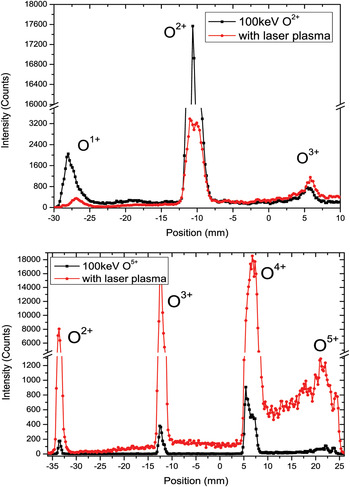
Fig. 3. (Color online) Charge state distribution of O2,5+ ion beam after passing through laser plasma.
2.2. The Gas Discharging Plasma Device
Figure 4 shows the gas discharging plasma device that was made by the Institute of Theory and Experimental Physics. The device will generate plasma by igniting an electric discharge in two collinear quartz tubes, each of 5 mm in diameter and 78 mm long. The capacitor bank of about 3 µF, discharging at voltage up to 5 kV, produces the electrical current flowing in two opposite directions in either of the two quartz tubes. Such a design for the plasma target is able to suppress the accelerating effect caused by the electronic field between the anode and cathodes (Roudskoy, Reference Roudskoy1996). In principle, such plasma device can produce fully ionized hydrogen plasma with free electron density of 1017/cm3, and with temperature of 1–2 eV.

Fig. 4. Principle scheme of the gas discharge plasma device.
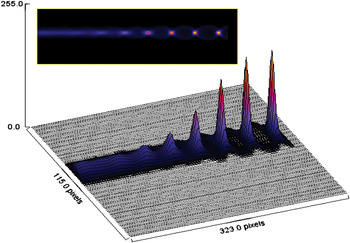
The area electron density has been measured through two-wavelength laser interferometer density diagnostics, which was described in details (Kuznetsov et al., Reference Kuznetsov, Bashutin, Byalkovskii, Vovchenko, Korotkov and Savjolov2008). The typical results of the discharging current and measured area electron density are shown in Figure 5.

Fig. 5. (Color online) Results of discharging current and interferometry measurements of the plasma device.
2.3. Simulations on Energy Loss and Charge State Distribution of Ions in Plasma
As described in Eq. (1), the energy loss of ion in plasma is mainly determined by the effective nuclear charge of the projectile Zeff, and the excitation energy of the plasma wave ћωp. Generally, the effective charge and the Coulomb logarithm are much larger in plasma than that in cold gas, so that an increasing of energy loss was predicted (Hoffmann et al., Reference Hoffmann, Weyrich, Wahl, Gardés, Bimbot and Fleurier1990; Dietrich et al., Reference Dietrich, Hoffmann and Boggasch1992; Jacoby et al., Reference Jacoby, Hoffmann, Laux, Müller, Wahl, Weyrich, Boggasch, Heimrich, Stöckl and Wetzler1995). Figure 6 shows the simulation results with the code from Technical University of Darmstadt that a much higher energy loss of heavy ion in plasma than in cold gas can be expected especially when the energy of the ion beam is very low; meanwhile, the projectile charge state almost keeps as the initial one.

Fig. 6. (Color online) Charge state distribution and energy loss of Ne8+ after passing through fully ionized plasma or gas with the same intensity.
2.4. Transportation: Focused and Pulsed Beams after Passing through the Plasma
A two-dimensional (2D) electrostatic particle-in-cell (PIC) simulation model, which was developed by colleagues from Dalian University of Technology, has been used to investigate the beam transportation and focusing in plasmas. The simulation parameters are according to the experiments discussed above. First, we consider that the plasma is uniformly distributed with electron density of 5 × 10²² m−3 and temperature of 2 eV. The ion beam has a Gaussian distribution in radial direction and is injected continuously into the plasma. Figure 7 shows the time evolution of the ion beam density in the background plasma where proton beam with energy of 200 keV and current of 1 uA are passing though plasma with free electron density of 1016 cm−3.

Fig. 7. (Color online) Formation of focused and pulsed beam after passing through the plasma.
The ion beam is injected from the left side and exits the plasma from the right side. Near the end of plasma device, the compression of ion beam in the radial direction can be clearly observed.
Interesting to note that from Figure 7, the initial continuous beam is seen to be modulated to a pulsed beam near the end of the plasma. The pulse has a period of typically about 1.5 ns with full width at half maximum (FWHM) of about 0.2 ns. However, it needs to be mentioned that, the results in Figure 7 is very preliminary, and the simulation takes the plasma as uniform and stable, which is obviously not the case in a gas discharging plasma. Further simulation will be carried out where plasma revolution will be taken into account.
3. ION BEAM-PLASMA INTERACTIONS UNDER THE INFLUENCES OF MAGNETIC FIELDS (Z. Hu, Y. Song, and Y. Wang)
We review in this work the stopping power and wakefield induced by injection ions in magnetized two-component plasmas in detail, taking into account the polarization effects of plasma ions, the nonlinear effects, and the interference effects between the cluster ions. First, influences of different magnetic fields on the stopping power of single ions in two-component plasmas are studied through linear model using linearized Vlasov-Poisson's equation and nonlinear model using one-dimensional (1D) PIC simulations. Extensions to 2D PIC simulations are performed to show the influences of magnetic field on the structures of wakefield, which show important effects on the energy loss of ions. Furthermore, the interactions of ion clusters (beams) with plasmas are investigated self-consistently to show the interference effects between the cluster ions on the cluster evolution and energy deposition.
The interaction of ions with plasma, including the dynamics of ions moving through plasmas, the subsequent slowing-down process due to the interaction with the background electrons and ions, and the excitation of plasma waves have been studied by a number of authors since the early 1950s (Pines & Bohm, Reference Pines and Bohm1951; Rostoker & Rosenbluth, Reference Rostoker and Rosenbluth1960; Butler & Buckingham, Reference Butler and Buckingham1962). The so-called stopping power and wakefield induced by the ions have been a topic of great interest due to their many applications, such as high-energy-density physics (HEDP) (Hoffmann et al., Reference Hoffmann, Blazevic, Ni, Rosmej, Roth, Tahir, Tauschwitz, Udrea, Varentsov, Weyrich and Maron2005; Ng et al., Reference Ng, Ao, Perror, Dharma-Wardana and Foord2005; Drake, Reference Drake2006), ICF driven by ion beams (Keefe, Reference Keefe1982; Deutsch, Reference Deutsch1986; Peter & Meyer-ter-Vehn, Reference Peter and Meyer-Ter-Vehn1991a), plasma heating by neutral beam injections (Stix, Reference Stix1972; Spetch, Reference Spetch1989; Thompson et al., Reference Thompson, Stork and de Esch1993), and plasma accelerations (Chen et al., Reference Chen, Dawson, Huff and Katsouleas1985). The magnetic fields, external exerted as in magnetized confined fusion plasmas and astrophysics, or self-produced as in beam- or laser-plasma interactions, play an important role in the interaction process between the ions and plasmas. The interaction process between the ions and plasmas is usually characterized with the ion-plasma coupling strength Z = (Z p/N D), where Z p is the charge of the ion and N D is the number of electrons in a Debye sphere. For weak ion-plasma coupling Z≪1, the well-known linearized theories, such as the dielectric theory and binary collision theory (Peter & Meyer-ter-Vehn, Reference Peter and Meyer-Ter-Vehn1991a; Nersisyan, Reference Nersisyan1998; Nersisyan & Deutsch, Reference Nersisyan and Deutsch1998; Cereceda et al., Reference Cereceda, Deutsch, Peretti, Sabatier and Nersisyan2000; Nersisyan et al., Reference Nersisyan, Zwicknagel and Toepffer2003; Hu et al., Reference Hu, Song and Wang2009a), are commonly adopted. For strong ion-plasma coupling Z ≥ 1, the standard linearized theories fail. In this region, numerical methods, such as PIC (Zwicknagel et al., Reference Zwicknagel, Toepffer and Reinhard1999; Hu et al., Reference Hu, Song, Wang and Wang2009b), molecular-dynamics (Zwicknagel et al., Reference Zwicknagel, Toepffer and Reinhard1999; D'Avanzo et al., Reference D'avanzo, Hofmann and Lontano1998), and Vlasov simulations (Gericke & Schlanges, Reference Gericke and Schlanges1999), are usually employed to study the influences of nonlinear effects on the interaction process.
Through the linearized theory, an adequate analytic model for the stopping power in the case of extreme magnetization was presented (Nersisyan, Reference Nersisyan1998; Nersisyan & Deutsch, Reference Nersisyan and Deutsch1998; Cereceda et al., Reference Cereceda, Deutsch, Peretti, Sabatier and Nersisyan2000), in which the “friction law” with S ∝ u 2 (where S is the energy loss rate and u is the particle velocity) is obtained in contrast to the linear velocity dependence without magnetic fields. In the subsequent work (Cereceda et al., Reference Cereceda, Peretti and Deutsch2005), the stopping power is calculated for arbitrary angles between particle velocity and magnetic field, and a strong decrease is found of the energy loss has been found as the angle varies from 0 to π/2. As indicated by Hu et al. (Reference Hu, Song and Wang2009a), the dynamic polarization effects of plasma ions are considered and found to show significant contributions to the ion stopping power in the case of low ion velocity and strong magnetic field. The results can show some helpful references to the related experiments with strong magnetic fields, such as in magnetically confined plasmas. Furthermore, the influences of finite Larmor radius on the wakefield and stopping power by proton projectile in magnetized two-component are investigated (Wang et al., Reference Wang, Song and Wang2000). It is shown that finite Larmor radius lessens wake effects and stopping power essentially through excitation of collective plasma electron modes. On the other hand, the quantum mechanical treatment of the energy loss in magnetized plasma was performed in the limit of high and low particle velocities, and the magnetic field is found to reduce the stopping power at high particle velocities, while enhance the stopping power at low particle velocities (Steinberg & Ortner, Reference Steinberg and Ortner2001).
For strong ion-plasma coupling (Z ≥ 1), the linearized theories fail. For a heavy, highly charged ion traveling through anisotropic magnetized electron plasma, PIC simulations show that the magnetic field has a significant effect on the stopping power (Walter et al., Reference Walter, Toepffer and Zwicknagel1998, Reference Walter, Toepffer and Zwicknagel2000). At low ion velocities the stopping power is found to increase with the increasing magnetic field provided that the angle between the ion velocity and magnetic field is not equal to 0°, while at high ion velocities the influence of the magnetic field is negligible and the stopping power agrees with the linear dielectric theory in general. In nonlinear regions, the scaling of the stopping power is close to a Z p3/2 law (Zwicknagel et al., Reference Zwicknagel, Toepffer and Reinhard1999), which is found to be the characteristic for the nonlinear stopping power. This change in scaling is partly due to the nonlinear shielding, which increases with the coupling strength. The dynamic polarization effects of plasma ions on the nonlinear stopping power are also investigated through the PIC simulations (Hu et al., Reference Hu, Song, Wang and Wang2009b) and compared with the linear theory. The significant contributions of plasma ions to the stopping power in nonlinear regions are also found in the case of low ion velocity and strong magnetic fields. Though comparisons with linear theory, the nonlinear effects are found to enhance the stopping power in low velocity regions. Furthermore, for strong ion-plasma coupling, the magnetic fields are shown to have significant influences on the wake fields induced by the ions (Hu et al., Reference Hu, Song and Wang2010).
To our knowledge, most theoretical studies on the energy loss in magnetized plasmas have used the common assumptions that the test particle travels in the electron plasmas with fixed ion background, and this assumption is justified if the ratio between test particle velocity and plasma electron thermal velocity  $\displaystyle{{{\rm u}}\over{{\rm V}_{\rm Te}}} \gt \left(\displaystyle{{{\rm m}_{\rm e}} \over {{\rm m}_{\rm i}}}\right)^{{{1}\over{3}}}$ (where m e is the mass of the electron and m i is the mass of the plasma ion) as discussed by Butler and Buckingham (Reference Butler and Buckingham1962). Here, we review the stopping power and wakefield induced by ions in magnetized two-component plasmas in detail, including the polarization effects of plasma ions, the nonlinear effects, and the interference effects between the ions. The effective charge Z p of the ion is assumed to be constant throughout the work.
3.1. Linear Model for the Interactions between the Ions and Plasmas
First, the interactions of single ions with magnetized two-component plasmas are investigated within the framework of the linearized Vlasov-Poisson theory, taking into account the dynamic polarization effects of both the plasma ions and electrons (Hu et al., Reference Hu, Song and Wang2009a). As indicated by Spetch (Reference Spetch1989), for the beam energy higher than a critical energy W c, the energy of the beam is lost predominantly to electrons. As the beam energy approaches W c, energy loss to ions becomes important. Thus, one expects that for low ion velocity and strong magnetic field, the dynamic polarization of ions may exert a considerable influence on the stopping power.
Detailed information about the solution of Vlasov-Poisson equation and the dielectric function of the plasma can be found in Hu et al. (Reference Hu, Song and Wang2009a) and references therein. By means of the space-time Fourier transforms, the potential in the plasma due to the injection of ions can be obtained by integrating along the unperturbed trajectory,
 $${\rm \phi}\lpar {\rm r}\comma \; {\rm t}\rpar = \displaystyle{{Z_1 e}\over{{\rm \varepsilon}_0 \lpar 2{\rm \pi}\rpar ^3}} \int d{\rm k} \displaystyle{{\exp\lsqb i{\rm k} \cdot \lpar {\rm r} - {\rm u}t\rpar \rsqb }\over{k^2 {\rm \varepsilon}\lpar {\rm k}\comma \; {\rm k} \cdot {\rm u}\rpar }}.$$
Here, ɛ(k, ω) is the dielectric function of the homogeneous two-component plasma, which has been given by Ichimaru (Reference Ichimaru1973). In Figure 8, we show the influences of different magnetic fields on the potential ϕ for protons traveling parallel to the magnetic field. One may notice from the figure that, for low particle velocity u/v Ti = 3.01, as the magnetic field increases, the magnitude of the wake potential increases significantly due to the stronger polarization of the medium.

Fig. 8. The potential ϕ along the z-axis as a function of the distance  $\displaystyle{{z - z_d} \over {{\rm \lambda}_{De}}}$ for different values of magnetic field with fixed particle velocity. Here, ϕ0 = 0 for the case of u‖B0, zd = ut is the position of the test particle, and
  ${\rm \phi}_0 = \displaystyle{{e} \over {{\rm \varepsilon}_0 {\rm \lambda}_{De}}}$.
The stopping power of the test particle S is defined as the energy loss of the particle per unit length due to the plasma polarization,
 $${\rm S} = \displaystyle{{\lpar Z_1 e\rpar ^2}\over{{\rm \varepsilon}_0 \lpar 2{\rm \pi}\rpar ^3}} \int \displaystyle{{d^3 k}\over{k^2}} \displaystyle{{{\rm k} \cdot {\rm u}}\over{u}} {\rm Im} \left\{\displaystyle{{-1} \over {{\rm \varepsilon}\lpar {\rm k}\comma \; {\rm k} \cdot {\rm u}\rpar }}\right\}.$$
 In Figure 9, we show the influence of magnetic field on the stopping power as a function of the proton velocity  $\displaystyle{{u}\over{V_{Ti}}}$, with the angle between the proton velocity and the magnetic field
  ${\rm \theta}_0 = \displaystyle{{{\rm \pi}}\over{6}}$. The other parameters are as follows: the plasma density, n 0 = 1018 m−3; the unperturbed densities of plasma electrons and plasma ions, n eo = n io = 1018 m−3; the ion temperature, T i = 500 keV; the electron temperature, T e = 1 keV. Here, a hydrogen plasma is considered with the plasma ion charge q i = e and the mass ratio
  $\displaystyle{{m_i}\over{m_e}} = 1836$. Also, the protons with charge Z p = 1 and mass m p = 1836m e are taken to the injection ions. Both Figures 9a and 9b show that the stopping power has two maximum values, with one located near the thermal velocity of plasma ions V Ti corresponding to the collective excitation of plasma ions, and with the other one near the thermal velocity of plasma electrons V Te with respect to the collective excitation of plasma electrons. From the low particle velocity regions
  $\displaystyle{{u}\over{V_{Te}}} \lt 1$, it is easily seen that the test proton is exposed to more stopping significantly from the plasma ions with the increasing magnetic field. However, from the region of high particle velocities
  $\displaystyle{{u}\over{V_{Te}}} \gt 1$, we notice that the magnetic field also enhances the stopping power for the case of weak magnetic field
  $\displaystyle{{{\rm \omega}_{ce}}\over{{\rm \omega}_{\,pe}}} \lt 1$, but only makes the electron stopping profiles shift to lower velocities region for the case of strong magnetic field
  $\displaystyle{{{\rm \omega}_{ce}}\over{{\rm \omega}_{\,pe}}} \gt 1$. As we all know, the motion of the electrons transverse to the magnetic field becomes increasingly restricted with the increase of strong magnetic field. On the contrary, the dynamic polarization of the plasma ions becomes more active, leading to the increasing energy transfer from the test ion to the plasma ions. These results suggest that: in the presence of weak magnetic field, the energy losses of the incident ions with low velocities is smaller than those with high velocities; while under the strong magnetic field, the ions with low velocities play an important role in the energy exchange with plasmas. Further information about the influences of different angles between the ion velocity and the magnetic field, and certain plasma parameters on the stopping power can be found in Hu et al. (2009).

Fig. 9. Influences of (a) weak magnetic fields with  $\displaystyle{{{\rm \omega}_{ce}} \over {{\rm \omega}_{\,pe}}} \lt 1$, (b) strong magnetic fields with
  $\displaystyle{{{\rm \omega}_{ce}} \over {{\rm \omega}_{\,pe}}} \gt 1$ on the stopping power of protons as a function of the proton velocity u. Here, the plasma density n 0 = 1018 m−3, the electron temperature T e = 1 keV, the ion temperature T i = 5 keV, and
  ${\rm \theta}_0 = \displaystyle{{{\rm \pi}} \over {6}}$.
3.2. Nonlinear Model for the Interactions between the Ions and Plasmas
In the strong coupling regimes with coupling parameter  $\displaystyle{{Z_{\rm p}}\over{N_D}} \gt 1$, the standard linearized theories fail. In such regimes, nonlinear contributions to the stopping power are required to be considered. We perform 1D PIC simulations (Hu et al., Reference Hu, Song, Wang and Wang2009b) to investigate the nonlinear stopping power of charged particles in magnetized two-component plasmas. In the presence of magnetic field, special emphasis is placed on the influences of nonlinear effects on the stopping power at low particle velocities. The dynamic polarization effects of plasma ions on the nonlinear stopping power are also our concern. For a two-component plasma, we have two parameters,
  ${\rm \beta}_e = \displaystyle{{Z_p}\over{n_0 {\rm \lambda}_{De}^3}}$ and
  ${\rm \beta}_i = \displaystyle{{Z_p}\over{n_0 {\rm \lambda}_{Di}^3}}$, characterizing, respectively, the coupling strength between the test particle and the plasma electrons and the plasma ions. We show in Figure 10 the influences of the magnetic field on the nonlinear stopping power as a function of the projectile velocity
  $\displaystyle{{u}\over{V_{Ti}}}$, with the coupling parameters βe = 1.0, βi = 2.8 and the angle between the ion velocity and magnetic field
  ${\rm \theta}_0 = \displaystyle{{{\rm \pi}}\over{6}}$. Here the stopping power is normalized in units of
  $S_0 = \displaystyle{{\lpar Z_p e\rpar ^2}\over{4 {\rm \pi}^2 {\rm \varepsilon}_0 {\rm \lambda}_{De}^2}}$. As one can see, the contributions from plasma ions to the stopping power in the low velocity regimes increase significantly with the increasing magnetic field. Especially as indicated in Figure 10b, the stopping power in the low velocity regimes has exceeded that in the high velocity regimes with the magnetic field B0 = 5.0 T, indicating that the charged particles with low velocities become important in the energy exchange with plasmas in the presence of strong magnetic field, show accordance with the linear results discussed in the last section. In high projectile velocity regions, the increasing magnetic fields enhance the nonlinear stopping power for weak magnetic fields, while for strong magnetic fields the influences are negligible. As one can expect, with the increasing magnetic fields, the motion of plasma electrons transverse to the magnetic field becomes increasingly restricted, while the dynamic polarization effects of plasma ions become more active. Our results show agreement with the PIC simulation results given by Walter et al. (Reference Walter, Toepffer and Zwicknagel2000), in which the stopping power is found to increase with increasing magnetic field at low relative velocities, while at high relative velocities the influence of the magnetic field is negligible for the ion moving perpendicular to the magnetic field. Here the authors focus on the magnetized electron plasma, in which the plasma ions are considered as the fixed positive background.

Fig. 10. (Color online) Influences of (a) weak magnetic fields and (b) strong magnetic fields on the nonlinear stopping power in units of  $S_0 = \displaystyle{{\lpar Z_p e\rpar ^2} \over {4{\rm \pi}^2 {\rm \varepsilon}_0 {\rm \lambda}_{De}^2}}$, as a function of the ion velocity u. Here, the coupling parameters βe = 1.0, βi = 2.8, and the angle
  ${\rm \theta}_0 = \displaystyle{{{\rm \pi}} \over {6}}$.
In order to show the nonlinear effects on the stopping power, we now compare the stopping power obtained from the PIC simulations with those obtained from the linear dielectric theory in the last section. We show in Figure 11 the comparisons for different magnetic fields. All displayed data exhibit two characteristic peaks, corresponding to the ion stopping and electron stopping. One can clearly see from this figure that the nonlinear effects enhance the stopping power in low velocity regions  $\displaystyle{{u}\over{V_{Te}}} \lt 1$, while in high velocity regions
  $\displaystyle{{u}\over{V_{Te}}} \gt 1$ the influences are negligible. As one can see, in low projectile velocity regions, where the projectile can interact strongly with plasma electrons and ions, the effects of nonlinearity are expected to be the largest. Whereas, in high projectile velocity regions, the perturbation caused by the projectile is weak and the linear dielectric theory applies. Thus, the agreement between the PIC simulations and the linear dielectric theory in high velocity regions can be expected. Another feature of the nonlinear stopping power is the obvious shifts of the ion stopping peaks to higher velocity regions due to the nonlinear effects as indicated in both Figures 11a and 11b. Finally, we want to note that the significant enhancement of the ion stopping with the increasing magnetic fields, which is the major result of both the PIC simulations and the linear dielectric theory, can be clearly observed in this figure. Further information about the influences of different angles between the ion velocity and the magnetic field, and plasma parameters on the nonlinear stopping power can be found in Hu et al. (Reference Hu, Song, Wang and Wang2009b).

Fig. 11. (Color online) Comparisons of the stopping power in units of  $S_0 = \displaystyle{{\lpar Z_p e\rpar ^2} \over {4{\rm \pi}^2 {\rm \varepsilon}_0 {\rm \lambda}_{De}^2}}$ between the PIC and the LDT for (a) weak magnetic field and (b) strong magnetic field. Here, the coupling parameters βe = 1.0, βi = 2.8, and the angle
  ${\rm \theta}_0 = \displaystyle{{{\rm \pi}} \over {6}}$.
The structure of the wakefield induced by the charged particles is important in many applications, such as plasma wakefield accelerator (Chen et al., Reference Chen, Dawson, Huff and Katsouleas1985) and the stopping of ion-clusters in plasmas (D'Avanzo et al., Reference D'avanzo, Lontano and Bortignon1992). As far as we know, there are few investigations on the influences of the external magnetic field on the wakefield in the strong ion-plasma coupling case. To the above 1D work, we investigate the influences of the magnetic field on the wakefield by using the 2D PIC simulations (Hu et al., Reference Hu, Song and Wang2010), taking into account the dynamic polarization effects of both plasma ions and electrons.
In our numerical calculations, the coupling parameters βe = 1.0, βi = 2.8, the ion charge Z p = 5 are kept fixed, and the speed of the projectile u and the external magnetic field B are treated as variable parameters. Again, hydrogen plasma with mass ratio  $\displaystyle{{m_i}\over{m_e}} = 1836$ and ion charge q i = e is considered. In addition, the temperature ratio of ion to electron is assumed to be 0.5 (
 $\displaystyle{{T_i}\over{T_e}} = 0.5$). In the simulation, a boron ion of charge Z p = 5 and mass m p = 10m i is taken to be the test particle. The intensity of the magnetic field B is expressed in terms of
  ${\rm \eta} = \displaystyle{{{\rm \omega}_{ce}}\over{{\rm \omega}_{\,pe}}}$, where
  ${\rm \omega}_{\,pe} = \displaystyle{{eB_0}\over{m_{e}}}$ is the cyclotron frequency and
  ${\rm \omega}_{\,pe} = \left(\displaystyle{{n_0 e^2}\over{{\rm \epsilon}_0 m_0}}\right)^{{{1}\over{2}}}$ the plasma frequency. We have η < 1 for weak magnetic fields and η ≥ 1 for strong magnetic fields. In the 2D particle simulation, all charged particles are considered to move in the x-y plane. Only the case of a test particle moving perpendicular to the external magnetic field is considered.
We show in Figure 12 the influence of different magnetic fields on the induced potential ϕind $\displaystyle\Big(\rm normalized\; by {{k_B T_e}\over{e}}\Big)$ with the ion velocity
  $\displaystyle{{u}\over{V_{Ti}}} = 75$. For the figure, one can see that, for weak magnetic field shown in Figure 12a, the wakefield exhibits the typical V-shaped cone structures, which has close relations to the ion velocity as discussed in Hu et al. (Reference Hu, Song and Wang2010). As the magnetic field increases, the wake profiles become highly asymmetrical and lose their typical V-shaped cone structures. As we all know, under the influences of the strong magnetic field, the test ion may experience much greater Lorentz force and leave their original motion trajectory. Thus, as the test ion travels through the plasma, one can expect the asymmetry in the wake potential induced behind the ion. Besides, with the increasing magnetic field, the magnitude of the wake potential increases and the perturbed regions become smaller, as shown in Figures 12c and 12d. In our opinion, the motion of the plasma electrons is increasingly restricted under the influences of stronger magnetic field. In this case, the electrons cannot respond thoroughly to the disturbance from the intrusive ion, resulting in the reduction of the wake region. Also, we can observe these features from the maps of the perturbed density n e1 of plasma electrons, as shown in Figure 13. The asymmetry of the perturbed density and velocity field can be easily seen, especially from Figure 13d.

Fig. 12. (Color online) Influences of different magnetic fields on the induced potential ϕind $\displaystyle\Big({\rm normalized\; by} {{k_B T_e} \over {e}}\Big)$, with the ion velocity
  $\displaystyle{{u} \over {V_{Ti}}} = 75$.

Fig. 13. (Color online) Influences of different magnetic fields on the perturbed density of plasma electrons n e1 (normalized by n e0) for the same parameters as in Figure 12.
We also calculate the stopping power of ions in our 2D PIC simulations and compare these with the results of our previous 1D work. In the simulations, the energy loss ΔE and the traveled path Δs of the test particle are calculated at each time step, resulting in an instantaneous stopping power (ΔE/Δs)(t). The stopping power is finally obtained as the time average <ΔE/Δs> over the instantaneous ΔE/Δs.
We show in Figure 14 the influences of the weak and strong magnetic fields on the nonlinear stopping power as a function of the projectile velocity  $\displaystyle{{u}\over{V_{Ti}}}$. Here the stopping power is normalized in units of
  $S_0 = \displaystyle{{\lpar Z_p e\rpar ^2}\over{4 {\rm \pi}^2 {\rm \varepsilon}_0 {\rm \lambda}_{De}^2}}$. Similar to our 1D model, two characteristic peaks corresponding to the ion stopping in low velocity region and the electron stopping in high velocity region are displayed. Also, one can clearly see the significant enhancement of the stopping power with increasing magnetic field, at high ion velocity region due to the strong dynamic polarization of plasma electrons in Figure 14a, and also at the low ion velocity region due to the plasma ion excitation in Figure 14b.

Fig. 14. (Color online) Influences of the weak and strong magnetic field on the nonlinear stopping power in units of  $S_0 = \displaystyle{{\lpar Z_p e\rpar ^2} \over {4{\rm \pi}^2 {\rm \varepsilon}_0 {\rm \lambda}_{De}^2}}$, as a function of the projectile velocity
  $\displaystyle{{u} \over {V_{Ti}}}$.
The comparison of the stopping power between the one- and 2D models are made in Figure 15 with the weak η = 0.1 and strong magnetic field η = 5, respectively. In the case of strong magnetic field in Figure 15b, one can find that, at the high ion velocity region the two simulations for the electron stopping show agreement with each other, while at the low ion velocity region, the peak of ion stopping in 2D model moves to higher velocity region, relative to former 1D results. Nevertheless, for weak magnetic fields, a reversed behavior can be observed. By adopting the 2D PIC simulation model in this work, we can obtain the highly asymmetrical results for both the induced potential and the velocity field in x- and y-direction, as shown in the last section. Thus, one can expect that the differences of the simulation results between the two models are due to the action of the magnetic field on the plasma ions and electrons at their sensitive velocity region, in a 2D fashion.

Fig. 15. (Color online) Comparisons of the stopping power  $\Big(\rm in\; units\; of \;S_0 = \displaystyle{{\lpar Z_p e\rpar ^2} \over {4{\rm \pi}^2 {\rm \varepsilon}_0 {\rm \lambda}_{De}^2}}\Big)$ between 1D and 2D PIC simulations in the case of weak η = 0.1 and strong magnetic field η = 5. Here, the lines with filled squares are the results of 1D model, the lines with filled circles of 2D model.
Furthermore, simulation results are compared with the full three-dimensional (3D) PIC results, presented in Zwicknagel (Reference Zwicknagel2002), in order to show the differences between the present 2D and the real 3D model. We first calculate the normalized stopping power  $\displaystyle{{\displaystyle{{dE}\over{ds}}}\over{\left(Z_p \Gamma^{{{3}\over{2}}}\right)^2}}$ in units of
  $\displaystyle{{{\sqrt{3}} k_B T_e}\over{\Gamma^{{{3}\over{2}}}{\rm \lambda}_{De}}}$ as function of ion velocity
  $\displaystyle{{u}\over{V_{Te}}}$ in Figure 16 for vanishing magnetic field and one-component plasma, as indicated in Figure 9 in Zwicknagel (Reference Zwicknagel2002). Here, the coupling parameter
  $Z_p \Gamma^{{{3}\over{2}}} = \displaystyle{{Z_p e^2 {\rm \omega}_{\,pe}}\over{4{\rm \pi}{\sqrt 3} k_B T_e V_{Te}}} = 1.1$ and the 3D results are corrected for the finite simulation box. One can see from this figure that the overall difference is small, although some reduction of the stopping power in high ion velocity regions can be found in the present 2D model. As one can see in high ion velocity regions plasma waves are greatly excited by the test ion and the wake effects induced behind the ion are expected to be obvious. Thus, some differences can be expected due to certain missing information about the wake fields and plasma waves along the z-direction in the present 2D model, in which the particle trajectory in z-direction cannot be tracked. Further information about the influences of different ion injection velocities on the wake field can be found in Hu et al. (Reference Hu, Song and Wang2010).

Fig. 16. (Color online) Comparisons of the normalized stopping power  $\displaystyle{\displaystyle{{dE} \over {ds}} \over {\lpar Z_p \Gamma^{{3\over 2}}\rpar ^2}}$ in units of
  $\displaystyle{{{\sqrt{3}} k_B T_e} \over {\Gamma^{{3 \over 2}} {\rm \lambda}_{\hbox{De}}}}$ as function of ion velocity
  $\displaystyle{{u} \over {V_{Te}}}$ between 2D and full 3D PIC model. Here, the coupling parameter
  $Z_p \Gamma^{{3} \over {2}} = {\displaystyle{Z_p e^2 {\rm \omega}_{\,pe}} \over {4{\rm \pi} {\sqrt{3}}k_B T_e V_{Te}}} = 1.1$ and the 3D results are corrected for the finite simulation box, as indicated in Zwicknagel (Reference Zwicknagel2002). The filled squares are the results of full 3D model, the filled circles of 2D model.
3.3. The Interference Effects between the Cluster Ions on the Cluster Energy Deposition
For intense ion beams or large ion clusters, as usually used for plasma heating in magnetic confinement fusion plasmas and heavy-ion driven fusions, the influences of interactions between the cluster ions should be taken into consideration (Deutsch, Reference Deutsch1990; D'Avanzo et al., Reference D'avanzo, Lontano and Bortignon1992; Deutsch & Fromy, Reference Deutsch and Fromy1995; Bringa & Arista, Reference Bringa and Arista1995; Arista & Bringa, Reference Arista and Bringa1997; Hu et al., Reference Hu, Song and Wang2012). The interference effects, which are produced by the dynamical vicinage interactions between beam particles, on the energy loss of ion beams or ion clusters are studied in detail through the dielectric theory (Bringa & Arista, Reference Bringa and Arista1995). A strong enhancement in the energy loss of ion beam is obtained for intermediate beam or cluster size. Furthermore, scaling laws are provided for the ion beam energy loss in the interaction of intense ion beams or large ion clusters with fusion plasmas.
In addition to the interference effects between the cluster ions, the strong magnetic fields also have significant effects on the beam-plasma interactions process. As one can expect, in the case of strong magnetic field, the wakefield excited by foregoing particles is highly asymmetrical due to the strong Lorentz force by the magnetic field. This asymmetrical wakefield may show significant effects on the energy deposition of incoming particles. To our knowledge, there are few investigations on the influences of the strong magnetic fields on the interaction process. Also, to fully understand the interaction process, a self-consistent model is needed. We thus perform the self-consistent 2D PIC simulations to investigate the time evolution and energy deposition of ion clusters injected into magnetized two-component plasmas (Hu et al., Reference Hu, Song and Wang2012). The influences of different magnetic fields on the cluster evolution and energy deposition are investigated in detail.
Note that we are here mainly concerned with the influence of magnetic field on the structure evolution of the ion cluster traveling in the magnetized plasma, not only the Larmor radius and the diffusion of charged particles. And the structure of the ion cluster has close relations to the Coulomb force between the cluster ions, the dynamic polarization of background plasma, which is provided to shield the cluster ions and slow down the Coulomb explosions, and the external magnetic field. We first show in Figure 17 the time evolution of an isolated ion cluster injected into a magnetized plasma with strong magnetic field B0 = 5 T  $\displaystyle\Big({{{\rm \omega}_{ce}}\over{{\rm \omega}_{\,pe}}} \gt 1$, here
  ${\rm \omega}_{ce} = \displaystyle{{eB_{0}}\over{m_{e}}}$ is the cyclotron frequency of plasma electrons), injection angle θ = 18° and injection velocity V b = 0.4V Te. The ion cluster, which contains about 1.65 × 10¹⁴ ions actually, has a Gaussian shape with the length l c = 3r c = 45λDe and a density of n c = 0.3n 0. In the figure, the densities of the ion cluster (in units of m−3) at three different points in time after injection are displayed. Due to the big differences in the magnitude of cluster density at three different times, the logarithm scale for the cluster density is displayed in the figure. For the strong magnetic field, the injected ions are seen confined very well in the direction perpendicular to the magnetic field and mainly diffuse along the direction of magnetic field lines, as shown in the bottom of Figure 17. Besides, the travel direction of the ion cluster changes from the initial injection direction to the later direction of the magnetic field lines.
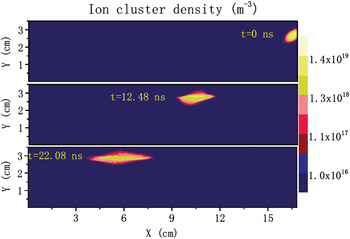
Fig. 17. (Color online) The time evolution of an isolated ion cluster injected into a magnetized plasma with strong magnetic field B0 = 5 T  $\displaystyle\Big({{{\rm \omega}_{ce}} \over {{\rm \omega}_{\,pe}}} \gt 1$, here
  ${\rm \omega}_{ce} = \displaystyle{{eB_0} \over {m_e}}$ is the cyclotron frequency of plasma electrons), injection angle θ = 18° and injection velocity V b = 0.4V Te. The cluster densities (in units of m−3) at three different points in time are displayed in the figure. Due to the big differences in the magnitude of cluster density at three different times, the logarithm scale for the cluster density is displayed in the figure.
We further show in Figure 18 the time evolution of the ion cluster in the case of weak magnetic field B0 = 1 T  $\displaystyle\Big({{{\rm \omega}_{ce}}\over{{\rm \omega}_{\,pe}}} \lt 1\Big)$ with other parameters being the same as Figure 17. Also, the ion cluster densities (in units of m−3), displayed in the logarithm scale, at three different points in time are shown in the figure. For weak magnetic field, one can see the diffusions of cluster ions along and perpendicular to the magnetic field as the ion cluster penetrates further into the plasma. Due to the Coulomb repulsions between the ions, the density of the ion cluster decreases and the distances between the ions increase gradually. For this reason, the energy transferred from the cluster to the plasma decreases as the cluster travels gradually into the plasma. This can be clearly seen from the corresponding distribution profile of beam energy deposition as shown in Figure 19, which will be explained in detail in the following.

Fig. 18. (Color online) The time evolution of an isolated ion cluster injected into a magnetized plasma with weak magnetic field B0 = 1 T  $\displaystyle\Big({{{\rm \omega}_{ce}} \over {{\rm \omega}_{\,pe}}} \lt 1\Big)$, with other parameters the same as in Figure 17.

Fig. 19. (Color online) The influences of weak and strong magnetic fields on the distribution profile of cluster energy deposition (in units of MeV/cm2) at time intervals t = 22.08 ns after injection. The other parameters are the same as those used in Figures 17 and 18.
For particle simulation, we keep track of the position and velocity of cluster ions at every time step. Thus, detailed information about the energy transferred from the cluster ions to the plasma can be obtained. We thus show in Figure 19 the corresponding distribution profile of cluster energy deposition (in units of MeV/cm2 for the present 2D model) at time intervals t = 22.08 ns after the injection in the case of weak and strong magnetic fields. The parameters of the plasma and cluster are the same as those in Figures 17 and 18. As shown in Figure 19a with strong magnetic field B0 = 5 T, the range of cluster ions depositing their energy in the direction perpendicular to the magnetic field is seen to be strongly restricted, due to the strong confinement by the magnetic field. In addition, one can observe the oscillations in the profile of cluster energy deposition. Due to the initial injection angle between the injection velocity and the magnetic field, the cluster has a Larmor radius r L ≈ V ⊥/ωce in the y-direction while traveling with the speed V // in the x-direction at the same time. Here, V ⊥ and V // are the velocities of cluster that perpendicular and parallel to the magnetic field, respectively. For this reason, one thus can observe the oscillations in the energy deposition profile.
In contrast to the strong magnetic field case, the significant increase in the range of cluster energy deposition can be clearly observed in the weak magnetic field case, due to rapid diffusion of the cluster ions. Also, a large amount of beam energy is found to be deposited near the initial cluster injection position, where the cluster density is expected to be largest. As the ion cluster travels gradually into the plasma, the energy transferred to the plasma decreases rapidly due to the Coulomb repulsion between the ions in the cluster, as explained in Figure 18. Through the comparisons between the weak and strong magnetic field case, one can clearly find that as the magnetic field increases, the ions tend to deposit their energy smoothly along the trajectory of the cluster, as shown in Figure 19a. For strong magnetic field, the distances between the ions of injected cluster increase very slowly due to the well confinement of the magnetic field. However, for the weak magnetic field case, the distances between the cluster ions increase rapidly. The influences of interference effects, which have close relation to the distances between the ions (D'Avanzo et al., Reference D'avanzo, Lontano and Bortignon1992), on the cluster energy deposition decrease rapidly due to this significant increase in the distances. Thus, a rapid decrease and a smooth varying in the energy deposition of weak and strong magnetic fields case, respectively, can be observed in the figure.
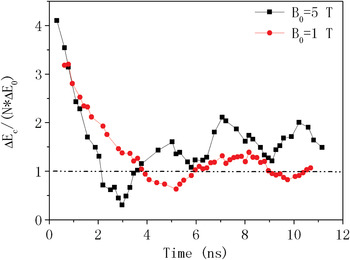
To fully understand the energy deposition profile, as shown in Figure 19, we further investigate in detail the interference effects on the time evolution of cluster energy loss, which is an important quantity for describing the interactions of clusters with the plasma. To clearly show the interference effects, the cluster energy loss, which is calculated through the averaging over clusters of different sizes (different r c and l c), is compared with that of single ions in the case of weak and strong magnetic fields, as shown in Figure 20. In the figure, the cluster energy loss ΔE c(t) is normalized by N × ΔE 0, where N is the number of ions in the cluster and ΔE 0 is the energy loss of single ions. From the figure, one can see that the energy loss of the cluster is strongly enhanced compared to that of single ions during the initial cluster travel time (about 2 ns) and then shows oscillations near the value of single ions. However, after 4 ns, the cluster energy loss in the strong magnetic field case exceeds that in the weak magnetic field case. From the whole time evolution profile, one thus can expect the rapid decrease in the energy deposition profile of weak magnetic field case, as already shown in Figure 19. As the cluster ions diffuse in the plasma and the distances between the ions increase, the energy loss of the cluster approaches that of single ions gradually as the time increases. Also, as the magnetic field increases, the time that needed for the cluster energy loss approaching that of single ions increases, as shown in the figure. Further information about the influences of different injection angles and injection velocities on the energy deposition of ion clusters and beam pulses can be found in Hu et al. (Reference Hu, Song and Wang2012).

Fig. 20. (Color online) The influences of weak and strong magnetic fields on the time evolution of cluster energy loss ΔE c(t), which is calculated through the averaging over clusters of different sizes (different r c and l c). For comparison, the energy loss of the cluster ΔE c(t) is normalized by N * ΔE 0, where N is the number of ions in the cluster and ΔE 0 is the energy loss of single ions.
In conclusion, we have first studied the interaction of single ions with plasmas through the linearized theory and 1D PIC model lately to show the nonlinear effects. Simulation results show that, under the influences of a strong magnetic field, the dynamic polarization effects of plasma ions become more obvious and the ion stopping contributes mainly to the energy losses of the incident particle with low velocities  $\displaystyle{{u}\over{V_{Te}}} \lt 1$. On the other hand, the plasma electrons stopping the particle with high velocity
  $\displaystyle{{u}\over{V_{Te}}} \gt 1$ becomes dominant in the presence of weak magnetic effects. Our results indicate that the ion stopping becomes important to the slowing-down process of the beam with the strong magnetic field applied in the plasma. For 1D nonlinear PIC simulations, the results are in good agreement with the conclusions obtained with the linear theory, in which the ion stopping is found to be important for low particle velocity and strong magnetic fields. Comparisons between the PIC simulations and the linear theory are made and enhanced stopping power due to the nonlinear effects can be observed in the low particle velocity regions. Furthermore, the 2D PIC simulations are performed to investigate the wakefield and stopping power of ions. For relatively high ion velocity and weak magnetic field, our simulation results show that the wakefield excited by moving ions exhibit typical V-shaped cone structures and the opening cone angles decrease as the ion velocity increases. As the magnetic field increases, the wake tails lose their V-shaped structures gradually and become highly asymmetrical.
In addition to the single ions, we also have considered the influences of magnetic fields on the interaction process between the ion clusters (or beams) and the plasma in a self-consistent way through PIC simulations. The influences of weak and strong magnetic fields on the time evolution of an isolated ion cluster are investigated. The cluster ions tend to deposit their energy smoothly along the trajectory of the cluster due to the well confinement by the strong magnetic fields. However, for weak magnetic field case, a large amount of energy is deposited by the cluster ions near the initial injection position, where the cluster density is expected to be largest. We attribute these to the influences of interference effects between the cluster ions, which have close relations to the distances between the ions. In the weak magnetic field case, the distances between the cluster ions increase rapidly due to the Coulomb repulsions. To fully understand the energy deposition profile, the interference effects on the time evolution of cluster energy loss are investigated in detail for weak and strong magnetic field cases. Comparing to that of single ions, the cluster energy loss is strongly enhanced during the initial travel time and then shows oscillations near the value of single ions.
We believe that the results obtained will provide a helpful reference to the experiments relative to ICF driven by ion beams and heating of fusion plasmas. For example, the conclusions about the influences of interference effect between the cluster ions on the energy deposition, which is an important quality for plasma fusion, can provide some insights into the beam-plasma interactions in inertially fusion plasmas. Also, the importance of plasma ion dynamics in the presence of strong magnetic fields may provide a helpful reference to the related experiments. Our further attention will concentrate on a real 3D and complicated plasma model in the presence of external magnetic fields.
4. HIGH ENERGY HEAVY ION RADIOGRAPHY THROUGH MARGINAL RANGE METHOD (R. Cheng, Y. Zhao, X. Zhou, Y. Sun, Y. Lei, X. Wang, G. Xu, Y. Wang, and G. Xiao)
Intense high energy carbon ion beam delivered by HIRFL-cooling storage ring (CSR) were used to produce the radiographs of stationary objects on Kodak EDR2 films and on CsI(Tl) crystal. With applying the marginal range method, the images with high contrast, high spatial resolution, and high density sensitivity were obtained. By comparing to proton radiography, the advantages of heavy ion radiography through marginal range method were mainly shown in the following: much more brightness (thus lower dose), higher spatial resolution, more sensitive to material density. The future proton/ion radiography (PIRg) project at the Institute of Modern Physics was introduced too.
The investigation of proton and heavy ion radiography is a rapidly growing research area (Koehler, Reference Koehler1968; West & Sherwood, Reference West and Sherwood1972; Benton et al., Reference Benton, Henke and Tobias1973; Steward & Koehler, Reference Steward and Koehler1973). The advantages of high energy proton and heavy ion radiography over conventional radiography lie in many aspects, in particular by ensuring much longer penetrating distance, higher spatial resolution, better sensitivity to material density, and a large dynamic range of imaging. Proton/heavy ion radiography is a new powerful tool not only for industrial applications, such as nondestructive inspection of bulk materials, but also for medical diagnosis (Shafranova & Shafranov, Reference Shafranova and Shafranov1980; Ten et al., Reference Ten, Evdokov, Zhogin, Zubkov, Kulipanov, Luk'yanchikov, Merzhievsky, Pirogov, Pruuel, Titov, Tolochko and Sheromov2005; Toyokawa et al., Reference Toyokawa, Ohgaki, Mikado and Yamada2002). Heavy ion radiography has been applied at the Lawrence Berkeley Laboratory for human tissues diagnosis (Benton et al., Reference Benton, Henke and Tobias1973; Fabrikant et al., Reference Fabrikant, Holley, Mcfarland and Tobias1982). Most interesting, the possibility that proton and heavy ion radiography provide for tracing the evolution of the state characteristics of a substance in a fast dynamic process draws more and more attentions, especially in the study of high energy density physics and initial confinement fusion (Clarke et al., Reference Clarke, Simpson, Kar, Green, Beller, Carroll, Dromey, Kneip, Markey, Mckenna, Murphy, Nagel, Willingale and Zepf2008; King et al., Reference King, Ables, Adama, Alrick, Amann, Balzar, Barnes, Crow, Scusing, Eddleman, Fife, Flores, Fujino, Gallegos, Gray, Hartouni, Hogan, Holmes, Jaramillo, Knudsson, Londaon, Lopez, Mcdonald, Mcclelland, Merrill, Morley, Morris, Naivar, Parker, Park, Pazuchanics, Pillar, Riedel, Sarracino, Shelley, Stacy, Takala, Thompson, Tucker, Yates, Ziock and Zumbro1999; Golubev et al., Reference Golubev, Demidov, Demidova, Dudin, Kantsyrev, Kolesnikov, Mintsev, Smirnov, Turtikov, Utkin, Fortov and Sharkov2010). King et al. (Reference King, Ables, Adama, Alrick, Amann, Balzar, Barnes, Crow, Scusing, Eddleman, Fife, Flores, Fujino, Gallegos, Gray, Hartouni, Hogan, Holmes, Jaramillo, Knudsson, Londaon, Lopez, Mcdonald, Mcclelland, Merrill, Morley, Morris, Naivar, Parker, Park, Pazuchanics, Pillar, Riedel, Sarracino, Shelley, Stacy, Takala, Thompson, Tucker, Yates, Ziock and Zumbro1999) showed lower dose requirement and the possibility to observe the dynamic process by using the ultra-fast imaging camera system.
Normally, there are three ways to produce proton and heavy ion radiography (Cookson, Reference Cookson1974): (1) angular spread given to a proton/ion beam as it penetrates an object is used in multiple scattering radiography, which is produced by the multiple small-angle Coulomb scattering of target atoms. A new unique magnetic lens system has been developed at the Los Alamos Laboratory to improve the spatial resolution and such kind of radiography is planned to be applied at FAIR (the Facility for Antiproton and Ion Research) in Europe (King et al., Reference King, Ables, Adama, Alrick, Amann, Balzar, Barnes, Crow, Scusing, Eddleman, Fife, Flores, Fujino, Gallegos, Gray, Hartouni, Hogan, Holmes, Jaramillo, Knudsson, Londaon, Lopez, Mcdonald, Mcclelland, Merrill, Morley, Morris, Naivar, Parker, Park, Pazuchanics, Pillar, Riedel, Sarracino, Shelley, Stacy, Takala, Thompson, Tucker, Yates, Ziock and Zumbro1999; Tahir et al., Reference Tahir, Piriz, Wouchun, Shutov, Lomonosov, Deutsch, Hoffmann and Fortov2009). (2) In the density profile and porosity measurements, the energy loss of individual protons/ions has been used to indicate the object area density (Ferguson et al., Reference Ferguson, Cookson and Armitage1972). (3) The Bragg peak and the rapid fall in proton/ion intensity near the end of the range in material are used in marginal range radiography (Steward & Koehler, Reference Steward and Koehler1973).
Although proton radiography has been intensively studied in recent years because of its quite long penetrating distance in material, heavy ion radiography still has some apparent advantages over proton radiography, such as a higher radiography efficiency, correspondingly a lower dose requirement, and less scattering and range straggling in the case of same range in matter. Therefore, a radiograph with high contrast and high spatial resolution (both in lateral and longitudinal direction) is obtainable through the marginal range radiography method by heavy ion impact. Studies on high energy (GeV) heavy ion radiography are still scarcely reported and the discussions about the differences between proton radiography and heavy ion radiography are fairly rare.
In this work, the experiment on high energy carbon ion radiography at HIRFL employing marginal range radiography method is presented. Heavy ion radiography and proton radiography are compared in the following aspects: brightness, longitudinal resolution, lateral resolution, and the resolution difference with varying materials using transport of ions in matter (TRIM) simulation. The new proton and ion radiography (PIRg) facility, which will be integrated in the HIRFL CSR at Institute of Modern Physics is introduced too.
4.1. Experimental Setup
Since the successful completion of the CSR project at HIRFL, the upgraded accelerator system consists of ECR ion source, sector focus cyclotron (SFC), separated sector cyclotron (SSC), the main cooling storage ring (CSRm), and the experimental cooling storage ring (CSRe). As a result, the high-quality heavy ion beams with large energy range become available at IMP Lanzhou, e.g., 2.8 GeV proton and 1.1 AMeV carbon ion could be provided by CSRm; 2.0 GeV proton and 760 AMeV carbon ion could be extracted from CSRe. In the CSRm system, the new generation of electron cooler is used to improve the beam quality and then the beam momentum spread is decreased from 1.5 × 10⁻³ to 5 × 10⁻⁴ for C-U ion with energy varying from 10 to 50 MeV/u (Zhan et al., 2004, 2007; Zhao et al., Reference Zhao, Xiao, Xu, Zhao, Xia, Jin, Ma, Liu, Yang, Zhang, Wang, Li, Zhao, Zhan, Xu, Zhao, Li and Chen2009).
In our case, the high energy carbon ions were accelerated by the CSRm and the radiography experiment was performed at the Cancer Therapy Terminal, which is designed for the heavy ion tumor therapy at IMP. In this radiography study, 165 MeV/u carbon ion beam was employed and the accelerated ion beam was directly extracted from CSRm into the air and impact on the target system to produce the radiographs. The extraction time of carbon ion beam was about 3 s with about 6 × 10⁷ ions/pulse and the beam diameter was about 25 mm.
Figure 21 schematically illustrates the experimental setup: the extracted carbon ions first penetrated through a series of Cu absorber layers with the diameter of about 40 mm, whose thickness could be adjusted from 1 mm to 10.5 mm with the minimum step about 0.25 mm. The absorber layers were used to adjust the beam energy and guarantee that the ion marginal range was placed in the objects where the beam intensity rapidly change for utilizing the marginal range radiography method. Then the outgoing ions reach the film and scintillator to produce the radiographs. A Cu cross mask and a two Euro coin (German) were employed, respectively, as our objects. The absorber layers and object were fixed by an Al target holder (the clamper hole was 24 mm in diameter and 10 mm in thickness) and only the very edge area of the coin was clamped by the target holder. Kodak extended dose range (EDR2) film (2 mm distance to object) and CsI(Tl) crystal (7 mm distance to object) positioned back of the object were used to record the produced radiographs, respectively.

Fig. 21. (Color online) A schematic illustration of the heavy ion radiography setup at IMP.
The Kodak EDR2 ready-pack film is a newly designed product of dosimetry applications. Due to it's relatively insensitivity to X-ray energies, the film has a wide response range and shows a linear dependence of the net optical density on dose (Chetty & Charland, Reference Chetty and Charland2002). Meanwhile, a 0.15% Tl doped CsI crystal with the thickness of about 2 mm and density about 4.53 g/cm3 was used to record the radiographs too, which mainly outputs 560 nm wavelength light (Novotny, Reference Novotny2005). The produced radiographs on CsI (Tl) crystal were recorded by a well focused Nikon D100 digital camera with the Nikon Nikkor 50 mm 1:1.4D lens. The camera was positioned at 30o–35o angle to the beam incidence and was about 60 cm to the CsI (Tl) crystal. The charge coupled device size of Nikon D100 digital camera is 23.4 × 15.6 mm2 and the best resolution of 3008 × 2000 pixels with 6.1 megapixel was applied. In our experiment, the ISO of camera was selected at 1600, the aperture was F2.8 and the shutter was set for 3 s, respectively. One thing needs to be noted is that this camera has a low dynamic range (0–256), i.e., the output image is in 8 bit.
4.2. Results and Discussion
Figure 22 shows the results of 165 MeV/u carbon ions impacting on the Cu cross mask object. The intagliated Cu cross mask was 2 mm in thickness and 27 mm in diameter and each of the cross in the center was 10 mm in length and 1 mm in width (Fig. 22a). Figures 22b and 22c show the produced radiographs on the EDR2 film and the induced fluorescence image on CsI(Tl) crystal, respectively.

Fig. 22. (Color online) Produced Radiographs by 165 MeV/u carbon ions at IMP. The picture of the actual Cu cross-mask object picture (a); the radiograph on the EDR2 film (b) and the induced fluorescence image on the CsI(Tl) crystal (c).
The produced cross-mask radiographs with reasonable image contrast could be observed both on the Kodak film and on the CsI(Tl) crystal. The image contrast on film seems higher than that on the CsI(Tl) crystal. However, it is to be noted that the high image contrast radiograph on the film was produced by the impact of 20 pulses of carbon ions and the accumulated dose was about 109 ions. In our study, the radiograph on the EDR2 film impacted by only one pulse of carbon ions shows nothing and the reason may be because the impact ion dose is too low to produce the observable changing on the film. The relatively lower contrast radiograph on the CsI(Tl) scintillator was produced by single shot with dose about 6 × 10⁷ ions. The compared radiography result between EDR2 film and CsI(Tl) crystal proves that the scintillator is a more effective way to record the heavy ion radiographs than film.
By the way, in Figures 22b and 22c, centering on the cross a larger circular with diameter about 40 mm are shown too in the images, which is in accordance with the diameter of the Cu absorber layers. The external dark area may be produced by the scattered carbon ions on the target system.
Besides the simple Cu cross mask object, the relative complex pattern of two Euro coin (German design; 1.95 mm in thickness and 25.75 mm in diameter; the inner segment is made of 3 layers: Cu(75%) + Zn(20%) + Ni(5%), Ni, Cu(75%) + Zn(20%) + Ni(5%) and the outer ring is made of Cu(75%) + Ni(25%) alloy (Council regulation (EC) No. 975/98 on denominations and technical specifications of euro coins intended for circulation, 1998)) was employed too. The carbon ions with 165 MeV/u energy impacted onto the target system and the produced radiographs were shown in Figure 23b. The actual pictures of two Euro coin (front and back sides) are shown in Figure 23a. The length of the extra absorber layers was finely adjusted so that the ions penetrating the thinner part of the object would just be able to reach the crystal, but the others were stopped in the object. As a result a reasonable image contrast radiograph on CsI(Tl) crystal was obtained.

Fig. 23. (Color online) Radiograph of two Euro coin (German design) by 165 MeV/u C ions impact, (a) shows surface features of both sides of the actual coin; (b) shows the radiograph on the CsI(Tl) crystal.
As shown in Figure 23b, both of the symbol “2” on the face side and the symbol “eagle” on the back side could be observed. The contrast of this image is very low with brightness of only about 30 and the reason could be attributed to the longer afterglow time of CsI(Tl) crystal, although it has high light emission efficiency. By changing the thickness of the absorber layers to get the best contrast radiograph, the longitudinal resolution is on the order of 10 µm. In the lateral direction, the mouth detail of symbol “eagle” is not clearly shown but through measuring the narrowest part of the symbol “2,” the lateral resolution is order of several hundreds of micrometer.
Meanwhile, the ring-shaped coin edge is clearly shown in Figure 23b too. Since the inner segment and the outer ring of the coin are made of different materials, the ranges of ions in the two parts are accordingly different. It is obvious that the heavy ion radiography is quite sensitive to the object material density.
Based on the radiograph, it is clear that the density of outer ring part is larger than that of inner segment. However, the density detail about the coin is not found and the comparison between experimental result and the actual case is difficult. In our experiment, the carbon ion energy was just selected for the inner segment material and therefore the pattern features in the inner part are apparently shown. If the carbon ion energy is specially selected for the outer ring material, the star-masks on the ring should be observable as well.
The quality of the radiography image can be improved by the following means: first, by increasing the beam intensity, an image with more brightness could be achieved. Second, by applying a thinner crystal with reasonable fluorescence efficiency, an image with a better lateral resolution and a better contrast could be expected. Third, a camera with a larger dynamic range, for example with 16 bit, can improve the image quality as well.
4.3. Comparison of Heavy Ion Radiography and Proton Radiography
As discussed above, the radiograph produced by heavy ion beam shows a high spatial resolution, reasonable image contrast, and high sensitivity to material density properties, in the following we would like to compare it with proton radiography in method of marginal range radiography. 89 MeV proton beam is chosen since it has the same range in the sample material (Cu) with 165 MeV/u carbon ion beam.
The energy loss and the flux along the range of carbon ion (165 MeV/u) and proton (89 MeV) in Cu are calculated by TRIM (Biersack & Haggmark, Reference Biersack and Haggmark1980; Ziegler, 1977) program and the results are shown in Figure 24 (statistic error <1%). In Figure 24a, the value for proton was multiplied by a factor of 33, and then it becomes comparable with that for carbon, which means that carbon ion has apparently the larger energy loss in unit length. In fact, the energy deposition at Bragg peak is proportional to Z 2 (Z is the projectile nuclear charge), so heavy ion beam as a radiography source is much more bright than proton and thereby the dose requirement for heavy ion beam to produce a reasonable radiograph is much less than that for proton beam.

Fig. 24. The energy loss (a) and the flux (b) increases as a function of depth in Cu for 165 MeV/u carbon ion and 89 MeV proton, respectively.
On the other hand, the Bragg peak of carbon ion is about two times sharper than that of proton (FWHMcarbon = 0.5 mm and FWHMproton = 1.0 mm). Moreover, as shown in Figure 24b, the carbon ion beam is stopped within a much narrower marginal range than proton beam, e.g., 90% of carbon ions is stopped within 0.13 mm, while 90% of proton is stopped within 0.49 mm. As a result, an obvious higher longitudinal resolution could be expected for carbon ion radiography than that for proton radiography.
As shown in Figure 25, the lateral distributions of the 89 MeV protons and 165 MeV/u carbons were calculated using TRIM program too. The carbon ions are more difficult to be scattered by target atoms than proton. It is clear in Figure 25 that the carbon ion has smaller lateral distribution (FWHM = 0.34 mm) than proton (FWHM = 1.23 mm) (statistic error <1.2%). Therefore, the carbon ion radiography has a better lateral resolution than proton radiography.

Fig. 25. Lateral distributions of 89 MeV proton and 165 MeV/u carbon in Cu calculated by TRIM, respectively.
Figure 26 shows the TRIM calculation results that the FWHM at the marginal range in longitudinal (a) and in lateral (b) direction as function of the target atomic number Z for 165 MeV/u carbon ion beam and 89 MeV proton beam impacting on kinds of material. It is apparent that both longitudinal and lateral FWHMs are always larger for proton than that for carbon ion, which means that the higher longitudinal and lateral resolution could be obtained through the heavy ion radiography than proton radiography when using the marginal range radiography method.

Fig. 26. FWHM in longitudinal (a) and in lateral (b) direction for 165 MeV/u carbon ion and 89 MeV proton as functions of target atomic number Z, respectively.
4.4. The Ongoing Project of Proton/Ion Radiography (PIRg) at IMP
A new special facility for Proton/Ion Radiography (PIRg) has been designed (see Fig. 27). The working parameters are as follows: length of this facility is about 25 m, and energy range is 0.8–2.2 GeV/u for proton and 0.4–0.83 Gev/u for carbon ion. The maximum irradiation diameter is 100 mm and incident proton intensity is 1 × 10¹⁰–1 × 10¹¹. The particle/pixel is 104 and pixel/frame is 106–7, respectively. Q surface field is 1.2 Tesla and Q bore radius is 60 mm.

Fig. 27. (Color online) PIRg facility at IMP.
Based on the unique CSRm and CSRe structure at HIRFL, a terminal with double-beam line between the CSRm and CSRe is specially designed for the study of HEDP, where the high energy density matter will be produced by the highly intense beam from CSRm and simultaneously the dynamic process could be systematically investigated through the proton and heavy ion radiography by the beam from CSRe using the PIRg facility.
The carbon ions with 165 MeV/u accelerated by the HIFRL-CSR were applied to produce the radiographs on the EDR2 films and on CsI(Tl) crystal. Using the marginal range radiography method, the produced radiographs for Cu cross mask and two Euro coin were successfully observed. The experiment has shown that the best longitudinal resolution is about 10 µm, the lateral resolution is in several hundreds of micrometer magnitude, and the high energy heavy ion radiography is very sensitive to the material density.
Based on the TRIM calculation, the properties of heavy ion radiography and proton radiography are presented. With the marginal range radiography method, the heavy ion radiography has higher brightness — thus lower dose requirement for incident ions than proton radiography, and better longitudinal and lateral resolution. Although heavy ion and proton have similar sensitivity to the material atomic Z and density, heavy ion always has the better spatial resolution than proton. As a result, heavy ion radiography seems more suitable for the medical application because it is more efficient, safer, and has a higher spatial resolution than proton radiography.
The new PIRg at HIRFL is introduced and a special designed terminal with double-beam line (CSRm and CSRe) for HEDP research with PIRg is proposed too.
5. ENERGY DEPOSITION OF HIGHLY CHARGED XENON IONS ON HOPG (Y. Wang, Y. Zhao, R. Cheng, X. Wang, Y. Lei, X. Zhou, G. Xu, J. Ren, Y. Yu, Y. Li, Y. Sun, and G. Xiao)
Highly charged (129Xeq+, q = 10–30) ion-induced secondary electron emission and formation of nanostructures on the surface of highly oriented pyrolytic graphite (HOPG) have been studied on the 320 kV ECR platform for highly charged ion beam at IMP, Lanzhou. The total secondary electron yield is measured as a function of the potential energy of incident ion. The experimental data is used to separate contributions of kinetic and potential electron yields. The estimated kinetic electron yield is about 17 electrons/ion, whereas the potential electron yield increases linearly from 5 to 68 electrons/ion with increasing potential energy of the incident ion. Atomic Force Microscope (AFM) analysis of the HOPG surface bombarded with Xe30+ ions revealed hillock like nanostructures. We estimate roughly 10 percent of ion's potential energy is consumed in potential electron emission. The rest of the ion's potential energy is responsible for the sputtering and material modification.
Highly charged ions (HCI) carry several tens of keV potential energy (the sum of the binding energies of the electrons that were removed to from the ions). Most of the potential energy is deposited within a few nm in the first few atomic layers of the surface on the fs time scale, effective energy deposition rates can exceed about 1014 W/cm2 (Winter et al., Reference Winter and Aumayr1999). How the potential energy is deposited into the surface and the respond of the surface are the most considerable topics in recent years. Secondary electron emission and surface modification in the interaction of slow (v < v Bohr) highly charged ions with surfaces are dominated by the deposition of potential energy of the ions. Studying both theoretically and experimentally the correlated electron emission from a single dot would be of considerable interest, both for the understanding of nanostructure formation and for diagnostic purposes (Aumayr & Winter, Reference Aumayr and Winter2007). The phenomenon of electron emission from solid surfaces induced by energetic ions is one of the most fundamental effects in ion-solid interaction and plays an important role in many technological applications such as electron multipliers for particle detection, surface analysis, mass spectrometry, plasma-wall interaction in fusion devices, etc. Ion-induced electron emission from a surface is commonly ascribed to two different mechanisms, i.e., the kinetic electron emission (KEE) (Delaunay et al., Reference Delaunay, Fehrringer, Geller, Hitz, Varga and Winter1987; Hughees et al., Reference Hughees, Burgdoerfer, Folkerts, Havener, Overbury, Robinson, Zehner, Zeijlmans Van Emmichoven and Meyer1993; Arnau et al., Reference Arnau, Aumayr, Echenique, Grether, Heiland, Limburg, Morgenstern, Roncin, Schippers, Schuch, Stolterfoht, Varga, Zouros and Winter1997) and potential electron emission (PEE) (Stockl et al., Reference Stockl, Suta, Ditroi, Winter and Aumayr2004; Lemell et al., Reference Lemell, Stockl, Burgdoerfer, Betz, Winter and Aumayr1998). KEE is due to the excitation of target electrons by transfer of kinetic energy from incident ions. In PEE, electrons are liberated in front of the surface by resonance or Auger neutralization of the incident ion. The PEE may contribute to the measured electron yields, if the ionization energy of the projectile ion (including target relaxation and electronic screening effects) exceeds twice the work function of the target material. For a given impact velocity, the PEE is known to increase linearly with the ion charge state or potential energy (Delaunay et al., Reference Delaunay, Fehrringer, Geller, Hitz, Varga and Winter1987). Above the kinetic energy threshold kinetic and potential electron emissions are correlated. Separation of relative contributions of potential and kinetic processes to electron emission is difficult but essential for fundamental understanding of the ion-induced electron emission. Previously, several attempts have been made to determine relative contribution of these processes to electron emission (Lemell et al., Reference Lemell, Stockl, Burgdoerfer, Betz, Winter and Aumayr1998). Another major channel for deposition of potential energy that requires quantification is to create permanent lattice damage. For highly charged ions, ions deposit their initial energies into first few atomic layers of the material, resulting in significant defects on the surface. Several groups have already noticed the formation of nanostructures on surfaces like HOPG, mica, CaF2, Al2O3, Si, SiO2, and some other materials (Mochiji et al., Reference Mochiji, Yamamoto, Shimizu, Ohtani, Seguchi and Kobayashi1997; Minniti et al., Reference Minniti, Ratliff and Gillaspy2001; An et al., Reference An, Fukuyama, Yokogawa and Yoshimura2002; Aumayr & Winter, Reference Aumayr and Winter2003; Terada et al., Reference Terada, Nakamura, Nakai, Kanai, Ohtani, Komaki and Yamazaki2005; Tona et al., Reference Tona, Watanabe, Takahashi, Fujita, Abe, Jian, Nakamura, Yoshiyasu, Yamada, Sakurai and Ohtani2007; Aumayr et al., Reference Aumayr, El-Said and Meissl2008; Wang et al., Reference Wang, Xiao, Zhao, Li, Zhao, Xu and Li2009). Detailed knowledge on the response of solid to intense electronic excitation from highly charged ion is essential for several material analysis techniques and modification of the solid surface on nanometer scale. In this work, we measured total electron yield and analysed nanometer scale structures induced by highly charged xenon ions on the HOPG surface.
5.1. Experimental Setup
Highly charged xenon ion (129Xeq+, q = 10–30) beam was produced by 14.5 GHz electron cyclotron resonance ion source on the 320 kV ECR platform for highly charged ion beam at IMP, Lanzhou. The ions were extracted from ECRIS by 5 to 320 kV. Highly charged ion beam was then mass analyzed with a 90° sector magnet, focused by two quadrupole lenses and deflected by another 60° sector magnet into the experimental chamber. Before hitting the target the beam was collimated to a divergence of about 0.3° by a pair of four-jaw slits. The target was mounted on a goniometer in the center of an ultra-high vacuum chamber (about 5 × 10⁻¹⁰ mbar). The current measuring technique was used to measure the total electron emission yield. The electron yield measuring device consists of three major parts namely, a pair of four-jaw slits, rejection aperture, and a cage. Target is placed inside a cage and the cage is biased with a ± 100 V in order to collect or suppress electrons emitted from the target. The total electron yield is given as  ${\rm \gamma}_T = q \displaystyle{{I_+ - I_-} \over {I_-}}$, where q is the charge state of projectile ions, I + and I − are the target current for ±100 V applied to the cage. For the detailed description of the electron yield measuring device see Wang et al. (Reference Wang, Zhao, Qayyum and Xiao2007).
HOPG target was freshly cleaved in air with adhesive tape and placed perpendicular to the ion-beam direction. In order to keep the surface clean, it was sputtered before every measurement. During cleaning process the surface condition was checked by measuring at intervals the electron yield and experiment was started after having the reasonably stable electron yield. The ion current density at the target was kept below 5 nA/cm2. And the HOPG surfaces that need to irradiate were kept free from the other side. Total ion flux of 1 × 10¹⁰ ions/cm2 was applied under normal incidence. After irradiation, samples were transported and imaged by AFM (Nanoscope III, Digital Instruments, Santa Barbara, USA) in tapping mode in air.
5.2. Electron Emission
Total electron emission yield γT as a function of available potential energy W q of the incident ion for normal impact of the projectile ions 129Xeq+ (q = 10–30) of 600 keV kinetic energy (0.4 v Bohr, 9.5 × 10⁵ m/s) on HOPG target is shown in Figure 28a. The indicated error bars show the statistical error. As it was expected, the total electron yield gradually increases with the potential energy of the ion. The straight line
 $${\rm \gamma} _T={\rm \gamma} _{KE}+{\rm \gamma} _{PE}=17.32+4.54 \times 10^{ - 3} \cdot W_q$$
fitted to data points cross the ordinate at a value that corresponds to the respective kinetic electron emission yield, indicating that contribution of kinetic electron yield can be estimated from the data. The exclusive potential electron yields γPE obtained after subtracting the evaluated γKE value (i.e., 17.32 e/ion) for impact of Xeq+ on HOPG target are plotted versus W q in Figure 28b. The potential electron yield increases linearly from 5 to 68 electrons/ion with increasing potential energy of the incident ion.

Fig. 28. (Color online) (a) Total electron yield as a function of available potential energy of Xeq+ impacting on HOPG. (b) True potential electron yield as a function of available potential energy of Xeq+ impacting on HOPG.
γPE can be approximated as
 $${\rm \gamma} _{PE}={\rm \kappa} \cdot W_q\comma \;$$
where proportionality constant k depends on ion velocity but is independent of charge q.
The expressions of total electron yields that are directly proportional to the potential energies (or charge states) of the incident ions have already been observed by McDonald et al. (Reference Mcdonald, Schenkel, Hamza and Schneider2005) for various ions with very high charge states (up to Xe52+, Au69+, and Th80+). When putting our data together with others, as presented in Figure 29, it shows that the data agree with each other. It reveals that linear relation between γT and W q holds only for ions with relatively low charge states, which have initially full inner shells. However, this linear dependence doesn't hold for ions with very high charge states. The possible reason is that the potential energy of a projectile ion with intact L shell is converted into electron emission about three to four times more efficiently than the extra potential energy stored in the projectile L-shell vacancies (Xeq+, q > 44 ) (Kurz et al., Reference Kurz, Aumayr, Winter, Schneider, Briere and Mcdonald1994).

Fig. 29. Total electron yields as a function of available potential energy of Xeq+ impact on HOPG. The data for 6.4 × 10⁵ m/s (open squares) and 5 × 10⁵ m/s (open circles) velocities of Xeq+ impact on HOPG and Au have been included for comparison and are taken from (Mcdonald et al., Reference Mcdonald, Schenkel, Hamza and Schneider2005).
5.3. Formation of Surface Structures by Highly Charged Ions
Figure 30 shows a typical AFM image of the HOPG surfaces after irradiation with 600 keV 129Xe30+ ions. Total ion fluence of about 1 × 10¹⁰ ions/cm2 was applied under normal incidence. The image of 500 × 500 nm2 area shows distinct nanostructures created on the initially flat and smooth surface. They are hillock-like in shape with a diameter of 12 ± 4.9 nm and a height of 3.6 ± 1.5 nm.

Fig. 30. (Color online) AFM image of the HOPG surface irradiated with 600 keV Xe30+ ions.
Since the kinetic energy of incident ion was rather large, we can not say that the observed structure are exclusively due to the deposition of the potential energy into the target. For highly charged xenon ion, the nuclear stopping power S n is 2.1 keV/nm and the electronic stopping energy S e is 1.1 keV/nm (calculation using SRIM-2003) (Ziegler et al., Reference Ziegler, Biersack and Littmark2003). It has been reported that for incident ions with S e ≤ 7.3 keV/nm, the damage process on HOPG surface is dominated by the nuclear stopping (Liu et al., Reference Liu, Neumann, Trautmann and Mueller2001). The kinetic energy transferred to the lattice will eventually lead to heating and melting of the lattice. A modified inelastic thermal spike model (Aumayr et al., Reference Aumayr, Elsaid and Meissl2008) has been developed to consider the process of electronic excitation by the potential energy of highly charged ion and the subsequent phase transitions (heating, melting, and restructuring). Although the mechanism of energy deposition between HCI and swift heavy ions (SHI) is fundamentally different in the beginning but the strong electronic excitation on the surface within a nanometer scale region by HCI is very similar to the ion trajectory in the solid by SHI during the relaxation (Aumayr et al., Reference Aumayr, Elsaid and Meissl2008). This may explain why nanostructures on the surface produced by slow HCI have a similarity of the tracks induced by SHI in the solid.
Assume that 50% of the electrons are ejected directly into the vacuum (neglecting surface refraction) and the other half is given by the electron backscattering yield b (b = 9% for HOPG) (Hunger and Kuchler, Reference Hunger and Kuechler1979). Thus, the mean number of potential electrons emitted due to the deposition of W q is given as
 $$\overline{n} = W_q \cdot \lpar 0.5 + 0.5b\rpar /2W_{\rm \phi}.$$
Where W ϕ is the electronic binding energy of the surface (corresponding to the work function of the target, 5.0 eV for HOPG). The fraction of ion's potential energy for potential electron emission η is given as
 $${\rm \eta} = \displaystyle{{{\rm \gamma}_{PE} } \over {\overline n }} = 2k \cdot W_{\rm \phi} /\lpar 0.5 + 0.5b\rpar.$$
Where η depends on ion impact energy and electronic binding energy of the material, but independent on ion charge state (potential energy). In this experiment, k is 4.54 × 10⁻³, according to Eq. (4). The value of η is 8.33% for 600 keV Xe30+-HOPG interaction. At roughly 10% of the potential energy is consumed in potential electron emission. There is also resonant electron capture, fast Auger electrons or plasmon assisted capture (Baragiola & Dukes, Reference Baragiola and Dukes1996; Schenkel et al., Reference Schenkel, Barnes, Niedermayr, Hattass, Newman, Machicoane, Mcdonald, Hamza and Schneider1999) measured the deposition of potential energy of slow (6 × 10⁵ m/s) highly charged ions in solids. Only about 10% of the potential energy of Au69+ and Xe52+ ions has been accounted for the release of secondary electron. This result quite accords with our estimate. The rest of a large fraction of the potential energy can go into other channels and is finally converted into heat close to the target surface that result in sputtering and material modification.
In conclusion, total secondary electron yield of a HOPG target induced by highly charged xenon ion (129Xeq+, q = 10–30) was measured and contributions of PE and KE yields were obtained. The potential electron yield was proportional to the potential energy of the ion. In addition, surface nanostructures created by individual ions were investigated by AFM. The results show that high potential energy of the incident ions is responsible for the observed hillock-like nanostructures. Our results indicate that only about 8.33% potential energy of the highly charged ions is utilized in potential electron emission and rest of its potential energy is most probably deposited in first few monolayer of the target that produce nanostructures.
6. RAMAN SPECTROSCOPY OF HOPG IRRADIATED BY Xeq+ IONS (H. Peng, X. Lu, R. Cheng, Y. Zhao, T. Wang, and J. Zhao )
The highly charged xenon ions with kinetic energy of 450 keV were extracted from 320 kV ECR platform and impacted on HOPG surface in ultra-high vacuum. Raman spectra of the HOPG were measured with a Renishaw Raman microscope, which suggested that monolayer grapheme would produce via impact of Xeq+ ions on the HOPG surface. The saturated trend occurred for the irradiation of Xeq+ and the critical dose was related to the charge state of projectiles.
The interaction of the HCI with solid surface has been studied extensively in recent years (Schenkel et al., Reference Schenkel, Barnes, Niedermayr, Hattass, Newman, Machicoane, McDonald, Hamza and Schneider1999; Hayderer et al., Reference Hayderer, Cernusca, Schmid, Varga, Winter and Aumayr2001; Nakamura et al., Reference Nakamura, Terada, Nakai, Kanai, Ohtani, Komaki and Yamazaki2005; Aumayr et al., Reference Aumayr, Elsaid and Meissl2008; Facsko et al., Reference Facsko, Heller, El-Said, Meissl and Aumayr2009; Wang et al., Reference Wang, Ding, Cheng, Peng, Lu and Zhao2011). The HCI is the ion whose boundary electrons are peeled off. Thus, the HCI carries huge potential energy that is equal to the sum of ionization energies of the specific peeled off electrons. When approaching to the solid surface, the HCI can capture electrons from the solid. As a result, the hollow atom whose captured electrons are still in highly excited states is formed. The potential energy of the HCI is dissipated in the solid by emissions of visible light, soft X-rays, and Auger electrons. Consequently, nanostructures might be produced on the surface. Therefore, the HCI is expected to be a powerful tool in surface modification. The HOPG was selected for its excellent surface characteristics, which are flat, easy to clean, and resistant to corrosion in the air. Meguro et al. (Reference Meguro, Hida, Koguchi, Miyamoto, Yamamoto, Takai, Maeda and Aoyagi2003) presented that nanoscale dimond like carben (DLC) was produced by impact of Ar8+ with the kinetic energy of 400 eV on the HOPG surface. Then they analyzed the Raman spectra of HOPG after irradiation of Ar+ and Ar8+, respectively. Koguchi et al. (Reference Koguchi, Meguro, Hida, Takai, Maeda, Yamamoto and Aoyagi2003) presented that the work function of irradiated HOPG surface was closer to that of DLC. Nakamura et al. (Reference Nakamura, Terada, Nakai, Kanai, Ohtani, Komaki and Yamazaki2005) showed nano-dots formed after bombardment of HCIs, respectively (Hayderer et al., Reference Hayderer, Cernusca, Schmid, Varga, Winter and Aumayr2001; Wang et al., Reference Wang, Yang, O'Rourke, Xu, Chen, Cheng, Peng, Mitsuda and Yamazaki2008). In Wang's experiments, the HOPG samples were irradiated and then analyzed by X-ray Photoelectron Spectroscopy (XPS), their results showed the DLC was also created after impact of HCIs (Wang et al., Reference Wang, Zhao, Sun, Qayyum, Liu, Wang and Xiao2011). Nano-modification on the irradiated HOPG surface scanned by Scanning Probe Microscopy (SPM) has been reported (Hayderer et al., Reference Hayderer, Cernusca, Schmid, Varga, Winter and Aumayr2001; Meguro et al., Reference Meguro, Hida, Koguchi, Miyamoto, Yamamoto, Takai, Maeda and Aoyagi2003; Wang et al., Reference Wang, Yang, O'Rourke, Xu, Chen, Cheng, Peng, Mitsuda and Yamazaki2008). Meanwhile, the Raman spectroscopy is another nice choice to identify the modification on the HOPG surface because of the characteristics of fast and nondestructive. The Raman spectroscopy has been extensively used to identify carbon materials, such as graphite, nano-tube carbon, DLC, and graphene. (Ferrari, Reference Ferrari2007; Graf et al., Reference Graf, Molitor, Ensslin, Stampfer, Jungen, Hierold and Wirtz2007; Ni et al., Reference Ni, Wang, Yu and Shen2008; Dresselhaus et al., Reference Dresselhaus, Dresselhaus and Hofmann2008; Compagnini et al., Reference Compagnini, Giannazzo, Sonde, Raineri and Rimini2009)
In this work, the HOPG surfaces were impacted by the Xeq+ ions and then analyzed by a Renishaw Raman microscope to present the change of microstructure on irradiated HOPG surface.
6.1. Experimental Setup
The irradiation experiments were carried out on a 320 kV high voltage platform at the Institute of Modern Physics in Lanzhou. The HCI beam was extracted by the ECR source and separated into specific charge state by an analyzing magnet. Then Xeq+ ions were selected and accelerated to kinetic energy of 450 keV. After passing through another analyzing magnet, focusing magnets, bending magnet and two slits, the Xeq+ (q = 5, 21, 26) beam impacted on the HOPG surfaces that were carried by a target holder. The target holder was connected to a pico-ammeter that can monitor the beam current. The size of the beam spot on the target was 8 mm × 8 mm. The typical beam current and density are 1 µA/cm2 and 2 µA/cm2, respectively. The typical fluences were about 8 × 10¹², 3 × 10¹³, 1 × 10¹⁴, and 3 × 10¹⁴ ions/cm2. The base pressure in the target chamber was about 3 × 10⁻⁸ mbar. The samples were analyzed by the Renishaw Raman microscope with wave length of 633 nm in air condition at room temperature.
6.2. Results and Discussions
Figure 31 displays the Raman spectrum of the fresh HOPG surface with laser wavelength of 633 nm. The G peak is associated with the E 2g mode at 1580 cm−1 in the first order Raman spectrum. The D peak at 1335 cm−1 is called disorder peak, which can't be found in the spectrum of un-irradiated HOPG because its surface is ordered. Some results showed that the disorder peak is at 1350 cm−1 with laser wavelength of 514 nm, because the D peak disperses with excitation energy of the laser. The diamond sp3 mode is at 1332 cm−1 in the Raman spectrum, which is close to the D peak, however the cross-section of the diamond sp3 is far lower than that of graphite with excitation energy of 633 nm (Prawer et al., Reference Prawer, Nugent, Lifshitz, Lempert, Grossman, Kulik, Avigal and Kalish1996; Samano et al., Reference Samano, Soto, Olivas and Cota2002; Ferrari, Reference Ferrari2007). Therefore, the D peak is mainly contributed by the disorder of HOPG surface. The G′ peak that is also named 2D peak at 2683 cm−1 for it is the second order of D peak. It disperses with excitation energy and is always selected to identify graphene because the Raman spectrum of the graphene has a sharp and high 2D peak, whose intensity is four times higher than that of G peak. The peak at 3250 cm−1 is the second order process of D′ peak, which is also named 2D′ peak.

Fig. 31. The typical Raman spectra of the fresh HOPG.
The Raman spectra of HOPG irradiated with Xe5+ with different doses are plotted in Figure 32. The D peak appeared in Raman spectra at 1332 cm−1 after irradiation. With increase of the fluence, both the G peak and the D peak broadened, indicating the HOPG surface turned into disorder. There is a peak at 2643 cm−1 that might be from 2D peak of monolayer graphene (Ferrari, Reference Ferrari2007). The Raman spectra of the graphite include the 2D peak too. However the peak position of monolayer graphene is different from that of graphite, which is showed in Figure 31 at position of 2683 cm−1. One can easily separate them in Raman spectra showing in Figure 32. The FWHM of 2643 peak is less than 15cm−1. Graf et al. (Reference Graf, Molitor, Ensslin, Stampfer, Jungen, Hierold and Wirtz2007) and Frerrari (Reference Ferrari2007) pointed that the mono-layer graphene would show perfect sharp 2D line in Raman spectra and bi-layer graphene would appear broaden 2D line. So we suggest the peak at position of 2643 cm−1 was due to the mono-layer graphene on HOPG surface.

Fig. 32. The Raman spectra of the HOPG irradiated Xe5+ with different doses.
The Raman spectra of HOPG irradiated by Xe21+ and Xe26+ with different doses are compared in Figures 33 and 34, respectively. There was a tiny 2D peak of Raman spectrum of graphene in Figure 34 with irradiation dose of 8 × 10¹² ions/cm2. In the spectra, the D and D′ peaks are appeared and the D, G, and D′ peaks are broadened as the fluence increased. The G and G′ merged together with irradiation dose of 3 × 10¹³ ions/cm2 for Xe21+ and Xe26+. They are clearly separated after Xe5+ irradiation with dose of 3 × 10¹³ ions/cm2. The sharp G peak indicated the stretching vibration of the sp2 carbon atoms on the flat plane and the broadening of G peak suggested that the graphite layers turned into disorder, which resulted from the energy deposition of bombarded ions.

Fig. 33. The Raman spectra of the HOPG irradiated Xe21+ with different doses.

Fig. 34. The Raman spectra of the HOPG irradiated Xe26+ with different doses.
After the compared Figures 31–34, there were several differences in the Raman spectra of HOPG irradiated with different charge states ions at dose of 8 × 10¹² ions/cm2 and fresh HOPG. There were the graphene peaks at position of 2643 cm−1 for the impact of Xe5+ and Xe21+ with the fluence of 8 × 10¹² ions/cm2. On the contrary, there is no graphene 2D peak for impact of Xe26+. Compared with Raman spectra of Xe5+, one can find that the 2D peak of graphene decreased with impact of Xe21+, which indicated the decrease of graphene structure in HOPG sample. Figure 32 displayed the peaks at 2643 cm−1 for the impact of Xe5+ with different irradiation doses. However, the 2D peak of graphene just showed when the irradiation dose of Xe21+ was 8 × 10¹² ions/cm2 in Figure 33. To explain this result, the interaction of HCI with HOPG surface should be considered. When approaching the surface, the HCIs can capture electrons from surface and emit Auger electrons, which could collide with the bound electrons of carbon atoms. Both the electron capturing process and the Auger electron process might lead to the break of the covalent bond of the carbon. Those broken covalent bonds can recover between atoms on adjacent layers. As a result, the simple order plate structure would turn into complex structure combined with graphite and diamond. The higher charge state the projectiles have, the more electrons would be captured and emitted. Wang et al. (Reference Wang, Zhao, Sun, Qayyum, Liu, Wang and Xiao2011) had measured the electron yield for the impact of Xeq+ (10 ≤ q ≤ 30) ions on HOPG surface at kinetic energy of 600 keV. Their result showed that the electron yield of Xe23+ is 50.9, which is 2.8 times larger than that kinetic electron yield of 18 for impact of Xe10+ and the potential electron yield of 5 for Xe10+. However, it should be pointed out the kinetic energy of Xeq+ in Wang's study is higher than the kinetic energy in this study. According to Qayyum's (Reference Qayyum, Schustereder, Mair, Scheier, Mair, Cernusca, Winter and Aumayr2003) study, the kinetic electron yield is linearly increased with the velocity of the projectile at velocity region of 8 × 10⁵ m/s for the impact of single charged ions. Consequently, kinetic electron yield with incidental energy of 450 keV should be 14.7 for the impact of Xe+. Therefore, it is reasonable to believe that the electron yield of Xe21,26+ are several times than that of Xe5+ for this study. Here, we neglected the potential electron yield of Xe5+. When impacting on HOPG, the Xe5+ ions turned into atoms and stayed between the carbon layers. As a result, carbon layers in HOPG changed into separated graphene layers. For the impact of Xe21+, it is obviously that much more electrons would be emitted.
All of the Raman spectra were analyzed by the multi-Gaussian-peaks fitting and the FWHM of D and G peaks were obtained. The Figure 35a exhibits the FWHM of the D peak as a function of the irradiation dose. As one can see, the FWHM of the D peak increase linearly with the irradiation dose and the slopes do not increase with the charge state of the projectiles. Plotting of the FWHM of G peak as function of square root of irradiation dose is presented in Figure 35b. The FWHM of G peak increase linearly with the square root of irradiation dose for Xe5+. Hida et al. (Reference Hida, Meguro, Maeda and Aoyagi2003) had presented a similar results for impact of Arq+, however the FWHM of G peak in his work were lower than ours. In their result, the kinetic energy of projectiles was 400 eV, which is much lower than the kinetic energy in this research. We suggested that kinetic energy could produce defects on HOPG and then boarden the G peak displayed in Raman spectra. As the irradiation fluence increased, the FWHM value of the G peak became saturated for the impact of Xe21+,26+. The critical saturated dose of FWHM value of the G peak was 1 × 10¹⁴ ion/cm2 for the impact of Xe21+ ions, corresponding square root of the irradiation dose of 1 × 107 cm−1. In the case of Xe26+, the saturated dose drops to 3 × 10¹³ ion/cm2 corresponding square root of irradiation dose of 5.4 × 106 cm−1. The impact of ions with higher charge state was more easily saturated than that of lower charge state on the HOPG. When the irradiation dose goes up to 1 × 10¹⁴ ion/cm2, each area bigger than 1 nm2 would be bombarded by the projectile. For impact of the single charged ions, the affected region was several square angstroms. It would be expanded as the increase of charge state, because the highly charged ions have more potential to wreck the HOPG surface than low charged ions. The region would be overlapped when the irradiation dose is above a critical value, which depends on the charge state. Consequently, all the plane structure might be destroyed, and the G peak became broadening. The higher charge state it was, the lower critical value would be.

Fig. 35. The relation between the FWHM of D and G peaks irradiation dose. (a) the dependency of FWHM of D on the irradiation dose (b) the dependency of FWHM of G on the square root of the irradiation dose. The impact of Xe5+ symbol by solid squares, Xe21+ symbol by solid circles and Xe26+ symbol by solid triangles.
The HOPG surfaces were bombarded by Xeq+ ion with kinetic energy of 450 keV in ultra-high vacuum. The Raman spectra of irradiated HOPG surface were measured and then fitted by Gaussian distribution. The results suggested that graphene layers formed on HOPG surface after bombardment of Xe5,21+ ion. Part of the sp2 hybridization turned in to sp3 hybridization as the fluence increased, which would destroy the structure of the graphite layer. The HOPG surfaces were saturated at the critical threshold that depended on the charge state of ions. The deposition of the kinetic energy would contribute the distortion of HOPG surface as well the deposition of the potential energy.
7. CONCLUSION
In this work, we reported on current trends in heavy ion physics in some institutes in China. Emphasis is placed on the interaction of ions with ionized matter. Starting with discharge plasma at low density, the trend is to go to higher density laser plasma in the future. Pioneering experiments in this field have been performed previously at GSI-Darmstadt and Institute of Theory and Experimental Physics in Moscow. The support of these laboratories as well as the close collaboration with the plasma physics groups at these laboratories helped to establish this research field also in China. In the start-up experiments, low energy ions from a high voltage platform were used. Thus an energy range that was until now very little explored becomes available for beam plasma interaction experiments. Moreover, we started to investigate the influence of a magnetic field. A new and very important diagnostic tool is proton radiography, which has been started and first results were presented. Energy deposition processes are at the heart of this research work. Interesting phenomena occur in the interaction of highly charged ions with highly oriented pyrolithic graphite. Ion beam matter and ion beam plasma interaction has a wide range of application and is an important tool in the diagnostic of warm dense matter. This is just the beginning and we are sure this field will rapidly progress also in this country.
ACKNOWLEDGMENTS
The work reported in Section 2 (Y. Zhao, R. Cheng, D. Zhang, Y. Wang, A. Golubev, X. Zhang, X. Zhou, X. Wang, Z. Hu, G. Xu, J. Ren, Y. Li, Y. Lei, Y. Wang, and G. Xiao) was supported by the Major State Basic Research Development Program of China (Grant No. 2010CB832902), the NSFC project in China (Grant Nos.11075135, 11075192, 11075125), and partially supported by the WTZ project (Grant No. 1390). The authors are in debt to the workers in ECRIS, especially Mr. Jinyu Li.
The work reported in Section 3 (Z. Hu, Y. Song, and Y. Wang) was supported by the National Basic Research Program of China (Grants Nos. 2010CB832901 and 2008CB717801), the Fundamental Research Funds for the Central Universities (Grant No. DUT10ZD111), and the Program for New Century Excellent Talents in University (NCET-08-0073).
The work reported in Section 4 (R. Cheng, Y. Zhao, X. Zhou, Y. Sun, Y. Lei, X. Wang, G. Xu, Y. Wang, and G. Xiao) was supported by Major State Basic Research Development Program of China (‘973’ Program) No. 2010CB832902 and National Natural Science Foundation of China (NSFC), Nos. 10805063 and 11075192. The authors sincerely acknowledge the technical supports by the HIFRL-CSR group.
The work reported in Section 5 (Y. Wang, Y. Zhao, R. Cheng, X. Wang, Y. Lei, X. Zhou, G. Xu, J. Ren, Y. Yu, Y. Li, Y. Sun, and G. Xiao) was supported by the Major State Basic Research Development Program of China (‘973’ Program, Grant no. 2010CB832902), the National Natural Science Foundation of China through Grant Nos. 10805063 and 11075192, Ph. D financial support of West Light Foundation of CAS and Foundation of President's excellent scholarship of CAS. We would like to thank staffs of the 320 kV ECR platform for providing ion beams during the experiment.
The work reported in Section 6 (H. Peng, X. Lu, R. Cheng, Y. Zhao, T. Wang, and J. Zhao) was supported by the Fundamental Research Fund for Physics Mechanics of Lanzhou University No. LZULL200913 and the Fundamental Research Funds for the Central Universities No. lzujbky-2012-175. The authors are grateful to Li Jin-yu for his wonderful technical support and to Hu Guo-wen for his exciting discussions.