Introduction
Investigations of photoionized plasmas were performed using different sources, delivering pulses of intense X-ray or extreme ultraviolet (EUV) radiation. In case of experiments concerning laboratory simulations of astrophysical plasmas, plasma X-ray sources based on high-power Z-pinch or high-power laser installations were used. Such experiments were performed using, for example, Sandia National Laboratory pulsed-power Z facility (Bailey et al., Reference Bailey, Cohen, Chandler, Cuneo, Foord, Heeter, Jobe, Lake, Liedahl, MacFarlane, Nash, Nielson, Smelser and Stygar2001; Cohen et al., Reference Cohen, MacFarlane, Bailey and Liedahl2003) and laser facilities like GEKKO XII (Fujioka et al., Reference Fujioka, Takabe, Yamamoto, Salzmann, Wang, Nishimura, Li, Dong, Wang, Zhang, Rhee, Lee, Han, Tanabe, Fujiwara, Nakabayashi, Zhao, Zhang and Mima2009) or Shenguang II (Wei et al., Reference Wei, Shi, Zhao, Zhang, Dong, Li, Wang, Zhang, Liang, Zhang, Wen, Zhang, Hu, Liu, Ding, Zhang, Tang, Zhang, Zheng, Nishimura, Fujioka, Wang and Takabe2008). These installations allow to produce X-ray pulses of extremely high energy, reaching MJ in a single pulse. Laser systems of lower energy, below 100 J, were used for creation of intense X-ray pulses for photoionization of xenon or krypton, in experiments concerning auger-pumped EUV lasers (Kapteyn et al., Reference Kapteyn, Lee and Falcone1986; Sher et al. Reference Sher, Macklin, Young and Harris1987; Kapteyn and Falcone, Reference Kapteyn and Falcone1988). Similar experiments were also performed using free electron lasers delivering ultrashort pulses in soft X-ray range. In these experiments, inner shell photoionization allowed to obtain a population inversion directly (Rohringer et al., Reference Rohringer, Ryan, London, Purvis, Albert, Dunn, Bozek, Bostedt, Graf, Hill, Hau-Riege and Rocca2012), or as a result of the Auger effect. Photoionized plasmas can be induced not only by the X ray, but also the EUV radiation pulses. The EUV pulses were created at the Z Pulsed Power Facility using a special converter and used for the laboratory simulation of a white dwarf photosphere (Falcon et al., Reference Falcon, Rochau, Bailey, Ellis, Carlson, Gomez, Montgomery, Winget, Chen, Gomez and Nash2013). The intense EUV radiation, however, can be also produced using small-scale lasers or discharge systems. Using such systems, EUV-induced low-temperature plasmas can be produced. Such plasmas of very low density can be created in a vacuum chamber, filled with a gas under low pressure, of the order of 0.01–1 mbar. This type of plasmas are produced in the EUV lithography tools, where the vacuum chamber is filled with hydrogen or argon gas (van der Horst et al., Reference van der Horst, Beckers, Osorio and Banine2015a; van der Horst et al., Reference van der Horst, Beckers, Osorio, Astakhov, Goedheer, Lee, Ivanov, Krivtsum, Koshelev, Lopaev, Bijkerk and Banine2016a; van der Horst et al., Reference van der Horst, Osorio, Banine and Beckers2016b), for protection of the EUV optical systems. These gases are ionized by the EUV photons and converted to low-temperature plasmas with a very low electron density. In case of plasmas induced in argon, the measured values are of the order of 1010/cm3 (van der Horst et al., Reference van der Horst, Beckers, Nijdam and Kroesen2014), in case of hydrogen plasmas the electron density is even two orders of magnitude lower (van der Horst et al., Reference van der Horst, Beckers, Osorio, Astakhov, Goedheer, Lee, Ivanov, Krivtsum, Koshelev, Lopaev, Bijkerk and Banine2016a). Spectral measurements of Ar plasmas revealed emission lines of single charged ions and neutral atoms (van der Horst et al., Reference van der Horst, Beckers, Osorio, van de Ven and Banine2015b). Measurements of an ion distribution in hydrogen plasmas revealed presence of H+, H2+, and H3+ ionic species (van de Ven et al., Reference van de Ven, Reefman, de Meijere, van der Horst, van Kampen, Banine and Beckers2018). In case of the lithography tools, plasmas are created in a large volume. The EUV-induced plasmas, however, can be also produced in a small volume of dense gas, formed inside the vacuum chamber, by pulsed injection of a small portion of the gas, synchronously with the EUV pulse. Such microplasmas are being investigated from many years by authors of this article. Their specific feature concerns the electron density, which in case of microplasmas created in the dense gas can exceed 1018/cm3 (Bartnik et al., Reference Bartnik, Wachulak, Fok, Węgrzynski, Fiedorowicz, Skrzeczanowski, Pisarczyk, Chodukowski, Kalinowska, Dudzak, Dostal, Krousky, Skala, Ullschmied, Hrebicek and Medrik2015b). It should be pointed out that in both cases, plasmas emit the EUV radiation of a low intensity, orders of magnitude lower compared with the driving EUV pulses. It causes problems with detection of the emitted radiation, especially the time-resolved measurements. In case of the time-integrated measurements, performed for the experimental arrangements working with a high repetition rate and a good reproducibility, this problem can be overcome by accumulation of tens or even thousands radiation signals. In case of temporal measurements applied to a single EUV pulse, it is not possible.
In principle the EUV radiation pulses can be detected employing multichannel plate (MCP) amplifiers (Könneckea et al., Reference Könneckea, Follath, Pontius, Schlappa, Eggenstein, Zeschke, Bischoff, Schmidt, Nolla, Trabanta, Schreck, Wernet, Eisebitt, Senf, Schüßler-Langeheine, Erko and Föhlisch2013). The problem with MCPs in case of photoionized plasmas induced in gases is the poor vacuum. Due to a strong electric field, necessary for operation of MCPs they can be used only in the high vacuum environment. In the EUV lithography tools with mitigation systems based on hydrogen or other gases and experiments concerning interaction of the EUV radiation with gases, the high vacuum cannot be maintained. It does not mean, of course, that the use of the MCP-based systems is absolutely not possible in these cases. They can be used provided that a special vacuum system, with a differential pumping, is employed. It significantly complicates the experimental arrangement. Apart from that, the long distance between plasmas to be investigated and the EUV detector, together with a small orifice or a narrow slit necessary for the differential pumping, strongly limits a number of detected photons. It means that even with a strong amplification of the signal by the MCP, time-resolved measurements can be a problem.
In this work, time-resolved measurements of the EUV radiation, emitted from EUV-induced microplasmas, were carried out, using a specially prepared detection system that can operate under low vacuum conditions. The system is based on a grazing incidence EUV collector coupled to a semiconductor photodiode. The only limitation concerning the vacuum in this case is connected with the EUV absorption in the residual gas. Low-temperature plasmas were induced in small portion of gases, injected to the vacuum chamber, with a 10 Hz repetition rate. The injection system was synchronized with a laser-produced plasma (LPP) EUV source. In most cases, the vacuum at a level of 0.1–0.01 mbar was sufficient.
Experimental arrangement
An experimental set-up contains an LPP EUV source, a system for creating the EUV-induced low-temperature plasmas and a detection system. The LPP source is based on a Nd:YAG laser system (NL 129, EKSPLA) and a double-stream gas-puff target. The NL 129 laser system can deliver pulses with energy up to 10 J and a 10 Hz repetition rate. The laser can operate in two regimes concerning the pulse length: with a short time duration of approximately 1 ns and the long time duration ~10 ns. The latter case was employed in this experiment. The gaseous target is being formed by pulsed injection of a Xe gas into a hollow stream of helium (Xe/He target) by employing a double valve system, synchronized with the laser system. Interaction of a focused laser beam with the target results in the creation of high-temperature Xe plasmas emitting intense radiation in the EUV range. A typical spectrum of the emitted EUV radiation, measured using a home-made spectrograph, equipped with a 5000 l/mm free standing transmission grating (TG), is presented in Fig. 1a. The spectrum spans a wide wavelength range with the most intense emission between 3 and 16 nm and a maximum at the wavelength of approximately 11 nm. The maximum corresponds mainly to an unresolved transition array of Xe X,XI ions (https://physics.nist.gov/PhysRefData/ASD/lines_form.html), however can contain also lines corresponding to higher ionization states up to Xe XVI (Fahy et al. Reference Fahy, Dunne, McKinney, O'Sullivan, Sokell, White, Aguilar, Pomeroy, Tan, Blagojevic, LeBigot and Gillaspy2004). A full duration at half maximum (FDHM) of the EUV radiation, FDHM ≈ 12.5 ns, is comparable to the time duration of the driving laser pulse. The radiation is emitted in a full solid angle. Part of the radiation can be collected and focused using a special EUV collector. Our EUV source system was equipped with a ruthenium-plated, grazing incidence, axi-symmetrical ellipsoidal collector, manufactured by RITE s.r.o., Czech Republic. The grazing angle of approximately 15° allowed for effective focusing of the radiation in the wavelength range λ ⩾ 8 nm. To measure a spectrum of the focused radiation, an optical axis of the TG spectrometer was directed toward the reflective surface, such as, to acquire some part of the collected radiation. The recorded spectrum is presented in Figure 1b. Vertical scales in both spectra, shown in Figure 1 were normalized to maxima of spectral intensities, respectively. It should be noticed that the short-wavelength part of the spectrum was cut-off due to very small reflection coefficient in this range. The EUV fluence at the center of the focal spot reached a value of 0.4 J/cm2. A full width at half maximum (FWHM) of the intensity distribution across the spot was approximately 1.4 mm. More detailed information concerning formation of the double-stream gas-puff target and the LPP EUV source can be found elsewhere (Bartnik, Reference Bartnik2015a).

Fig. 1. Spectra corresponding to the LPP EUV source driven by the NL 129 laser system: (a) spectrum measured directly from the LPP, (b) spectrum of the radiation reflected from the collector surface.
The EUV beam formed using the collector was used for photoionization and excitation of gases, injected into the interaction region, orthogonally to an axis of the EUV beam, using an auxiliary gas-puff valve. The valve was equipped with a nozzle having a diameter of 2 mm. A distance between the nozzle outlet and the optical axis of the EUV beam was 2.5 mm. The gas density in the interaction region was changed within the wide range of approximately 0.01/0.5 of the atmospheric density.
Gases injected into the interaction region were ionized by the EUV beam forming low-temperature microplasmas. These plasmas emitted electromagnetic radiation of low intensity, either in optical or EUV range. Time-integrated EUV spectra were measured using a toroidal grating spectrograph, McPherson, USA, Model 251, equipped with a back-illuminated CCD camera (Princeton Instruments Inc., USA). A groove density of this spectrograph was 450 gr/mm, allowing to acquire spectra from a wavelength range of λ ≈ 10/95 nm with the spectral resolution of approximately λ/Δλ ≈ 500. Measurements of the weak spectra were possible by accumulation of multiple spectral signals and cooling down the CCD detector to a temperature of −65 °C.
In this experiment, temporal measurements of the EUV emission were of the main interest. Due to the very low intensity of the radiation, only spectrally integrated measurements, using a specialized detection system could be performed. The system was based on a grazing incidence paraboloidal collector and an EUV-sensitive silicon photodiode AXUV20HS1 (Opto Diode Corporation). A schematic view of this system is presented in Figure 2. The collector contained two identical, axi-symmetrical mirrors (RITE s.r.o., Czech Republic), mounted coaxially. A collecting solid angle of the single mirror was approximately 0.05 sr. The microplasma was created in a focal position of the paraboloidal mirror. A quasi-parallel EUV beam formed this way was focused by the second mirror at a distance of approximately 320 mm from the microplasma position.

Fig. 2. A schematic view of the system for the creation of EUV-induced microplasmas together with a detection system for the measurements of the EUV pulses emitted from such plasmas.
For imaging of the focal spot and measurements of its size, a back-illuminated CCD detector (DX420-BN, Andor) was mounted in the focal plane of the paraboloidal collector. The image was shown in Figure 2 (focal spot). The FWHM of the intensity cross-section is 1.5 mm and approximately 95% of the collected EUV radiation is embedded in the circular area with a diameter of 5 mm. This is a diameter of the AXUV20HS1, with a response time of 2 ns that was used for temporal measurements of the EUV signals in our detection system. More details concerning the detection system can be found elsewhere (Bartnik et al., Reference Bartnik, Fiedorowicz, Wachulak and Fok2018).
Experimental results
In our experiments, the EUV-induced plasmas, created in three rare gases, helium, neon, and argon, were investigated. In Figure 3, typical emission spectra obtained for these plasmas are presented. A spectrum obtained for He plasma is composed of two series of lines emitted by excited atoms and single charged ions, respectively. The most intense line at a wavelength λ = 30.38 nm corresponds to the 1s–2p transitions in He II ions. In case of the spectrum recorded for Ne plasma, lines corresponding to transitions in single charged ions are also dominating. It concerns especially two, the most intense lines, corresponding to 2s 22p 5–2s2p 6 (λ = 46.1 nm) and 2s 22p 5–2s 22p 4(3P)3s (λ = 44.6 nm) transitions (Kelly, Reference Kelly1987). Spectral intensities of the other lines connected with radiative transitions in Ne I–III species are a few times smaller. The Ar spectrum is composed of multiple lines corresponding to radiative transitions in single- and double-charged ions. On contrast to the He and Ne spectra, the Ar spectrum does not contain individual lines with intensities significantly higher compared with the other lines.

Fig. 3. Emission spectra recorded in the EUV range, obtained for low-temperature plasmas, induced in rare gases, ionized by interaction with intense EUV pulses: (a) helium, (b) neon, (c) argon.
In all cases, the spectra were acquired by the accumulation of multiple spectral signals. More details concerning creation of the EUV-induced plasmas and their parameters can be found elsewhere (Bartnik et al., Reference Bartnik, Wachulak, Fiedorowicz, Fok, Jarocki and Szczurek2014; Bartnik et al., Reference Bartnik, Wachulak, Fok, Węgrzynski, Fiedorowicz, Skrzeczanowski, Pisarczyk, Chodukowski, Kalinowska, Dudzak, Dostal, Krousky, Skala, Ullschmied, Hrebicek and Medrik2015b).
As mentioned above, time-resolved spectral measurements, due to very low intensity of the EUV emission from the low-temperature microplasmas, were not possible. The detection system, prepared for the temporal measurements of the EUV emission, allowed to perform spectrally integrated measurements. As can be noticed from Figure 3, spectral distributions of the EUV emission in all cases are ranging from the wavelength λ ≈ 20 nm to λ ≈ 75 nm, which corresponds to a transmission window of a thin Al foil. Such foil with a thickness of 250 nm was thus used as an EUV filter, indicated in Figure 2, for spectral selection of the radiation to be detected.
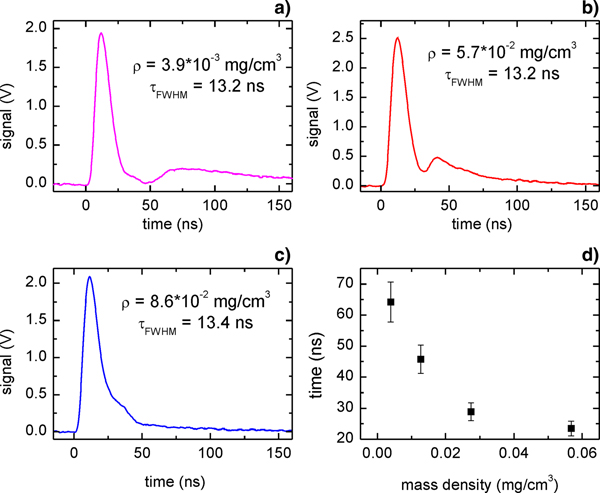
Temporal measurements of the EUV emission from microplasmas created in helium were performed for different gas densities, from ρ ≈ 3.6·10−3 mg/cm3 (~2% He density under atmospheric pressure) to ρ ≈ 8.6·10−2 mg/cm3 (~50% He density under atmospheric pressure). The AXUV20HS1 detector was reversely biased with a voltage of 30 V. The most characteristic time profiles of the EUV signals are presented in Figure 4a–4c. It can be noticed that the time profiles are composed of at least two peaks. In case of the first and the second profiles (Fig. 4a,b) these peaks are well separated, in case of the last one they are overlapping. Apart from that, amplitude of the first peak in all cases is a few times higher compared with the second one. Its time duration in all cases is almost the same FDHM ≈ 13.2–13.4 ns, which is comparable to the driving EUV pulse. The second peak is significantly wider: FDHM ≈ 71 ns for the first profile (Fig. 4a) and FDHM ≈ 34 ns. The time separation between the maxima is also decreasing with the gas density. The corresponding dependence is presented in Figure 4d. It should be also pointed out that in case of the profile recorded for the lowest gas density (Fig. 4a) an additional peak of low intensity can be seen just after the first strong peak, at the time interval 25–50 ns.

Fig. 4. Time profiles of the EUV emission from microplasmas created in He gas of various densities: (a) ρ ≈ 3.9·10−3 mg/cm3, (b) ρ ≈ 5.7·10−2 mg/cm3, (c) ρ ≈ 8.6·10−3 mg/cm3, (d) time separation between maxima, corresponding to peaks forming time profiles of the EUV pulses, versus the gas density.
Similar measurements were performed also for microplasmas created in neon. Gas densities were varied from ρ ≈ 10−2 mg/cm3 (~1% Ne density under atmospheric pressure) to ρ ≈ 0.17 mg/cm3 (~20% Ne density under atmospheric pressure). The results are presented in Fig. 5. As can be noticed, time profiles of the EUV emission are composed of two partially overlapping peaks marked as 1 and 2. An amplitude of the first peak is an order of magnitude higher, their time separations are similar. Unlike for helium, time duration of the first peak is changing with the gas density within a range of approximately FDHM ≈ 12.3–13.3 ns. The corresponding dependence is presented in Figure 5d. In all cases after the signal decrease at the time of approximately 45–50 ns, there is again some small signal increase.

Fig. 5. Time profiles of the EUV emission from microplasmas created in Ne gas of various densities: (a) ρ ≈ 9.9·10−3 mg/cm3, (b) ρ ≈ 9.1·10−2 mg/cm3, (c) ρ ≈ 1.7·10−1 mg/cm3, (d) full duration at half maximum of the EUV pulses, versus the gas density.
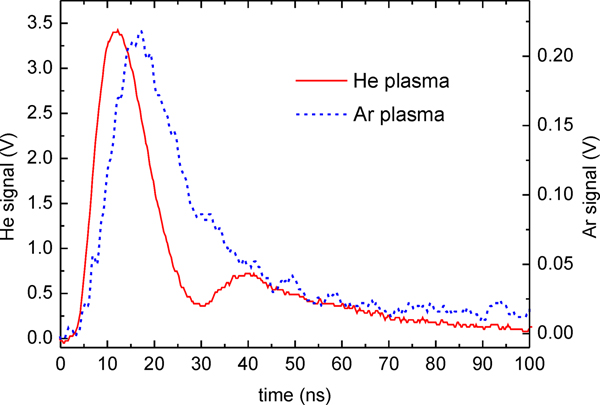
In case of microplasmas created in argon, the EUV emission was an order of magnitude lower. The corresponding signal is thus much more noisy, similarly as the spectrum that was shown in Figure 3c. Nevertheless, some characteristic differences between signals obtained for Ar and He plasmas can be indicated. In Figure 6, examples of these signals are presented. It can be noticed that there are three significant differences: the Ar signal maximum is shifted by approximately 5 ns in relation to the He signal, no more than one peak can be distinguished, the FDHM is significantly larger compared with the He time profile, FDHM ≈ 18.4 ns. Gas densities were varied from ρ ≈ 0.02 mg/cm3 (~1% Ar density under atmospheric pressure) to ρ ≈ 0.2 mg/cm3 (~10% Ar density under atmospheric pressure). Within this density range, time profiles were very similar. Only the signal amplitude for the lowest density decreased 1.5 times.

Fig. 6. Time profiles of the EUV emission from microplasmas created in He and Ar gases.
Discussion of the results
Majority of the EUV photons delivered by the LPP EUV source equipped with the ellipsoidal collector have energies from the range of approximately 60–150 eV with a spectral maximum at ~110 eV. Such energies are sufficient for ionization of any atom or molecule. Ionization potentials of He, Ne, and Ar atoms are 24.59, 21.56, and 15.76 eV (Kelly, Reference Kelly1987), respectively. In all cases, photoelectrons released due to photoionization events have sufficient energy for further ionization or excitation. In the extreme case, a single photon with the energy of 110 eV has enough energy to ionize up to four He, five Ne, or six Ar atoms. In case of maximum gas densities, absorption of these photons, in the gas layer of 2 mm, ranges from ~50% (Ar) to ~97% (Ne) (http://www.cxro.lbl.gov/). Taking into account the EUV fluence in the focal spot ~0.4 J/cm2 (2·1016 photons/cm2), the number of photoelectrons per cm3 can be estimated to the value 1017/cm3. Assuming further ionization by the electron impact, this value can be in an extreme case five times higher. Of course it is only rough estimation assuming that all photons have energies of 110 eV and the gas of near atmospheric density. In fact, from our earlier studies, electron densities measured in this experimental system reached the values from the range 1016–1017/cm3. These electrons can either excite or ionize He atoms or single-charged ions losing their energies in a few collisional events. Average time between inelastic collisions can be estimated based on a corresponding cross-section (σ), electron velocity (v e), and atomic density (n He), according to the formula τ = (n He·σ·v e)−1. Taking into account the atomic density between 1017 and 1019/cm3, a cross-section for ionization of He atoms by electrons with energy 85 eV σ ≈ 3.5·10−17 cm2 (Ralchenko et al., Reference Ralchenko, Janev, Kato, Fursa, Bray and de Heer2008) and v e ≈ 5.5·108 cm/s, the time would have the value from a range τ = 5·10−12 to 5·10−10 s. In case of excitation of He atoms to the level 1s 2–1s2p, this time is approximately three times longer. For smaller energies, these times are a little bit longer, but still of the order of 1 ns. It means that within a short time, much shorter compared to the driving EUV pulse, electrons released due to the photo- and electron impact ionization lose their energy below the ionization threshold. On the other hand, Einstein coefficients for radiative transitions corresponding to the most intense lines 1s–2p (2S–2P°), 1s–3p (2S–2P°), and 1s 2–1s2p (1S–1P°) are 1·1010/s, 2.67·109/s and 1.86·109/s, respectively (Verner et al., Reference Verner, Verner and Ferland1996). It means that the radiative decay of these lines is also much shorter compared to the driving EUV pulse. In this case, all processes connected with photoionization followed by ionization and excitation by photoelectrons should stop within a short time after termination of the driving pulse. This in correspondence with the first peak of the time profile is shown in Figure 4a,b. The question is about an origin of the second wide peak.
It should be pointed out that during the gas irradiation, by the driving EUV pulse, large amount of ions is being created. Shortly after the phase with intense ionization and excitation by the EUV photons and photoelectrons, energies of electrons drop below the excitation energy to the lowest excited state (1s2s). On the other hand, electrons can still have relatively high averaged energy, below 21 eV, but are not thermalized. As a result of their thermalization, 10–30% of electrons can gain energy exceeding the excitation threshold. Additionally, recombination of ions created in the non-thermal phase results in excited states. In case of He ions, the recombination rate has at least three orders of magnitude lower value compared to electron impact ionization by photoelectrons (Pequignot et al., Reference Pequignot, Petitjean and Boisson1991). It is thus not important during the ionization phase but becomes significant later. Excited states created by thermalized electrons and due to the recombination process de-excite, emitting photons detected as the second wide peak clearly visible in Figure 4a,b. Efficiencies of excitation and recombination processes increase with electron and ion density. It is the reason that the smaller density, the longer EUV emission time (wide second peak, long separation between peaks).
In case of plasmas induced in neon and argon, the situation is much more complicated, due to a large amount of electrons in outer shells. In case of Ne plasmas most of the radiation is emitted within a time comparable to the driving EUV pulse. What is interesting, FDHM of the first peak is decreasing with increase of the density. It is somewhat similar to the narrowing of the second peak in case of He plasma. In this case, however, it concerns the phase with intense ionization by the EUV photons and photoelectrons. Similarly to He plasma, there is the EUV intensity minimum at a time of approximately 45–50 ns and the weak emission increase after that time. Its origin is probably the same as in case of the He plasma. The question is about the feature marked in Figure 5 as “2”, corresponding to the EUV emission, just after the end of the photoionization phase. It can concern radiative decay of states with relatively long life times, excited by non-thermal electrons, released during this phase. It should be pointed out that decay times for spontaneous emission of Ne I lines are even two orders of magnitude longer compared with the most intense Ne II lines, 2–20 ns. It means that these lines can be emitted even 20 ns after excitation, forming the feature “2”.
Quite different is the emission profile obtained for Ar plasmas. In this case, no pulse structure with multipeaks was detected. On the other hand, the FDHM of the typical profile is much wider, compared to the driving EUV pulse and the EUV emission from plasmas created in He or Ne. It is connected with a large amount of possible transitions with different cross-sections for ionization, excitation, and probabilities of spontaneous emission. In this case, the emission phase corresponding to processes induced by the non-thermal electrons passes smoothly to the phase with thermalized electrons. It results with long decay of the EUV emission.
Summary
In this work, the EUV detection system, based on the specialized paraboloidal collector, and the AXUV20HS1 detector, sensitive for the EUV radiation, was used for temporal measurements of the EUV emission from low-temperature microplasmas created in He, Ne, and Ar gases. It was demonstrated that the time duration of EUV emission from these plasmas is much longer compared to the driving EUV pulse. There are significant differences between profiles of the detected signals. In case of Ar plasmas, the signal reaches its maximum and is falling down relatively slowly, without any characteristic features. In case of He plasmas, the EUV radiation is emitted in two portions: the first one, dominated by photoionization and collisional processes driven by non-thermal electrons, the second one, connected with creation of excited states by thermalized electrons and radiative recombination. In case of plasmas induced in neon, three phases of the EUV emission can be distinguished. In all cases, the time duration of the EUV emission exceeds 100 ns, which is several times longer compared to the ionizing EUV pulse. In case of plasmas induced in neon and helium, profiles of the EUV emission depend on the gas density. In case of argon, such dependence was not revealed.
Author ORCIDs
Andrzej Bartnik, 0000-0002-7555-8426.
Acknowledgements
This work was supported by the National Science Centre, Poland, grant agreement no. UMO-2016/21/B/ST7/02225, and partially by European Union's Horizon 2020 Programme (LASERLAB-EUROPE) grant agreement no. 654148.