1. INTRODUCTION
Shock ignition (SI) is a novel concept of inertial confinement fusion (Scherbakov, Reference Scherbakov1983; Betti et al., Reference Betti, Zhou, Anderson, Perkins, Theobald and Solodov2007) that promises achieving a high energy gain with relatively simple targets and laser driver energy lower than in the case of the conventional hot spot ignition scheme. Just like in the fast ignition approach, the target compression is separated from the target ignition. However, in SI both these processes are driven by a single, properly shaped laser pulse. A multi-ns low-intensity (~1014–1015 W/cm2) part of the laser pulse drives the compression and its short (~0.2–0.5 ns) high-intensity (~1016 W/cm2) part (spike) generates a strong convergent shock that ignites the compressed fuel at the stagnation phase.
Recent hydrodynamic simulations show that SI is a relatively robust approach with regard to hydrodynamic instabilities, and that a significant energy gain (~100) could be achieved with as little as ~300 kJ of ultraviolet laser energy (Betti et al., Reference Betti, Zhou, Anderson, Perkins, Theobald and Solodov2007; Perkins et al., Reference Perkins, Betti, LaFortune and Williams2009; Ribeyre et al., Reference Ribeyre, Schurtz, Lafon, Galera and Weber2009; Schmitt et al., Reference Schmitt, Bates, Obenschain, Zalesak and Fyfe2010; Lafon et al., Reference Lafon, Ribeyre and Schurtz2013; Atzeni et al., Reference Atzeni, Ribeyre, Schurtz, Schmitt, Canaud, Betti and Perkins2014). However, to produce plasma ablation pressure greater than ~300 Mbar needed for generation of a shock sufficiently strong to ignite the fuel (Betti et al., Reference Betti, Zhou, Anderson, Perkins, Theobald and Solodov2007; Atzeni et al., Reference Atzeni, Ribeyre, Schurtz, Schmitt, Canaud, Betti and Perkins2014), the laser spike intensity has to be high, above the threshold for the nonlinear interaction of the laser pulse with large scale plasma produced by the multi-ns (compressing) part of the pulse. In this context, the most important nonlinear processes are: two plasmon decay (TPD), stimulated Raman (SRS) or Brillouin (SBS) scattering and filamentation instability (Kruer, Reference Kruer1988; Klimo et al., Reference Klimo, Weber, Tikhonchuk and Limpouch2010; Atzeni et al., Reference Atzeni, Ribeyre, Schurtz, Schmitt, Canaud, Betti and Perkins2014). They can lead to a significant increase in the total light reflectivity and to the transformation of a part of laser energy into fast electrons that can preheat the fuel as well as keep the laser absorption far away from the critical surface. Though the preheating of precompressed fuel by fast electrons is here a less important issue than in conventional central ignition (the igniting spike is applied when the areal density of the fuel is large enough to shield itself from fast electrons of energy below ~100 keV (Betti et al., Reference Betti, Theobald, Zhou, Anderson, McKenty, Skupsky, Shvarts, Goncharov, Delettrez, Radha, Sangster, Stoeckl and Meyerhofer2008; Perkins et al., Reference Perkins, Betti, LaFortune and Williams2009) and the fast electron production may actually raise the ignitor efficiency (Perkins et al., Reference Perkins, Betti, LaFortune and Williams2009; Gus'kov et al., Reference Gus'kov, Ribeyre, Touati, Feugeas, Nicolai and Tikhonchuk2012)), the above phenomena can considerably decrease the igniting shock parameters and disturb the transport of energy to a hot spot. These issues have been investigated in several experiments carried out in planar geometry (Baton et al., Reference Baton, Koenig, Brambrink, Schlenvoigt, Rousseaux, Debras, Laffite, Loiseau, Philippe, Ribeyre and Schurtz2012; Koester et al., Reference Koester, Antonelli, Atzeni, Badziak, Baffigi, Batani, Cecchetti, Chodukowski, Consoli, De. Cristoforetti, Angelis, Folpini, Gizzi, Kalinowska, Krousky, Kucharik, Labate, Levato, Liska, Malka, Maheut, Marocchino, Nicolai, O'Dell, Parys, Pisarczyk, Raczka, Renner, Rhee, Ribeyre, Richetta, Rosinski, Ryc, Skala, Schiavi, Schurtz, Smid, Spindloe, Ullschmied, Wolowski and Zaras2013; Hohenberger et al., Reference Hohenberger, Theobald, Hu, Anderson, Betti, Boehly, Casner, Fratanduono, Lafon, Meyerhofer, Nora, Ribeyre, Sangster, Schurtz, Seka, Stoeckl and Yaakobi2014; Pisarczyk et al., Reference Pisarczyk, Gus'kov, Kalinowska, Badziak, Batani, Antonelli, Folpini, Maheut, Baffigi, Borodziuk, Chodukowski, Cristoforetti, Demchenko, Gizzi, Kasperczuk, Koester, Krousky, Labate, Parys, Pfeifer, Renner, Smid, Rosinski, Skala, Dudzak, Ullschmied and Pisarczyk2014; Batani et al., Reference Batani, Antonelli, Atzeni, Badziak, Baffigi, Chodukowski, Consoli, Cristoforetti, De Angelis, Dudzak, Folpini, Giuffrida, Gizzi, Kalinowska, Koester, Krousky, Krus, Labate, Levato, Maheut, Malka, Margarone, Marocchino, Nejdl, Nicolai, O'Dell, Pisarczyk, Renner, Rhee, Ribeyre, Richetta, Rosinski, Sawicka, Schiavi, Skala, Smid, Spindloe, Ullschmied, Velyhan and Vinci2014a) and also in the spherical one (Theobald et al., Reference Theobald, Betti, Stoeckl, Anderson, Delettrez, Glebov, Goncharov, Marshall, Maywar, McCrory, Meyerhofer, Radha, Sangster, Seka, Shvarts, Smalyuk, Solodov, Yaakobi, Zhou, Frenje, Li, Seguin, Petrasso and Perkins2008; Nora et al., Reference Nora, Theobald, Betti, Marshall, Michel, Seka, Yaakobi, Lafon, Stoeckl, Delettrez, Solodov, Casner, Reverdin, Ribeyre, Vallet, Peebles, Beg and Wei2015). However, due to the differences in the experimental conditions, the results of these experiments are not fully compatible with respect to both the characteristics of the ablated plasma and the shocks generated, and, moreover, the range of laser intensities within which they were investigated in the individual experiments was rather narrow. These results were thoroughly described and compared in a recent paper by Batani et al. (Reference Batani, Baton, Casner, Depierreux, Hohenberger, Klimo, Koenig, Labaune, Ribeyre, Rousseaux, Schurtz, Theobald and Tikhonchuk2014b). Despite the above papers the SI-related research is still in its initial stage and many underlying issues require further detailed studies. In particular, it concerns scaling of various parameters of ablated plasma and shock generation in dependence on intensity of the shock driving laser pulse.
The aim of the experiment described in this paper was a systematic study of dependence of characteristics of the plasma ablated from a low-Z (CH) planar target irradiated by a sub-nanosecond, short-wavelength (0.438 µm) laser pulse as well as of the parameters of the shock generated in the target on the laser pulse intensity within the intensity range of 2 × 10¹⁵–1016 W/cm2 relevant to the shock ignition. The studied dependences relate to the plasma temperature, the hot electrons yield and temperature, the plasma absorption, and the plasma ion flux parameters, as well as the pressure of the generated shock and they were determined for various scale-lengths of preplasma produced on the target by an auxiliary beam. The experiment was performed at the kilojoule Prague Asterix Laser System (PALS) laser facility (Jungwirth et al., Reference Jungwirth, Cejnarova, Juha, Kralikova, Krasa, Krousky, Krupickova, Laska, Masek, Mocek, Pfeifer, Präg, Renner, Rohlena, Rus, Skala, Straka and Ullschmied2001) using the 3ω, 250 ps laser pulse of intensity up to 1016 W/cm2 as a main beam driving the shock and the 1ω, 300 ps pulse of intensity of 7 × 10¹³ W/cm2 as the auxiliary beam producing the preplasma. Parameters of the shock generated in a Cl doped CH target by the intense 3ω laser pulse were inferred by numerical hydrodynamic simulations from the measurements of craters produced by the shock in the massive Cu target behind the CH layer. Characteristics of the plasma ablated from the plastic target were measured with the use of 3-frame interferometry, ion diagnostics, an X-ray spectrometer, and K α imaging.
2. EXPERIMENTAL SETUP
The experiment was performed at the PALS iodine laser facility (Jungwirth et al., Reference Jungwirth, Cejnarova, Juha, Kralikova, Krasa, Krousky, Krupickova, Laska, Masek, Mocek, Pfeifer, Präg, Renner, Rohlena, Rus, Skala, Straka and Ullschmied2001) in Prague. A scheme of the experimental setup is presented in Figure 1. The 3ω (λ = 0.438 µm) PALS laser beam of 250 ps pulse duration, energy up to ~200J and intensity up to ~1016 W/cm2 irradiated a double-layer massive target consisting of a 25- or 40 um thick CH(Cl) (parylene – C) layer (mimicking the fusion target ablator) and 2 mm thick Cu layer. To imitate conditions predicted for the SI scenario, the main (3ω) laser beam was preceded by the 1ω (λ = 1.315 µm), 300 ps auxiliary beam (prepulse) of the fixed energy (≈50J) and intensity (~7 × 10¹³ W/cm2) which irradiated the target at an angle of 30° from the target normal and produced preplasma on the CH(Cl) layer surface. Both beams were equipped with random phase plates to produce possibly homogeneous radiation intensity distribution with full width at half maximum (FWHM) equal to ~100 µm for the main beam (Fig. 2) and ~700 µm for the auxiliary beam. The time delay between the beams Δt was varied in the range 0–1.2 ns which enabled us to change the preplasma thickness L pre. The main laser beam irradiating the target, either under the presence or the absence of the preplasma on its surface, created a shock in the CH(Cl) layer which, in turn, produced crater in the Cu layer. To estimate the shock pressure in the plastic layer, the interaction of the main beam with the target and the crater formation were numerically modeled using the hydrodynamic two-dimensional (2D) PALE code (Kapin et al., Reference Kapin, Kucharik, Limpouch, Liska and Vachal2008; Liska et al., Reference Liska, Kucharik, Limpouch, Renner, Vachal, Bednarik, Velechovsky, Fort, Furst, Halama, Herbin and Hubert2011) and results of the numerical simulations were compared with measurements of the crater volume and depth. Moreover, for selected laser intensities we were able to compare the shock pressure estimation based on the crater measurements with that obtained from the shock breakout time measurements performed at PALS for similar experimental conditions (Koester et al., Reference Koester, Antonelli, Atzeni, Badziak, Baffigi, Batani, Cecchetti, Chodukowski, Consoli, De. Cristoforetti, Angelis, Folpini, Gizzi, Kalinowska, Krousky, Kucharik, Labate, Levato, Liska, Malka, Maheut, Marocchino, Nicolai, O'Dell, Parys, Pisarczyk, Raczka, Renner, Rhee, Ribeyre, Richetta, Rosinski, Ryc, Skala, Schiavi, Schurtz, Smid, Spindloe, Ullschmied, Wolowski and Zaras2013) and modeled by the 2D DUED code (Atzeni et al., Reference Atzeni, Schiavi, Califano, Cattani, Cornolti, Del Sarto, Liseykina, Macchi and Pegoraro2005). Characteristics of the plasma ablated from the plastic layer were measured with the use of 3-frame interferometry, X-ray spectroscopy, K α imaging, and ion diagnostics. Systematic measurements of the crater and plasma parameters were performed using the 3ω beam of intensity varied by the change of the beam energy in the range (2 × 10¹⁵–1016) W/cm2 and for the case of the preplasma absence (L pre = 0) or the preplasma presence at Δt = 0.6 ns or 1.2 ns. As basic target in these measurements we used the massive Cu target coated with the CH(Cl) plastic layer of 25 mm thickness (except the case of K α imaging where the 40 mm thick plastic layer was also used). In some laser shots, to examine the effect of the laser wavelength on the crater formation, we used the 1ω PALS beam as a main beam producing shock instead of the 3ω beam.

Fig. 1. Scheme of the experimental set-up.

Fig. 2. 3D distribution (a) and cross-section (b) of the main beam intensity in the “best focus” plane.
3. MEASUREMENTS OF ABLATED PLASMA CHARACTERISTICS
This section presents results of measurements of various characteristics of the plasma ablated from the CH(Cl) layer using optical interferometry, X-ray spectroscopy, and ion diagnostics. A special attention is paid to the dependence of these characteristics on the main (3ω) laser beam intensity and the influence of the preplasma produced by the auxiliary (1ω) beam on these characteristics.
3.1. Measurements of Plasma Expansion by Interferometry
To characterize the density profile and the expansion velocity of plasma produced on the CH(Cl) layer by the auxiliary beam (the preplasma) as well as by the main beam or both beams together we used a 3-frame interferometric system employing a frequency-doubled (λ = 0.657 mm) PALS probe beam. Figure 3 presents typical plasma spatial profiles visualized via isolines of electron density (n e) distributions for the preplasma (Fig. 3a) and the plasma produced by both the auxiliary beam (prepulse) and the main beam at the delay between the beams equal to Δt = 0.6 ns (Fig. 3b). A dependence of the thickness (measured at n e = 1019 cm−3) of the plasma produced by the auxiliary beam and by both beams on the plasma expansion time is shown in Figure 4. The preplasma front of n e = 1019 cm−3 moves with roughly constant velocity v pre ≈ 6 × 107 cm/s and, as a result, the preplasma thickness L pre depends almost linearly on the expansion time. The velocity of the plasma produced by both beams with the main beam energy E m ≈ 200J and intensity ≈ 9 × 10¹⁵ W/cm2 is higher than v pre and reaches values ~(1.2–1.5) × 108 cm/s. For both the cases plasma expands mostly in the direction normal to the target surface, however a radial expansion is also remarkable (it is a factor ~ 2 slower than the expansion along the normal). The electron density profile along the target normal is not the exponential one (as usually assumed in theoretical considerations) and the profile changes in time. Based on the results presented in Figure 4 we were able to determine the effective preplasma thickness (at n e = 1019 cm−3) at the moment when the main beam hits the preplasma. For the delays between the main and the auxiliary beam used in the experiment, namely Δt = 0.6 ns and 1.2 ns, the thickness was equal to L pre ≈ 0.35 and 0.7 mm, respectively. These thicknesses are the same order of magnitude as predicted for SI experiments (Batani et al., Reference Batani, Baton, Casner, Depierreux, Hohenberger, Klimo, Koenig, Labaune, Ribeyre, Rousseaux, Schurtz, Theobald and Tikhonchuk2014b), however they were determined for significantly lower electron densities.

Fig. 3. The electron isodensitograms and the space profiles of electron distributions for preplasma (a) and for ablated plasma produced by the auxiliary laser beam together with the main 3ω beam at the delay between the beams Δt = 0.6 ns.

Fig. 4. The ablated plasma thickness at n e ≈ 1019 cm−3 as a function of the plasma expansion time. Time t = 0 corresponds to the moment when the laser prepulse irradiates the target surface at maximum intensity.
3.2. X-ray Spectroscopy and Determination of Plasma Temperature
To determine the electron temperature T of the ablated CH(Cl) plasma, X-ray spectrometry and estimations based on ion energy measurements (Section 3.4) were used. In the first method, a high-resolution X-ray spectrometer using a spherically bent mica crystal was applied. The spectrometer was aligned to reflect X-rays within the spectral range of 3.5–4.5 Å including line emission from H-like, He-like and Li-like Cl ions. The temperature and corresponding density of plasma ρ were determined by fitting the measured X-ray spectrum to that calculated with the collisional-radiative code Prismspect (MacFarlane et al., Reference MacFarlane, Golovkin, Wang, Woodruff and Pereyra2007). For the preplasma, the best fit of the measured and calculated spectrum was obtained for T ≈ 175 eV and ρ ≈ 5 mg/cm3. This temperature is by an order of magnitude lower than that envisaged for real SI experiments.
A dependence of the plasma temperature and density on the main laser beam intensity I L, measured at the target surface and 150 mm from the surface for different preplasma thicknesses, is presented in Figures 5 and 6. As expected, the density and mostly also the temperature of the plasma are lower for a longer distance from the target surface. The plasma temperature depends on the laser intensity very weakly and the internal energy of the plasma increases (rather moderately) with I L only due to an increase in the plasma density. The effect of the preplasma thickness on the plasma temperature and internal energy is small (negligible within the experimental error).

Fig. 5. Temperature of plasma produced by the main 3ω pulse (L pre = 0) and by the main pulse with the prepulse at the target surface (z = 0) and 150 µm from the surface as a function of the main pulse intensity.

Fig. 6. Density of plasma produced by the main 3ω pulse (L pre = 0) and by the main pulse together with the prepulse at the target surface (z = 0) and 150 µm from the surface as a function of the main pulse intensity.
3.3. K α Photons Measurements
To estimate parameters of hot electrons produced in the ablated plastic plasma, measurements of Cu K α emission induced by these electrons were performed. The flux of K α photons was measured using a charge-coupled device working in a single-photon regime (Labate et al., Reference Labate, Köster, Levato and Gizzi2012) while the size of the K α emitting region was measured through 2D imaging by means of a spherically bent quartz (422) crystal set up as a monochromator in imaging mode (Koch et al., Reference Koch, Aglitskiy, Brown, Cowan, Freeman, Hatchett, Holland, Key, MacKinnon, Seely, Snavely and Stephens2003). More details about these measurements can be found in (Koester et al., Reference Koester, Antonelli, Atzeni, Badziak, Baffigi, Batani, Cecchetti, Chodukowski, Consoli, De. Cristoforetti, Angelis, Folpini, Gizzi, Kalinowska, Krousky, Kucharik, Labate, Levato, Liska, Malka, Maheut, Marocchino, Nicolai, O'Dell, Parys, Pisarczyk, Raczka, Renner, Rhee, Ribeyre, Richetta, Rosinski, Ryc, Skala, Schiavi, Schurtz, Smid, Spindloe, Ullschmied, Wolowski and Zaras2013). Here we would like to present only the effect of the 3ω laser beam intensity and the preplasma thickness on production of K α photons being a direct signature of hot electron generation. This is illustrated in Figure 7. The number of K α photons clearly increases with the laser intensity however the influence of L pre on this number is not sufficiently strong to be distinguished with respect to a relatively large dispersion of the experimental results. Based on the K α measurements at CH(Cl)/Cu targets with different CH(Cl) layer thicknesses (25 and 40 µm), we were able to determine the penetration depth of the hot electrons in the plastic layer (equal to ~27 µm). At the highest laser intensities, the estimated temperature of forward emitted hot electrons (i.e., electrons emitted towards the Cu target) reaches T h~50 keV and the energy conversion efficiency from the laser beam to the hot electrons ηh was below 1% (Koester et al., Reference Koester, Antonelli, Atzeni, Badziak, Baffigi, Batani, Cecchetti, Chodukowski, Consoli, De. Cristoforetti, Angelis, Folpini, Gizzi, Kalinowska, Krousky, Kucharik, Labate, Levato, Liska, Malka, Maheut, Marocchino, Nicolai, O'Dell, Parys, Pisarczyk, Raczka, Renner, Rhee, Ribeyre, Richetta, Rosinski, Ryc, Skala, Schiavi, Schurtz, Smid, Spindloe, Ullschmied, Wolowski and Zaras2013). The estimated value of ηh was smaller than that measured recently in (Hohenberger et al., Reference Hohenberger, Theobald, Hu, Anderson, Betti, Boehly, Casner, Fratanduono, Lafon, Meyerhofer, Nora, Ribeyre, Sangster, Schurtz, Seka, Stoeckl and Yaakobi2014) for lower laser intensity (1.4 × 10¹⁵ W/cm2 at λ = 0.35 µm and τL ≈ 1 ns) where ηh approached 2%. One of possible reasons for this difference is more intense (~2 × 10¹⁴ W/cm2) and longer (≈1 ns) prepulse used in (Hohenberger et al., Reference Hohenberger, Theobald, Hu, Anderson, Betti, Boehly, Casner, Fratanduono, Lafon, Meyerhofer, Nora, Ribeyre, Sangster, Schurtz, Seka, Stoeckl and Yaakobi2014) resulting in more extended preplasma, that is, at conditions favorable for the development of parametric instabilities induced by the high-intensity pulse such as TPD and SRS.

Fig. 7. Number of K α photons emitted from the CH(Cl)/Cu targets irradiated by the main 3ω pulse (L pre = 0) and by the main pulse together with the prepulse as a function of the main pulse intensity.
3.4. Ion Diagnostic
Ion diagnostic is a useful tool for investigation of ablated plasmas enabling not only a direct measurement of parameters of ion fluxes emitted from the plasma but also allowing to obtain information about other plasma characteristics such as temperature, fraction of the laser energy absorbed in the plasma or the temperature of generated hot electrons. This information is inferred from ion measurements using simple models, thus limiting the precision of the numerical data obtained.
In the experiment, eight ion charge collectors (ICs) (Woryna et al., Reference Woryna, Parys, Wołowski and Mróz1996; Láska et al., Reference Láska, Jungwirth, Králiková, Krása, Pfeifer, Rohlena, Skála, Ullschmied, Badziak, Parys, Wolowski, Woryna, Gammino, Torrisi, Boody and Hora2003) and a SiC detector (Torrisi et al., Reference Torrisi, Foti, Giuffrida, Puglisi, Wolowski, Badziak, Parys, Rosinski, Margarone, Krasa, Velyhan and Ullschmied2009) were used to record ions emitted from the ablated CH(Cl) plasma. The ICs were situated at different angles (from 0° to 72°) with respect to the CH(Cl)/Cu target normal (Fig. 1) at the distance of 40 cm from the target. The SiC detector was placed 164 cm from the target at the angle of 30° with respect to the target normal. This detector was sensitive primarily to fast (high-energy) ions (Torrisi et al., Reference Torrisi, Foti, Giuffrida, Puglisi, Wolowski, Badziak, Parys, Rosinski, Margarone, Krasa, Velyhan and Ullschmied2009), as apposite to ICs the sensitivity of which is almost independent on the ion energy and an amplitude of the IC ion signal is proportional to the ion flux current (Woryna et al., Reference Woryna, Parys, Wołowski and Mróz1996; Badziak et al., Reference Badziak, Makowski, Parys, Ryc, Wolowski, Woryna and Vankov2001). As a result, the SiC detector recorded mainly fast ions (being a signature of presence of hot electrons in the plasma), while the ICs recorded mostly the so called thermal (moderate-energy) ions (Badziak et al., Reference Badziak, Makowski, Parys, Ryc, Wolowski, Woryna and Vankov2001) clearly dominating in our experiment.
Figure 8 brings examples of signals recorded by the ICs and the SiC detector for ions emitted from the preplasma (Fig 8a) and from the plasma produced by the prepulse together with the main 3ω pulse (Fig 8b). It can be seen that in case of (pre) plasma produced by the prepulse only, there are no fast ions (hot electrons are not generated) and emission of thermal ions is highly directional with a maximum along the target normal, as demonstrated by the angular distribution of the ion charge density shown on the right-hand side of Figure 8a. This directionality of ion emission results from a large focal spot of the auxiliary beam (the prepulse) which is responsible for a quasi-planar expansion of the produced plasma. In the case of the plasma produced by both beams, we observe a distinct fast ion signal in the SiC record and emission of (thermal) ions in a large angle with the maximum outside the target normal (at ~30°). The number of fast ions, though sufficient to produce the signal in the SiC detector, is small relative to the number of thermal ions since there is no signal corresponding to fast ions in the ICs records. The large-angle ion emission with a clear minimum along the target normal (direction of the 3ω beam propagation) can probably be ascribed to an action of the radial component of ponderomotive forces of the main laser beam in the plasma pushing electrons (which pull ions) in the radial direction (Badziak et al., Reference Badziak, Hora, Woryna, Jabłoński, Laśka, Parys, Rohlena and Wołowski2003). An effect coupled to that can be ponderomotive self-focusing of the main beam in the plasma (Badziak et al., Reference Badziak, Hora, Woryna, Jabłoński, Laśka, Parys, Rohlena and Wołowski2003).

Fig. 8. Exemplary signals from eight ion collectors (placed at various angles in relation to the target normal) and from SiC detector (inset) as well as the ion charge density angular distribution for plasma produced by the prepulse (a) and the prepulse together with the main 3ω pulse (delayed by Δt = 0.6 ns) of energy 186J (b). Q tot – the total charge of emitted ions (from integration of IC signals over time and angles from 0° to 90°).
Figure 9 presents the total energy E tot of ions emitted from the plasma produced by the main beam only (L pre = 0) and by the main beam together with the prepulse as a function of the main pulse intensity. The total ion energy was calculated from the formula:
 $$E_{{\rm tot}} \approx N_{\rm i} \bar E_{\rm i} \approx (\bar A/\bar z)\bar E_{\rm p} Q_{{\rm tot}} $$
where N i is the total number of emitted ions,  $\bar E_{\rm i} $ is the mean ion energy,
  $\bar E_{\rm p} $ is the mean ion energy per nucleon (equal to the mean energy of protons),
  $\bar A$ and
  $\bar z$ are the average ion mass number and charge state, respectively, and Q tot is the total ion charge. Neglecting Cl ions in the ion flux (due to their small number and low velocity relative to H and C ions) and assuming that both H and C are fully ionized (the ablated plasma temperature is high, above 0.5 keV – Fig. 5) , we arrive at
  $\bar A$ ≈ 6.9 and
  $\bar z$ ≈ 3.5 and from the formula (1) we obtain:
 $$E_{{\rm tot}} \left[ J \right] \approx 1.97\bar E_{\rm p} \left[ {keV} \right]\;Q_{{\rm tot}} \left[ {mC} \right]$$
where  $\bar E_{\rm p} $ and Q tot are calculated from the ICs signals (Fig. 8). The plots in Figure 9 show that the total ion energy increases with laser intensity, and at the preplasma absence E tot is clearly smaller than that for the case of the preplasma presence, as could be expected (due to a large volume of the preplasma, the preplasma ions carry similar total charge as the ions produced by the main beam – Fig. 8). Based on the plots of Figure 9, the laser – ions energy conversion efficiency can be calculated using relation ηi=E tot/E L, where E L is the total laser energy (sum of energy of the main beam and the prepulse). A dependence of η i on I L is shown in Figure 10. In the low-Z plasma ions carry ~80–90% of the absorbed laser energy E abs (radiative losses are at or below the level of ~0.1 E abs, Puell, Reference Puell1970, and the energy transferred to the shock is also small, ~0.05 E abs or below it, Guskov et al., Reference Guskov, Kasperczuk, Pisarczyk, Borodziuk, Ullschmied, Krousky, Masek, Pfeifer, Skala and Pisarczyk2007), thus presented plots provide an useful information about the absorption coefficient of the plasma ηa = E abs/E L ≈ (1.1–1.2) ηi. By combining this relation with data shown in the plots, we can conclude that in the case of the preplasma absence (L pre = 0) the absorption coefficient is ~0.5 and under the preplasma presence ηa~0.6–0.7. However, an error of this estimation is relatively large, ~20–30%.

Fig. 9. Total energy of ions emitted from the plasma produced by the main 3ω pulse (L pre = 0) and by the main pulse with the prepulse as a function of the main pulse intensity.

Fig. 10. The laser–ions energy conversion efficiency as a function of the main 3ω pulse intensity for the case of the preplasma absence (L pre = 0) or the preplasma presence (L pre = 0.35 mm or 0.7 mm).
The electron temperature of the plasma at the target surface (in the region where ions are produced) can be estimated from the formula (Badziak et al., Reference Badziak, Makowski, Parys, Ryc, Wolowski, Woryna and Vankov2001; Puell et al., Reference Puell, Neusser and Kaiser1970):
 $$T \approx \bar E_{\rm i} /4(\bar z + 1) \approx \bar A\;\bar E_{\rm p} /4(\bar z + 1)$$
which is valid for isothermal spherical expansion of the plasma. Assuming values  $\bar A$ ≈ 6.9 and
  $\bar z$ ≈ 3.5 calculated earlier, we obtain:
 $$T \approx 0.38\;\bar E_{\rm p} $$
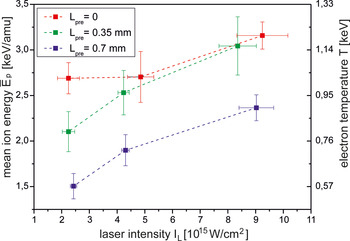
 A dependence of  $\bar E_{\rm p} $ and T on laser intensity is presented in Figure 11. There are a few differences in this dependence relative to the T(I L) dependence obtained from X-ray spectrometry presented in Figure 5. Firstly, the effect of the preplasma on the electron temperature is distinct, especially of the preplasma of larger L pre. Secondly, the temperature increases with the laser intensity, though, the increase is relatively weak. On the other hand, the absolute values of the temperature obtained from the X-ray spectroscopy and the ion diagnostic do not differ too much – the difference varies within the range of 10–30% depending on I L. Possible reasons for this discrepancy can be the application of a very simple model of the plasma expansion and the assumption
  $\bar z$ = const = 3.5 (for the lowest intensities, the value
  $\bar z$ can be slightly lower than 3.5 and, as a result, the temperature can be higher). We also note that X-ray spectroscopy determines the effective plasma parameters weighed by emission rate of diagnostically relevant spectral lines. Based on modeling performed using a combination of the hydrodynamic code MULTI2D (Ramis et al., Reference Ramis, Meyer-ter-Vehn and Ramirez2009) and collisional-radiative solver CRETIN (Scott, Reference Scott2001), the strongest emission of bound–bound transitions used in our x-ray diagnosis corresponds to a time period 100 ps before and 50 ps after the laser maximum. On the other hand, the fast ion spectra are measured long after the laser pulse termination, that is, at steadfast energetic state.

Fig. 11. The mean energy per nucleon of ions emitted from the plasma produced by the main 3ω pulse (L pre = 0) and by the main pulse with the prepulse and the electron temperature of the plasma as a function of the main pulse intensity.
Since fast ions emitted from the ablated plasma are accelerated by electric field generated by hot (suprathermal) electrons, ion measurements can provide information about these electrons. Figure 12 presents typical energy spectra of fast ions (protons) inferred from the SiC signal recorded at laser intensity ~5 × 10¹⁵ W/cm2. Energies of the ions clearly depend on the preplasma scale length and are the highest at L pre = 0 (the preplasma absence). It suggests that also the hot electron temperature T h depends on the preplasma scale length. To estimate this temperature from ion measurements, we used the relation  $\bar E_{\rm f} $ = a T h, where
  $\bar E_{\rm f} $ is the mean energy per fast ion nucleon and a is the number of the value somewhere between 2 and 12 depending on the model (Gitomer et al., Reference Gitomer, Jones, Begay, Ehler, Kephart and Kristal1986; Wilks et al., Reference Wilks, Langdon, Cowan, Roth, Singh, Hatchett, Key, Pennington, MacKinnon and Snavely2001). We used the empirical value a = 4.5 determined from a comparison of the LASNEX code simulations with a set of experimental data from various laboratories (Gitomer et al., Reference Gitomer, Jones, Begay, Ehler, Kephart and Kristal1986; Wilks et al., Reference Wilks, Langdon, Cowan, Roth, Singh, Hatchett, Key, Pennington, MacKinnon and Snavely2001). A dependence of T h (together with
  $\bar E_{\rm f} $) on laser intensity is shown in Figure 13. The temperature of hot electrons increases with I L and achieves the highest values for L pre = 0 when the plasma scale length is small. The origin of theses electrons could be ascribed to resonance absorption (Gus'kov et al., Reference Gus'kov, Demchenko, Kasperczuk, Pisarczyk, Kalinowska, Chodukowski, Renner, Smid, Krousky, Pfeifer, Skala, Ullschmied and Pisarczyk2014; Pisarczyk et al., Reference Pisarczyk, Gus'kov, Kalinowska, Badziak, Batani, Antonelli, Folpini, Maheut, Baffigi, Borodziuk, Chodukowski, Cristoforetti, Demchenko, Gizzi, Kasperczuk, Koester, Krousky, Labate, Parys, Pfeifer, Renner, Smid, Rosinski, Skala, Dudzak, Ullschmied and Pisarczyk2014), which becomes possible at normal laser incidence because of the large focusing cone (f/2 optics) and the small focal spot that result in a curved critical surface of the produced plasma. Figure 14 presents the SiC signal amplitude as a function of the laser intensity. In general, an amplitude of the SiC signal is proportional to the product of the ion number N f and the ion energy, so the observed increase in the amplitude with I L can be caused by an increase in both N f and E f. In the presented plots, an increase in the amplitude is distinctly faster than an increase in E f with I L (Fig. 13) which suggests that a main reason for the amplitude increase is the growth of the fast ion number. It means that not only the hot electron temperature but also their number increase with the laser intensity. It should be noted that even at the highest laser intensities, the total number of fast ions (and, as a result, the number of hot electrons) is relatively small – the total charge of fast ions is below of 1% of the total charge of thermal ions. Comparing the presented results with those obtained with the use of K α imaging (see Section 3.3) we emphasize that the ion measurements and the K α measurements relate actually to different populations of hot electrons. In the first case, the measurements concern backward emitted hot electrons (against direction of the laser beam propagation) while in the second case they relate to forward streaming ones. Since generation of hot electrons in the plasma is not ideally isotropic, parameters of hot electron fluxes emitted backward and forward can differ. The total energy of both backward and forward emitted hot electrons are relatively small, ~1% of the laser energy or below. Consequently, an impact of these electrons on parameters of shocks generated in the CH(Cl)/Cu target is expected to be small.

Fig. 12. Energy spectra of fast ions emitted from the plasma produced by the main 3ω pulse (L pre = 0) and by the main pulse together with the prepulse.

Fig. 13. The mean energy per nucleon of fast ions and the hot electron temperature as a function of the main laser pulse intensity for various preplasma thicknesses L pre.

Fig. 14. The amplitude of SiC signal as a function of the main laser pulse intensity for various preplasma thicknesses L pre.
4. INVESTIGATION OF LASER-DRIVEN SHOCKS
To assess the pressure of the shock generated by the main 3ω laser pulse in the plastic layer of the CH(Cl)/Cu massive target we measured dimensions of craters produced by this shock in the Cu (thick) layer. In the same time, the interaction of the laser pulse (with or without the prepulse) with the target, including generation of the shock wave and the crater formation was modeled by numerical simulations using 2D hydrodynamic PALE code (Kapin et al., Reference Kapin, Kucharik, Limpouch, Liska and Vachal2008; Liska et al., Reference Liska, Kucharik, Limpouch, Renner, Vachal, Bednarik, Velechovsky, Fort, Furst, Halama, Herbin and Hubert2011). Based on consistency of crater parameters (volume and depth) obtained from measurements and simulations, the shock pressure in the plastic layer achieved in the experiment could be estimated from results of the simulations.
4.1. Measurements of Craters
To determine the volume and depth of craters produced by the shock in the Cu layer of the CH(Cl)/Cu target we made replicas of the craters and then calculated their parameters according to the procedure described for example, in (Pisarczyk et al., Reference Pisarczyk, Gus'kov, Kalinowska, Badziak, Batani, Antonelli, Folpini, Maheut, Baffigi, Borodziuk, Chodukowski, Cristoforetti, Demchenko, Gizzi, Kasperczuk, Koester, Krousky, Labate, Parys, Pfeifer, Renner, Smid, Rosinski, Skala, Dudzak, Ullschmied and Pisarczyk2014). Pictures of craters and their replicas obtained at three different energies (intensities) of the main 3ω beam (without the prepulse) are presented in Figure 15, while images of craters (and replicas) produced at different preplasma thicknesses at the highest laser intensities are shown in Figure 16. Figure 17 presents quantitative results of measurements of the volumes and depths of craters produced at various intensities of the main beam. In the figure, the results obtained for the 1ω main pulse are also shown. In the case of short-wavelength (3ω) main beam, both the crater volume and the crater depth increase almost linearly with an increase of the beam intensity. Within the measurement error, they do not depend on the preplasma thickness. It suggests that energy and pressure of the shock leaving the plastic layer and creating crater in the Cu layer depend weakly on L pre. For the 1ω main beam, the results are essentially different: The crater volume and depth depend significantly on the preplasma thickness and they are remarkably smaller than those measured for the 3ω beam. This means that a possible increase in the ablation pressure due to hot electron production is small (in spite of a higher efficiency of hot electron generation by the 1ω beam) and their effect cannot compensate for a lower collisional absorption of the long-wavelength beam in the plasma. A possible reason for the strong effect of preplasma on parameters of craters produced by the 1ω-driven shock is a lower total absorption (both collisional and non-collisional) of the 1ω beam in the plasma in the case of the preplasma presence or/and a lower efficiency of the energy transport (including the transport via hot electrons) from the absorption region to the ablation surface. However this issue cannot be settled within performed measurements. It was discussed in more detail in (Pisarczyk et al., Reference Pisarczyk, Gus'kov, Kalinowska, Badziak, Batani, Antonelli, Folpini, Maheut, Baffigi, Borodziuk, Chodukowski, Cristoforetti, Demchenko, Gizzi, Kasperczuk, Koester, Krousky, Labate, Parys, Pfeifer, Renner, Smid, Rosinski, Skala, Dudzak, Ullschmied and Pisarczyk2014).

Fig. 15. Pictures of craters (and their replicas) produced in the Cu massive targets by a shock wave generated in the CH(Cl)25 µm layer by the main (3ω) laser beam of various energies. E pre = 0. E m = 200J corresponds to the main beam intensity of 9 × 10¹⁵ W/cm2.

Fig. 16. Pictures of craters (and their replicas) produced in the Cu massive targets by a shock wave generated in the CH(Cl)25 µm layer by the main (3ω) laser beam at various preplasma thicknesses L pre. E m = 205 ± 6J, E pre = 56J. E m = 200J corresponds to the main beam intensity of 9 × 10¹⁵ W/cm2.

Fig. 17. The volume (a) and depth (b) of craters, produced in the Cu massive target by the shock wave induced in the CH(Cl)25 µm layer by the main 3ω or 1ω laser pulse (L pre = 0) or by the main pulse together with the prepulse, as a function of the main pulse intensity.
4.2. Numerical Simulations of Shock Generation and Crater Formation
The interaction of the 3ω laser pulse with CH(Cl)25 µm/Cu massive target was modeled using 2D Prague arbitrary Lagrangian Eulerian (PALE) code (Kapin et al., Reference Kapin, Kucharik, Limpouch, Liska and Vachal2008; Liska et al., Reference Liska, Kucharik, Limpouch, Renner, Vachal, Bednarik, Velechovsky, Fort, Furst, Halama, Herbin and Hubert2011). The code includes arbitrary Lagrangian Eulerian (ALE) hydrodynamics, flux limited heat conductivity with the Spitzer–Härm conductivity coefficient and ray-tracing laser absorption through inverse bremsstrahlung and resonance mechanisms. The shock generated in the plastic layer by the main laser beam hits the Cu surface and produces a crater in the Cu layer (the crater is defined as the space with evaporated and melted Cu). Parameters of the laser beam correspond to those applied in the experiment. In particular, for the main 3ω beam we assumed Gaussian spatial profile with the width (FWHM) equal to 100 µm (compare Fig. 2). Simulations were performed for the main beam energy of 50J, 100J, and 200J and the 1ω prepulse energy of 60J (or 0). The time delay between the main pulse and the prepulse was assumed to be 0.6 or 1.2 ns.
Figure 18 presents the total laser energy absorbed in the plastic plasma produced either by the main pulse only or by the main pulse with the prepulse as a function of the main pulse intensity. Since the absorbed prepulse energy is constant and equal to about 10J, obviously the main pulse energy absorbed in the plasma in the case of the prepulse absence is slightly higher than that for the case of the prepulse presence. In the first case the absorption coefficient for the main pulse decreases with I L from ~70 to ~60% and in the second case it decreases from ~60 to ~50%. These values are comparable with those obtained from the rough estimates using the ion measurements.

Fig. 18. The total laser energy absorbed in the ablated plasma produced by the main pulse (L pre = 0) or by the main pulse together with the prepulse as a function of the main pulse intensity. Results of 2D numerical simulations.
Dependences of the volumes and depths of craters produced in the Cu layer by the shock generated in the plastic layer on the main pulse intensity are shown in Figure 19. Like in the experiment with the main 3ω beam (Fig. 17), the crater volume and depth depend weakly on I L and the crater volume increases nearly linearly with the intensity. However, absolute values of the crater volume obtained from the simulations are by ~10–20% higher than the measured ones. It suggests that the shock energy and pressure inferred from simulations can also be overestimated relative to the real experimental values however this overestimation should be comparable with that for the crater volume.

Fig. 19. The volume (a) and depth (b) of craters, produced in the Cu massive target by the shock wave induced in the CH(Cl)25 µm layer by the main 3ω laser pulse (L pre = 0) or the main pulse together with the prepulse, as a function of the main pulse intensity. Results of 2D numerical simulations.
A spatial structure of the shock generated in the plastic layer as well as distributions of the pressure and the temperature of the plasma behind the shock front at the moment when the shock is close to the plastic-Cu interface are presented for three considered cases in Figure 20. A significant feature seen in all presented cases is a radial expansion of the shock (2D effect) which results, in particular, in a lowering of the maximum shock pressure. The main reason for this behavior consists in inhomogeneous spatial distribution of the intensity (Gaussian shape) of the main 3ω beam which results in inhomogeneous radial distribution of all shock parameters. The range of r for which the shock is almost planar and homogeneous depends on the preplasma thickness and achieves its maximum at L pre = 0.

Fig. 20. 2D spatial distributions of density, pressure, and temperature of plasma in the CH(Cl)25 µm layer at the moment when the shock approaches the plastic-Cu interface (z = −25 µm) for the case when the plastic layer is irradiated by the main 3ω laser pulse (a) or by the main pulse together with the prepulse (b, c). The main beam intensity equals to I L = 4.5 × 10¹⁵ W/cm2 and corresponds to the laser energy of 100J. The surface of the plastic layer is placed at z = 0. Results of 2D numerical simulations; times are relative to the time of main pulse maximum.
The maximum pressure of the shock in the plastic layer (reached close to the plastic-Cu interface) as a function of the main beam intensity is presented in Figure 21. The highest shock pressures, up to 100 Mbar at I L = 9 × 10¹⁵ W/cm2, are produced at the preplasma absence. However, the effect of the preplasma on the shock pressure is relatively weak – the pressure drop due to the presence of the preplasma reaches ~10–20% and depends on the laser intensity. As mentioned earlier, the calculated pressure can be overestimated by ~10–20% relative to the real pressure in our experiment. Thus at the maximum laser intensity and L pre = 0, the real pressure should be ~80–90 Mbar. This pressure is higher than the pressure of 50 Mbar inferred from the shock breakout time measurements performed in similar experimental conditions at I L = 7 × 10¹⁵ W/cm2 and confirmed by 2D simulations with the DUED code for two times lower laser intensity (Koester et al., Reference Koester, Antonelli, Atzeni, Badziak, Baffigi, Batani, Cecchetti, Chodukowski, Consoli, De. Cristoforetti, Angelis, Folpini, Gizzi, Kalinowska, Krousky, Kucharik, Labate, Levato, Liska, Malka, Maheut, Marocchino, Nicolai, O'Dell, Parys, Pisarczyk, Raczka, Renner, Rhee, Ribeyre, Richetta, Rosinski, Ryc, Skala, Schiavi, Schurtz, Smid, Spindloe, Ullschmied, Wolowski and Zaras2013). In the same time, the achieved pressure is by a factor 2 lower than that predicted by the theory for a laser-driven planar shock in plastic (Lindl, Reference Lindl1995). This is shown in Figure 22, where a dependence of the shock pressure on the absorbed laser intensity plotted for an ideal planar shock is compared with that for the pressure inferred from our PALS experiment using the PALE simulations. From these plots and the 2D shock profiles presented in Figure 20, it can be concluded that a main (though not the only one) reason for the lower increase of the pressure with the laser intensity at our experimental conditions is non-planar (quasi-spherical) expansion of the shock in the target. Another reason can be less efficient energy transport from the absorption region to the ablation surface than that assumed in the theory (Lindl, Reference Lindl1995). Thus to produce the shock pressure ~300 Mbar required for the SI, the laser beam driving the shock must be much more homogeneous and broader than that used in our experiment (the beam width should be at least several times larger than the distance between the absorption region and the ablation surface) and the beam intensity should be a factor 2–3 higher (i.e., ~2–3 × 10¹⁶ W/cm2). To reach such beam parameters in case of presence of the extended preplasma, a multi-kJ laser facility is necessary.

Fig. 21. The maximum pressure of the shock in the CH(Cl) 25 µm layer (before reaching the plastic-Cu interface) as a function of the main 3ω pulse intensity for the case when the plastic layer is irradiated by the main pulse (L pre = 0) or by the main pulse together with the prepulse. Results of 2D numerical simulations

Fig. 22. The shock pressure in a plastic target as a function of the absorbed laser intensity. The solid line corresponds to the planar shock pressure calculated from the formula shown in the figure (Lindl, Reference Lindl1995). The red circles connected by the dashed line correspond to the pressure inferred from the PALS experiment using 2D simulations with the PALE code for the case of the preplasma absence. I 15 is the absorbed laser intensity in units 1015 W/cm2.
5. CONCLUSIONS
A short-wavelength (0.44 µm, 3w) laser beam of intensity approaching 1016 W/cm2 generates hot (suprathermal) electrons with the temperature of tens of keV in the ablated plastic plasma, however the laser-to-hot electrons energy conversion efficiency is small, ~1% or below, both at the preplasma absence and presence. Consequently, the influence of hot electrons on the shock generated in the plastic target is expected to be small as well.
The pressure of the shock generated in the plastic layer by the short-wavelength laser beam is relatively weakly influenced by the preplasma (the pressure drop due to the preplasma presence is ~10–20%) and at the beam intensity ~1016 W/cm2, the maximum pressure reaches ~80–90 Mbar.
A long-wavelength (1.315 µm, 1ω) laser beam generates shock in the plastic layer with the lower energy and pressure than that corresponding to the short-wavelength (3ω) radiation with the same intensity despite the 1ω beam produces much more hot electrons. The energy of the shock generated by the 1ω beam clearly decreases with the increasing preplasma thickness.
An increase in the pressure of the shock driven by the short-wavelength laser beam with the laser intensity is slower than predicted by theory for a planar shock and the maximum pressure achieved in the experiment is by a factor of ~2 lower than predicted by the theory.
The main reason for a lower value of the achieved pressure seems to be quasi-spherical expansion of the shock (2D effects). On the other hand, the efficiency of the energy transport from the laser absorption region to the ablation surface lower than that assumed in the theory can also contribute to the decreasing pressure.
To reach the shock pressure required for SI (~300 Mbar) in planar geometry, a spatial distribution of the laser beam intensity should be much more homogeneous (e.g., with a high-exponent super-Gaussian shape) and broader and the beam intensity must be a factor 2–3 higher than that in the experiment (i.e., ~2–3 × 10¹⁶ W/cm2). To attain such laser beam parameters, a multi-kJ laser is needed.
ACKNOWLEDGEMENTS
This work was supported in part by the Access to Research Infrastructure activity in the 7th Framework Program of the EU Contract No. 284464, Laserlab Europe III, by National Centre for Science (NCN), Poland under Grant No 2012/04/M/ST2/00452 and by the Italian MIUR project PRIN 2009FCC9MS. The participation of O. Renner and M. Smid in this research was supported by MSMT ELI Project No. CZ.1.05/1.1.00/02.0061.