


1. INTRODUCTION
In the last two decades, the interaction of ultrashort-pulsed laser (USPL) with matter has attracted great research interests, because of its numerous applications in the fields of precision micromachining (Wang et al., Reference Wang, Ren, Cheng, Chen and Tzou2013), laser-induced breakdown spectrometry (Sigman, Reference Sigman2010), laser ablation inductively coupled plasma mass spectrometry (Watling et al., Reference Watling, Lynch and Herring1997; Pisonero et al., Reference Pisonero, Koch, Wälle, Hartung, Spencer and Günther2007; Zhang et al., Reference Zhang, He, Hang and Huang2013), fast chemical reactions, etc. Understanding the physical processes involved in the laser–target interaction is critical in gaining a comprehension of the entire process in all its complex nature. Sophisticated simulation models became a very popular tool of investigation that help to enhance the physics and allow minimizing the extensive experimental costs for optimization of the laser and target parameters for specific applications. In general, three major processes are considered in the theoretical analysis of the laser pulse–metal interaction, namely: absorption of the laser energy through photon–electron coupling within the thin layer during the laser pulse; heat redistribution between the electron and lattice subsystems in the picosecond time domain; and heat dissipation into the bulk of the target via electron thermal conduction (Wellershoff et al., Reference Wellershoff, Hohlfeld, Güdde and Matthias1999; Rethfeld et al., Reference Rethfeld, Kaiser, Vicanek and Simon2002; Du et al., Reference Du, Chen, Yang, Si and Hou2010). Significant research efforts have been focused on the analysis of the heat redistribution after the laser pulse, assuming constant laser absorption efficiency independent of the laser parameters. Several simulation models based on the two-temperature model (TTM) have been developed to predict the target thermal response to the femtosecond laser irradiation under varying laser and material parameters. The main assumption for TTM is a strong thermal non-equilibrium state between the electron and lattice subsystems on the picosecond time scale due to unique characteristics of the ultrashort pulse lasers (Qiu & Tien, Reference Qiu and Tien1993; Rethfeld et al., Reference Rethfeld, Kaiser, Vicanek and Simon2002; Gamaly, Reference Gamaly2011). Therefore, the model considers electrons and lattice as two separate thermodynamic subsystems.
The temperatures of the electron and lattice subsystems are defined from a system of the regular thermal diffusion equations for each particle type with an energy exchange term added [Eqs (1) and (2)] (Spitzer & Härm, Reference Spitzer and Härm1953; Anisimov et al., Reference Anisimov, Kapeliovich and Perelman1974). Theoretical analysis and the experimental data accumulated over decades of research demonstrate a strong temperature dependence of the thermodynamic and optical parameters included in the TTM. A variety of models were developed to account for temperature-dependent electron thermal conductivity (Chen et al., Reference Chen, Latham and Beraun2005; Kirkwood et al., Reference Kirkwood, Tsui, Fedosejevs, Brantov and Bychenkov2009), electron (Chen et al., Reference Chen, Latham and Beraun2005; Lin et al., Reference Lin, Zhigilei and Celli2008; Kirkwood et al., Reference Kirkwood, Tsui, Fedosejevs, Brantov and Bychenkov2009), and lattice (Waldecker et al., Reference Waldecker, Bertoni, Ernstorfer and Vorberger2016) heat capacities, and electron–phonon coupling factor (Chen et al., Reference Chen, Latham and Beraun2005; Lin et al., Reference Lin, Zhigilei and Celli2008; Loboda et al., Reference Loboda, Smirnov, Shadrin and Karlykhanov2011). However, the majority of the existing simulation models for femtosecond laser–metal interaction based on the TTM assume constant optical parameters for the target (Chen & Beraun, Reference Chen and Beraun2003; Chen et al., Reference Chen, Latham and Beraun2005, Reference Chen, Xu, Jiang, Sui, Ding, Liu and Jin2010, Reference Chen, Jiang, Sui, Ding, Liu and Jin2011a , Reference Chen, Jiang, Sui, Liu, Jin and Ding b ; Zhao, Reference Zhao2014; Zhang et al., Reference Zhang, Chen, Hu and Chen2015), potentially leading to inadequate estimation of the amount of energy deposited into the target during the laser pulse. This work demonstrates the effect of temperature-dependent reflectivity and optical absorption depth on the simulated laser absorption efficiency and, as a result, on the material thermal response for various metallic targets, for example, aluminum, gold, copper, molybdenum, and nickel. To adequately benchmark the simulation results and the available experimental data, we considered a two-dimensional (2D) axisymmetric model with cylindrical coordinates (r, z) assuming it was sufficient to describe the 3D behavior of the laser–material interaction.
2. MODEL DESCRIPTION AND THEORY
2.1. Two-temperature model
To accurately simulate the target thermal response to femtosecond laser irradiation, we utilized a TTM expressed as follows.
 $$C_{\rm e} \displaystyle{{\partial T_{\rm e}} \over {\partial t}} = \nabla k_{\rm e} (\nabla T_{\rm e} ) - G\left( {T_{\rm e} - T_{\rm l}} \right) + S(r,z,t),$$
 $$C_{\rm l} \displaystyle{{\partial T_{\rm l}} \over {\partial t}} = \nabla k_{\rm l} \left( {\nabla T_{\rm l}} \right) + G\left( {T_{\rm e} - T_{\rm l}} \right),$$
where the subscript e refers to electrons and subscript l refers to the lattice, C is the heat capacity, k is the thermal conductivity, G is the coupling factor that describes the heat exchange between the electrons and the lattice, and S is the volumetric laser energy deposition rate.
For 3D simulations of the target response to laser irradiation, we have developed computer code for 2D calculations – FEMTO-2D – based on the expression of the heat conduction equations for the electron and lattice subsystems in axially symmetric cylindrical coordinates (r, z):
 $$\eqalign{C_{\rm e} \displaystyle{{\partial T_{\rm e}} \over {\partial t}} & = \displaystyle{1 \over r}\displaystyle{\partial \over {\partial r}}\left( {k_{\rm e} r\displaystyle{{\partial T_{\rm e}} \over {\partial r}}} \right) + \displaystyle{\partial \over {\partial z}}k_{\rm e} \displaystyle{{\partial T_{\rm e}} \over {\partial z}} - G\left( {T_{\rm e} - T_{\rm l}} \right) \cr & \quad + S(r,z,t),}$$
 $$C_{\rm l} \displaystyle{{\partial T_{\rm l}} \over {\partial t}} = \displaystyle{1 \over r}\displaystyle{\partial \over {\partial r}}\left( {k_{\rm l} r\displaystyle{{\partial T_{\rm l}} \over {\partial r}}} \right) + \displaystyle{\partial \over {\partial z}}k_{\rm e} \displaystyle{{\partial T_{\rm e}} \over {\partial z}} + G\left( {T_{\rm e} - T_{\rm l}} \right),$$
where r is the radial distance from the center of the beam and z is the coordinate normal to the sample surface with the origin at the surface.
A perfect, homogeneous, and isotropic metal was assumed in the simulations. The following initial and boundary conditions were applied to solve Eqs (3) and (4). The simulation started at time t = 0. The initial temperature for electrons and lattice, as well as the temperatures far away from the exposed surface in the z-direction and far from the center in the r-direction at any time step are set to be at the ambient temperature (300 K).
Thermal emission from the surface of the target during simulation was accounted for with the Stefan–Boltzman law. For the other outer boundaries, zero heat losses to the surrounding vacuum were assumed during the entire calculation time: dT e/dr|0 = dT l/dr|0 = dT e/dr| r = dT l/dr| r = 0, and dT e/dz| z = dT l/dz| z .
2.2. Thermal physical parameters
At any simulation time step, the electron and lattice temperatures were numerically calculated by solving Eqs (3) and (4). To solve the equations, we needed to define the target parameters C e, k e, and G as functions of electron temperature, and C l, k l as functions of lattice temperature.
The electron heat capacity in the entire temperature diapason was defined via smooth interpolation between two polar states of the material: the cold solid state
 $C_{\rm e}^{\rm s} = (1/2){\rm \pi} ^2 n_{\rm e} (k_{\rm B}^2 T_{\rm e} /{\rm \varepsilon} _{\rm F} )$
and the hot plasma state
$C_{\rm e}^{\rm s} = (1/2){\rm \pi} ^2 n_{\rm e} (k_{\rm B}^2 T_{\rm e} /{\rm \varepsilon} _{\rm F} )$
and the hot plasma state
 $C_{\rm e}^{{\rm pl}} = (3/2)n_{\rm e} k_{\rm B} $
as following:
$C_{\rm e}^{{\rm pl}} = (3/2)n_{\rm e} k_{\rm B} $
as following:
 $$\left( {\displaystyle{1 \over {C_{\rm e}}}} \right)^2 = \left( {\displaystyle{1 \over {C_{\rm e}^{\rm s}}}} \right)^2 + \left( {\displaystyle{1 \over {C_{\rm e}^{{\rm pl}}}}} \right)^2 $$
giving
 $$C_{\rm e} = n_{\rm e} k_{\rm B} \displaystyle{{3{\rm \pi} ^2 T_{\rm e}} \over {\sqrt {36T_{\rm F}^2 + 4{\rm \pi} ^4 T_{\rm e}^2}}}, $$
where n e = Zn i is electron density, Z is the average charge state at given T e, n i is the ion density, T F is Fermi temperature, and k B is Boltzmann constant.
The electron heat conductivity was also approximated by the interpolation between the cold solid state and the dense plasma state as follows:
 $$k_{\rm e} = \sqrt {k_{\rm e}^{{\rm s}2} + k_{\rm e}^{{{\rm pl}}2}} $$
where
 $k_{\rm e}^{\rm s} = C_{\rm e} \upsilon _{\rm F}^2 /3\nu _{{\rm eff}} $
is the heat conductivity of cold solid metal (Kittel, Reference Kittel2005), and
$k_{\rm e}^{\rm s} = C_{\rm e} \upsilon _{\rm F}^2 /3\nu _{{\rm eff}} $
is the heat conductivity of cold solid metal (Kittel, Reference Kittel2005), and
 $\; k_{\rm e}^{{\rm pl}} {\rm =} 128\; (0.24 + Z)n_{\rm e} T_{\rm e} /3{\rm \pi} (4.2 + Z)m_{\rm e} (v_{{\rm e} - {\rm i}} + \nu _{{\rm e} - {\rm e}} )$
is the plasma Spitzer heat conductivity (Kirkwood et al., Reference Kirkwood, Tsui, Fedosejevs, Brantov and Bychenkov2009), which was modified to include electron–electron collisions to consider the plasma at a near solid density.
$\; k_{\rm e}^{{\rm pl}} {\rm =} 128\; (0.24 + Z)n_{\rm e} T_{\rm e} /3{\rm \pi} (4.2 + Z)m_{\rm e} (v_{{\rm e} - {\rm i}} + \nu _{{\rm e} - {\rm e}} )$
is the plasma Spitzer heat conductivity (Kirkwood et al., Reference Kirkwood, Tsui, Fedosejevs, Brantov and Bychenkov2009), which was modified to include electron–electron collisions to consider the plasma at a near solid density.
Collision frequencies v e−i, v e−e correspond to electron–ion, electron–electron collisions in the dense plasma state, v eff corresponds to the total electron–electron and electron–phonon collision frequency in the solid metal, m e is electron mass, and υF is Fermi velocity. Collision processes inside the target are discussed in greater details in the following section.
The lattice heat capacity was calculated from the Debye model of phonon's heat capacity for metals as following:
 $$C_{\rm l} = 9n_{\rm i} k_{\rm B} \left( {\displaystyle{{T_{\rm l}} \over {{\rm \theta} _{\rm D}}}} \right)^3 \int_0^{{\rm \theta} _{\rm D} /T_{\rm l}} {\displaystyle{{x^4 \exp (x)} \over {[\exp (x) - 1]^2}}} dx$$
where
 ${\rm \theta} _{\rm D} = \hbar C_{\rm s} /k_{\rm B} (6{\rm \pi} ^2 n_{\rm i} )^{1/3} $
is the Debye temperature, C
S is speed of sound in the material,
${\rm \theta} _{\rm D} = \hbar C_{\rm s} /k_{\rm B} (6{\rm \pi} ^2 n_{\rm i} )^{1/3} $
is the Debye temperature, C
S is speed of sound in the material,
 $\hbar $
is the reduced Planck constant.
$\hbar $
is the reduced Planck constant.
The lattice heat conductivity is usually omitted as negligibly small (Jiang & Tsai, Reference Jiang and Tsai2005; Lee et al., Reference Lee, Kang and Lee2011) or assumed to be about 1% of the thermal conductivity of the bulk metal (Chen et al., Reference Chen, Xu, Jiang, Sui, Ding, Liu and Jin2010, Reference Chen, Jiang, Sui, Liu, Jin and Ding2011b ). In the presented model, we approximated the lattice heat conductivity based on the collision theory as follows:
 $$k_{\rm l} = \displaystyle{1 \over 3}C_{\rm l} \displaystyle{{\vartheta _{\rm i}^2} \over {\nu _{{\rm i} - {\rm i}}}}, $$
where
 $\vartheta _{\rm i} = \sqrt {(2k_{\rm B} T_{\rm l} /m_{\rm i} ) + C_{\rm s}^2} $
is the ion/phonon velocity at given lattice temperature, and
$\vartheta _{\rm i} = \sqrt {(2k_{\rm B} T_{\rm l} /m_{\rm i} ) + C_{\rm s}^2} $
is the ion/phonon velocity at given lattice temperature, and
 $\nu _{{\rm i} - {\rm i}} = n_{\rm i} {\rm \pi} (2r_0 )^2 \vartheta _{\rm i} $
is the ion–ion collisional frequency calculated based on hard sphere model, m
i is atomic mass, and r
0 is atomic radius.
$\nu _{{\rm i} - {\rm i}} = n_{\rm i} {\rm \pi} (2r_0 )^2 \vartheta _{\rm i} $
is the ion–ion collisional frequency calculated based on hard sphere model, m
i is atomic mass, and r
0 is atomic radius.
The rate of the heat transfer from the electron subsystem into the lattice subsystem is defined by the coupling factor. Early theoretical models usually assumed a constant value for the coupling factor (Chen & Beraun, Reference Chen and Beraun2003; Ibrahim et al., Reference Ibrahim, Elsayed-Ali, Shinn and Bonner2003; Wang et al., Reference Wang, Dai and Melnik2006; Liu, Reference Liu2007), which is proved to be a reliable assumption at low electron temperatures. However, at the intermediate and high electron temperature range, the coupling factor is, in fact, a temperature-dependent parameter, and it has a great impact on how well the model predicts the electron and lattice temperature distributions and equilibration processes (Waldecker et al., Reference Waldecker, Bertoni, Ernstorfer and Vorberger2016). For the FEMTO-2D model, electron–phonon coupling factor on the wide electron temperature range (up to about 4.3 eV) was adopted from Lin et al. model (Lin, Reference Lin2007; Lin et al., Reference Lin, Zhigilei and Celli2008). Their model takes into account the electron density of states (DOS) in the material because the electron–phonon coupling factor is very sensitive to details of the electronic structure of the material, and thermal excitation of the electrons below the Fermi level begins to contribute to the energy transfer between electrons and phonons as laser intensity increases (Lee et al., Reference Lee, Kang and Lee2011). The model for the coupling factor was further extended to higher electron temperature range with the formula for electron–ion coupling in plasma: G = 3(m e/m i)νe−i Zn i k B. At the intermediate electron temperature, above 4.3 eV, we assumed a constant value for coupling factor as long as G e-ph (4.3 eV) > G pl.
One critical parameter included in the formulas above to calculate the thermal physical properties of the materials is an average charge state. Different approaches and simulation models for the electron DOS and the average charge state calculation currently exist and are utilized by the research community. Figure 1 shows the average charge states dependence on the electron temperature for the materials of interest used in our model for the wide temperature diapason from room temperature up to 100 eV. At electron temperatures above 4 eV, we used the FLYCHK code (Chung et al., Reference Chung, Chen, Morgan, Ralchenko and Lee2005) to calculate the average charge state for aluminum, gold, copper, molybdenum, and nickel. At lower electron temperatures (up to 2–3 eV), the FLYCHK code for dense matter is known to produce overestimated values for the average charge state (Chung et al., Reference Chung, Chen, Morgan, Ralchenko and Lee2005); therefore, in this temperature range, we utilized the data adopted from (Lin, Reference Lin2007; Lin et al., Reference Lin, Zhigilei and Celli2008) calculated based on VASP code. Smooth interpolation between the data for average charge state from VASP code and from FLYCHK code was performed were needed (e.g., for molybdenum).

Fig. 1. Average charge state versus electron temperature for (a) aluminum, (b) gold, (c) copper, (d) molybdenum, and (e) nickel.
2.3. Optical model for the laser energy absorption
The laser energy absorbed by the target during the pulse is described as the volumetric heat source S(r, z, t) in the Eq. (1). The heat source was modeled with the Gaussian temporal and spatial (radial) profiles, and an exponential attenuation of the laser intensity with depth according to the Beer–Lambert law (Qiu & Tien, Reference Qiu and Tien1994):
 $$\eqalign{& S\left( {x,r,t} \right) = \sqrt {\displaystyle{{\rm \beta } \over {\rm \pi }}} \displaystyle{{(1 - R){\rm \; }} \over {t_{\rm p}l_{\rm p}}}{\rm \; }I_0\;{\rm exp}\left[ { - \left( {\displaystyle{z \over {l_{\rm p}}}} \right){\rm \; }} \right] \cr & \;\;\;\;\;\;\;\;\;\;\;\;\quad \times {\rm exp}\left[ { - \displaystyle{{r^2} \over {2{\rm \sigma }^2}}} \right]{\rm exp}\left[ { - {\rm \beta^*}{\left( {\displaystyle{{t - 2t_{\rm p}} \over {t_{\rm p}}}} \right)}^2} \right],}$$
where I 0 is the laser peak power density, R is the temperature-dependent reflectivity, l p is the temperature-dependent optical penetration depth, t p is the laser pulse full width at half-maximum, and β = 4ln2.
The efficiency of the laser absorption is defined by the material optical properties and laser parameters. The commonly used assumption of the constant reflectivity and optical penetration depth (Chen et al., Reference Chen, Xu, Jiang, Sui, Ding, Liu and Jin2010, Reference Chen, Jiang, Sui, Liu, Jin and Ding2011b ) allows significant simplification of the calculations and saving of the computer time; however, it leads to an inaccurate estimation of the amount of heat deposited into the target and overall target response.
In the presented work, we have considered temperature-dependent reflectivity and optical penetration depth in Eq. (7) at any time step and across the spatial beam profile. These important parameters are physically dependent on the collisional processes inside the target, namely electron–phonon or electron–ion collisions, and electron–electron collisions. The surface reflectivity and optical penetration depth are related to effective electron collision rate according to the Drude absorption model via material dielectric function [Eq. (10)] by the Fresnel formula [Eq. (11)].
 $$\epsilon _r = 1 - \displaystyle{{{\rm \omega} _{\rm p}^2} \over {i{\rm \omega} \nu _{{\rm eff}} + {\rm \omega} ^2}}, $$
where n
e = Zn
i is electron density, Z is the average charge state at given T
e, n
i is the ion density;
 ${\rm \omega} _{\rm p} = \sqrt {n_{\rm e} e^2 /\epsilon _0 m_{\rm e}} $
– material plasma frequency; ω – frequency of the laser field; νeff – effective collision frequency – sum of electron–electron and electron–lattice (phonon or ion) collision frequencies. The detailed mechanism for effective collision frequency calculation is provided in the following section.
${\rm \omega} _{\rm p} = \sqrt {n_{\rm e} e^2 /\epsilon _0 m_{\rm e}} $
– material plasma frequency; ω – frequency of the laser field; νeff – effective collision frequency – sum of electron–electron and electron–lattice (phonon or ion) collision frequencies. The detailed mechanism for effective collision frequency calculation is provided in the following section.
 $$R = \left \vert {\displaystyle{{1 - \sqrt {\epsilon _r}} \over {1 + \sqrt {\epsilon _r}}}} \right \vert ^2, $$
where ε r = ε1 + iε 2 is material dielectric function – combination of material permittivity and conductivity.
Optical penetration depth was defined as the depth at which the intensity of the transmitted electromagnetic wave drops to 1/e of its initial value at interface (Brown & Arnold, Reference Brown, Arnold, Sugioka, Meunier and Pique2010) and calculated as follows:
 $$l_{\rm p} = \displaystyle{{\rm \lambda} \over {4{\rm \pi} \; Im[\sqrt {\epsilon _r} ]}},$$
where λ is the laser wavelength.
The physical, thermal, and optical parameters for five metals used in the simulations are listed in Table 1.
Table 1. Material properties

(a) – Kittel (Reference Kittel2005), (b) – Lide (Reference Lide2003), (c) – Ashcroft and Mermin (Reference Ashcroft and Mermin1976), (d) – Samsonov (Reference Samsonov1968), (e) – Rakic et al. (Reference Rakić, Djurišić, Elazar and Majewski1998), (f) – Chen et al. (Reference Chen, Xu, Jiang, Sui, Ding, Liu and Jin2010), (g) – Hermann et al. (Reference Hermann, Benfarah, Bruneau, Axente, Coustillier, Itina, Guillemoles and Alloncle2006), (h) – Chen et al. (Reference Chen, Jiang, Sui, Ding, Liu and Jin2011a ), (i) – Chase (Reference Chase1998).
2.4. Collision theory
The rate of collisional processes inside the target affects most of the parameters defining the laser energy absorption and heat redistribution, including the surface reflectivity, optical penetration depth, the rate of the heat transfer from the electron subsystem into the lattice subsystem (the electron–phonon coupling factor), the rate of the heat transport into the bulk (electron and lattice thermal conduction). In the case of the femtosecond laser interaction with metal, in contrast to the longer laser pulses (e.g., picosecond scale and longer), the laser energy deposited into the target at the extremely high rate, leading to the rapid rise of the electron temperature, which results in transition of the metal from the cold solid state into the dense plasma state during the laser pulse of intermediate and high intensity. Therefore, it is necessary to consider all different states/phases the material is going through.
In the cold solid state, the dominant collision mechanism is the scattering of electrons by phonons. For these types of collisions, the collision frequency varies with the lattice temperature as follows:
 $$\nu _{{\rm e} - {\rm ph}} = \nu _{{\rm e} - {\rm ph}}^0 \left( {\displaystyle{{T_{\rm l}} \over {300\,{\rm K}}}} \right),$$
where
 $\nu _{{\rm e} - {\rm ph}}^0 $
is the electron–phonon collision frequency at room temperature, and T
l is the lattice temperature.
$\nu _{{\rm e} - {\rm ph}}^0 $
is the electron–phonon collision frequency at room temperature, and T
l is the lattice temperature.
The values for the electron–phonon collision frequency at room temperature were obtained by fitting the Drude model of the permittivity to the experimental values of permittivity, and are given in Table 2.
Table 2. Electron–phonon collision frequency at room temperature

(a) – Rakic et al. (Reference Rakić, Djurišić, Elazar and Majewski1998), (b) – Polek (Reference Polek2015), (c) – Ordal et al. (Reference Ordal, Bell, Alexander, Newquist and Querry1988), (d) – Ordal et al. (Reference Ordal, Bell, Alexander, Long and Querry1987).
For the dense plasma state with the electron temperature around and above Fermi temperature, we have modified Spitzer's formula (Spitzer & Härm, Reference Spitzer and Härm1953; Callen, Reference Callen2006) for the electron–ion collision frequency in hot plasma in order to account for the electron degeneracy effect in the plasma at a solid density by including participation factor f p as follows:
 $$\nu _{{\rm e} - {\rm i}} = \left( {\displaystyle{4 \over {3\sqrt {\rm \pi}}}} \right)\displaystyle{{Z^2 e^4 n_{\rm i}} \over {4{\rm \pi \varepsilon} _0^2}} \displaystyle{{\,f_{\rm p}} \over {m_{\rm e}^{1/2} (2k_{\rm B} T_{\rm e} + 2{\rm \mu} )^{3/2}}} {\rm ln}(\Lambda )$$
where ε0 is the permittivity of free space, e is the charge of the electron, ln(Λ) is the Coulomb logarithm, μ is chemical potential, f p is the electron participation factor.
To define the electron–lattice collision frequency in the wide temperature range from the cold solid through the warm metal state into the dense plasma states, we applied the following interpolation:
 $$\nu _{{\rm e} - {\rm ph}/{\rm e} - {\rm i}} = \displaystyle{{\nu _{{\rm e} - {\rm ph}}^{\rm s} \; \nu _{{\rm e} - {\rm i}}^{{\rm pl}}} \over {\sqrt {\nu _{{\rm e} - {\rm ph}}^{{\rm s}}{}^2 + \nu _{{\rm e} - {\rm i}}^{{{\rm pl}}}{}^2}}}. $$
We also considered the fact that the maximum possible value for the electron–lattice collision frequency cannot exceed the theoretical value calculated based on the hard sphere model
 $\nu _{{\rm hs}} = {\rm \;} \sqrt {V_{{\rm Fermi}}^2 + (2k_{\rm B} T_{\rm e} /m_{\rm e} )} /r_0 $
, where r
0 is atomic radius and V
Fermi is electron velocity near Fermi energy.
$\nu _{{\rm hs}} = {\rm \;} \sqrt {V_{{\rm Fermi}}^2 + (2k_{\rm B} T_{\rm e} /m_{\rm e} )} /r_0 $
, where r
0 is atomic radius and V
Fermi is electron velocity near Fermi energy.
For the cold solid state as well as for the hot plasma state, the electron–phonon or electron–ion (respectively) collision processes are dominant over electron–electron collisions in the case of the thermal equilibrium. However, due to the strong non-equilibrium between electron and lattice subsystems and extremely dense plasma state at high electron temperature, electron–electron collisions must be taken into account when calculating effective collision frequency (Komashko, Reference Komashko2003; Shternin & Yakovlev, Reference Shternin and Yakovlev2006): νeff = νe-ph/e−i + νe−e, where νe−e is calculated with Eq. (16).
The electron–electron collision frequency was calculated in a similar way the electron–ion collision frequency in the dense plasma state:
 $$\nu _{{\rm e} - {\rm e}} = \left( {\displaystyle{4 \over {3\sqrt {\rm \pi}}}} \right)\displaystyle{{Ze^4 n_{\rm i}} \over {4{\rm \pi \varepsilon} _0^2}} \displaystyle{{\,f_{\rm p}^2} \over {m_{\rm e}^{1/2} (2k_{\rm B} T_{\rm e} + 2{\rm \mu} )^{3/2}}} {\rm ln}(\Lambda ).$$
Electron participation factor f
p is introduced to account for the electron degeneracy effect, and was estimated as following:
 $f_{\rm p} = \displaystyle{1 \over {Zn_{\rm i}}} \int_{\rm \mu} ^\infty {\,f\,({\rm \varepsilon} )D({\rm \varepsilon} )d{\rm \varepsilon}} $
, where D(ε) is the electron DOS, and f(ε) is the Fermi distribution at given electron temperature T
e.
$f_{\rm p} = \displaystyle{1 \over {Zn_{\rm i}}} \int_{\rm \mu} ^\infty {\,f\,({\rm \varepsilon} )D({\rm \varepsilon} )d{\rm \varepsilon}} $
, where D(ε) is the electron DOS, and f(ε) is the Fermi distribution at given electron temperature T
e.
Chemical potentials for listed metals on the entire electron temperature diapason were calculated from the conservation of the total number of electrons, by setting the result of the integration of the product of DOS and the Fermi distribution function at given electron temperature over all energy levels to be equal to the total number of electrons:
 $$\displaystyle{{\sqrt {2m_{\rm e}^3}} \over {{\rm \pi} ^2 \hbar^{\hskip -2pt3}}} \int_0^\infty {\displaystyle{{{\rm \varepsilon} ^{1/2}} \over {\exp \left[ {{\rm \varepsilon} - {\rm \mu (}T_{\rm e} {\rm )}/k_{\rm B} T_{\rm e}} \right] + 1}}} d{\rm \varepsilon} = Zn_{\rm i}. $$
3. SIMULATION RESULTS AND DISCUSSION
3.1. Collisional processes
In the previous section, we discussed the role of the collision processes inside the target exposed to femtosecond laser irradiation as a critical parameter defining material's optical and thermal physical properties. Next, we have simulated the collisional processes for different interacting particles (electron–electron, electron–phonon, or electron–ion) inside the target exposed to such ultrashort laser. Since the primary goal for this work was to investigate the laser absorption efficiency, we limit our discussion to the time frame of the pulse duration.
Figure 2 shows how the collision rate for electron–electron and electron–lattice collisions changes in different metals during interaction with 800 nm 150 fs laser pulse of high fluence (~80 J/cm2). At this laser intensity, the maximum electron temperature reaches tens eV (above Fermi temperature), meaning that the material changes from the cold solid state into the extremely dense plasma state during the laser pulse. As seen in Figure 2, the contribution of the electron–electron collisions to the effective collision frequency becomes considerable at the intermediate temperature range for aluminum, nickel, molybdenum, and even significantly dominates over electron–ion collisions in copper and gold.

Fig. 2. Collision frequencies in (a) aluminum, (b) gold, (c) copper, (d) molybdenum, and (e) nickel targets during 150 fs laser pulse; (f) comparison of the effective collision frequencies in different metals in response to the same laser conditions. Laser parameters: λ – 800 nm, pulse duration – 150 fs, peak power density – 5 × 10¹⁴ W/cm2.
The electron temperature rapidly increases during the laser pulse, but the changes in the lattice temperature are commonly described as not significant. However, our simulations predict a notable increase of the lattice temperature at high laser intensities. Therefore, both electron and lattice temperatures affect the effective collision frequency in the target during the laser pulse, resulting in the changes of the absorption efficiency and the laser optical penetration depth due to changes in the dielectric function in the accordance with Eqs (11) and (12).
3.2. Absorption processes
Series of simulations for different laser intensities (5 × 10¹¹, 5 × 10¹², 5 × 10¹³, 5 × 10¹⁴, and 1 × 10¹⁵ W/cm2) were conducted to investigate the thermal dependence of the laser absorption efficiency. Figure 3 shows the simulation predictions and compares the absorptivity temporal profile during the laser pulse to the constant absorptivity (dashed line). At the laser intensity above 5 × 10¹¹ W/cm2 (corresponding to the laser fluence of ~80 mJ/cm2), the absorptivity changes significantly following changes in the effective collision frequency. Therefore, even at low laser fluences, it is important to consider thermal dependence of the optical properties for femtosecond laser–metal interaction. Moreover, the absorptivity temporal profiles are notably different for different laser intensities; that will limit any semiempirical approach to the laser absorption efficiency estimation to specific laser parameters.

Fig. 3. Absorption in the center of the laser beam during 150 fs pulse at different laser intensities for (a) aluminum, (b) gold, (c) copper, (d) molybdenum, and (e) nickel. The red dash-dotted line corresponds to A = 1 − R, where R is tabulated reflectivity. The black dotted line shows laser pulse temporal profile.
At high laser fluences (>5 × 10¹³ W/cm2), electron temperature increases so rapidly that material transforms into the hot dense plasma state at the beginning of the laser pulse, and the reflectivity increases comparing to the preceding warm metal state. Another observation from the simulation results is that the reflectivity of nickel is increasing slowly with the electron temperature at the beginning of the laser pulse, but then rapidly decreases following the trend similar to other metals. The reason for such trend is unclear and could be related to how rapidly the material plasma frequency changes compared with the effective collision frequency.
Since the real laser beam has physical dimensions and a power density redistribution in space, 1D simulation model for laser absorption will be not sufficient for some applications, for instance, to simulate a heat-effected zone, material ablation, and crater profile. Figure 4 shows how the absorptivity changes across the laser beam at the fixed time step (150 fs) for the intermediate laser intensity of 5 × 10¹³ W/cm2.

Fig. 4. Absorption across the beam profile at 150 fs simulation time step for aluminum, gold, copper, molybdenum, and nickel exposed to a laser pulse of 5 × 10¹³ W/cm2. Dashed line shows laser beam spatial profile.
To analyze how the effective absorptivity of the metal target changes with laser intensity, the temporal and spatial distributions of absorptivity must be considered. Figure 5a demonstrates how the simulated temperature-dependent absorption varies with the laser intensity, and Figure 5b compares it to the constant absorptivity for aluminum, gold, copper, molybdenum, and nickel on the same laser intensity range.

Fig. 5. Absorption versus laser intensity: (a) absolute values, (b) as ratio of constant value typically used in TTMs. Pulse duration 150 fs, wavelength 800 nm. Lines guide the eye.
The largest increase in the absorption efficiency normalized to the fixed value was observed for copper (about 13 times increase) and gold (around 11 times increase). Absorption for aluminum increases about 4.5 times compared with the constant value. The absorption for nickel and molybdenum does not change significantly. This can be related to how much the effective collision frequency for each metal changes with the electron temperature (Fig. 2), and may possibly be explained by the role of the electron–electron collisions as follows. Two metals, gold and copper, have similar structure of electron DOS distribution with the region of high electron DOS associated with d-bands that get thermally excited at the electron temperature above 1 eV (Lin et al., Reference Lin, Zhigilei and Celli2008). These thermally excited electrons may significantly increase the electron–electron collision rate as observed in Fig. 2. The electron DOS distribution for aluminum, in general, follows the trend predicted with the free electron gas model (Lin et al., Reference Lin, Zhigilei and Celli2008). Therefore, although the thermally excited electrons in aluminum contribute to the electron–electron collision rate, the number of these electrons is significantly lower than for copper and gold. Molybdenum and nickel belong to the group of transition metals with a complex structure of electron DOS distribution. Molybdenum has a half-filled d-band with small values of DOS at the Fermi level, while nickel has an almost full d-band with the Fermi level cutting through the high-energy edge of the band. Consequently, molybdenum has a high DOS right above the Fermi level available to the thermally excited electrons within d-band, and nickel has low DOS in s-band available for thermally excited electrons from d-band. Therefore, the contribution of the thermally excited electrons to the effective collision frequency is significantly reduced in molybdenum and nickel.
In general, the trend observed for absorption in all five metals at the high laser intensity of 1 × 10¹⁵ W/cm2 is in a good agreement with the data reported by Price et al. (Reference Price, More, Walling, Guethlein, Shepherd, Stewart and White1995): at the laser intensities around 2 × 10¹⁵ W/cm2, the absorption for aluminum, gold, copper, tantalum, and quartz has similar values of around 0.3–0.37, and temperature dependence is consistent with a “universal plasma mirror” reflectivity.
The effect of the thermally dependent absorption efficiency on the material thermal response is demonstrated in Figure 6.

Fig. 6. Comparison of the target thermal response (maximum electron temperature) versus laser pulse intensity for two series of simulations: (1) with temperature-dependent absorption (solid line) and (2) constant value for absorption (dashed line).
As expected, the simulation predicted insignificant difference in the maximum electron temperature for molybdenum and nickel due to small changes in the absorption efficiency; however, the maximum electron temperature was greatly underestimated for aluminum, gold, and copper in the case of the constant absorption efficiency as the laser intensity increases.
3.3. Optical penetration depth
Another optical parameter, which thermal dependence is also defined by collisional processes inside the target, is the optical penetration depth. Figure 7 shows how the optical penetration depth normalized to the constant values listed in Table 1 changes with the laser intensity in the metal targets.

Fig. 7. Normalized optical depth versus laser intensity. Pulse duration 150 fs, wavelength 800 nm. Lines guide the eye.
In general, the optical penetration depth does not directly impact how much energy is absorbed by the target; but it defines how the absorbed energy is distributed inside the target during the pulse, affecting the maximum electron temperature at the surface. Although considering thermally dependent optical penetration depth versus constant parameter may not have a significant impact on the simulation predictions of the material thermal response to the femtosecond laser irradiation, it contributes to the goal of gaining the clear understanding of the physical processes involved.
3.4. Benchmarking against available experimental data
Finally, we wanted to benchmark the theoretical predictions of FEMTO-2D model against the available experimental data. Due to the lack of the published experimental results for femtosecond laser–metal interaction in the field of the laser absorption, we only compared the data for aluminum, gold, and copper.
For aluminum, we have benchmarked our modeling predictions against the available experimental results, as well as against simulated data from HYADES code published by Komashko (Reference Komashko2003). Figure 8 presents the results for 400 nm wavelength with the pulse duration (a) 50 and (b) 150 fs.

Fig. 8. Comparison of the FEMTO-2D prediction with experimental results [adopted from Fisher et al. (Reference Fisher, Fraenkel, Henis, Moshe and Eliezer2001) and Price et al. (Reference Price, More, Walling, Guethlein, Shepherd, Stewart and White1995)] and data simulated with HYADES code [adopted from Komashko (Reference Komashko2003)] for 400 nm wavelength. Lines guide the eye.
As it can be seen, the numerically simulated and experimental curves exhibit similar behavior for a wide range of the laser intensities. The theoretical predictions are in a good agreement with the experimental data and HYADES code (Komashko, Reference Komashko2003) predictions for 50 fs laser pulses and demonstrate a good correlation with experiment for 150 fs laser pulses up to 5 × 10¹⁴ W/cm2. However, as the intensity is further increasing, the simulation model tends to slightly overestimate the absorption compared with the experimental data. In Fisher et al. (Reference Fisher, Fraenkel, Henis, Moshe and Eliezer2001) work, they discussed the possible underestimation of the absorption efficiency in the experiment due to the prepulse effect at the high laser intensity above 1 × 10¹⁴ W/cm2.
Figure 9 presents the comparison of the simulation results to the experimental data and the HYADES predictions for 800 nm laser pulses.

Fig. 9. Comparison of the FEMTO-2D prediction for aluminum with experimental results [adopted from Fisher et al. (Reference Fisher, Fraenkel, Henis, Moshe and Eliezer2001)] and data simulated with HYADES code [adopted from Komashko (Reference Komashko2003)] for 800 nm wavelength. Lines guide the eye.
The model tends to overestimate the absorption of 800 nm laser pulses at the laser intensity range above 5 × 10¹² W/cm2. A possible explanation for that is the interband absorption was not taken into account. Aluminum has an interband absorption peak at 1.55 eV which corresponds exactly to the 800 nm photon energy (Hughes et al., Reference Hughes, Jones and Lettington1969). At the laser intensities above 1 × 10¹⁴ W/cm2, the prepulse effect may also contribute to the lower experimental values for the laser absorption, as suggested by Fisher et al. (Reference Fisher, Fraenkel, Henis, Moshe and Eliezer2001).
Next, we compared the simulation predictions for absorption in copper for 800 nm laser pulses to the available experimental data, as shown in Figure 10.

Fig. 10. Comparison of the FEMTO-2D prediction for copper with experimental results [adopted from Kirkwood et al. (Reference Kirkwood, Tsui, Fedosejevs, Brantov and Bychenkov2009)].
We observed a good correlation between numerically simulated and the experimental data for copper on the laser intensity range from 5 × 10¹¹ to 1 × 10¹⁵ W/cm2. The interband absorption does not plays a significant role in this intensity range due to the fact that, in copper, the d-band lays 2.0–2.2 eV below Fermi level, and interband absorption of 800 nm photons is negligibly small, except for the very high laser intensities (Fisher et al., Reference Fisher, Fraenkel, Zinamon, Henis, Moshe, Horovitz and Eliezer2005).
Lastly, we compared the simulation predictions for effective collision frequency in gold to the available experimental data, as shown in Figure 11.
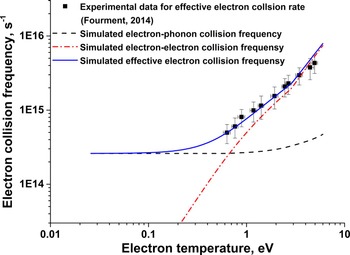
Fig. 11. Comparison of the experimental [adopted from Fourment et al. (Reference Fourment, Deneuville, Descamps, Dorchies, Petit, Peyrusse and Recoules2014)] and FEMTO-2D simulated data for the effective electron collision frequency in gold.
One can see a good correlation between FEMTO-2D simulation data and the experimental results for gold at electron temperature range from about 0.5 to 6 eV. Figure 11 demonstrates the significant contribution of the electron–electron collisions to the total effective collision frequency at the electron temperature as low as 0.7 eV as it was also predicted with our model. The fact that the collision processes in the target greatly define the laser absorption efficiency allows us to assume that the simulation model should be able to correctly predict the optical properties.
4. CONCLUSION
In this manuscript, a theoretical model based on the collision theory has been presented to simulate the absorption of the ultrashort pulse laser at normal incidence by the solid metal targets in a wide laser intensity range (5 × 10¹¹–1 × 10¹⁵ W/cm2). A modified two-temperature 2D model considering temperature-dependent optical and thermal physical parameters for electron and lattice subsystems was developed. For this model, we aimed to reduce the number of fitted parameters for thermodynamic parameters by utilizing theoretical formulas based on the collision theory for extreme material states namely, the cold solid state and the dense plasma state, and to decrease the calculation time by using interpolation between these states. Therefore, accurate assessment of the collision frequencies through different material states was required. Since the pulse duration for femtosecond laser is significantly shorter than thermal equilibration and material expansion time, we have assumed that the target remains at the solid density through the entire laser–target interaction process. Consequently, we modified the formula of the electron–ion collision frequency for the hot plasma state to account for electron degeneracy effect in the hot dense plasma. Moreover, although electron–electron collision frequency often assumed to be negligibly small in the hot plasma state, it had to be included in the effective collision frequency calculation for the case of the dense plasma and also for the transition stage between cold solid and dense plasma states, due to high plasma density and strong thermal non-equilibrium between electrons and lattice (Komashko, Reference Komashko2003; Shternin & Yakovlev, Reference Shternin and Yakovlev2006).
A series of simulations were performed to predict the femtosecond laser absorption in the aluminum, gold, copper, molybdenum, and nickel targets at different laser intensities. Significant increase of the laser absorption parameter with the laser intensity was observed for aluminum, gold, and copper, and considerably smaller changes for molybdenum and nickel. We have attributed such trends to the specific details of the electron DOS distribution in these.
Finally, the model was benchmarked against experimental results for aluminum, gold, and copper – the metals that exhibit the largest changes in optical properties as function of temperature. The simulation predictions were found to be in a good agreement with available experimental data in a wide laser intensity range up to 1015 W/cm2. However, at much higher laser intensity, considerable material expansion may occur during the laser pulse, especially for longer pulses, making the assumption of constant material density to be less accurate, and the models may need further improvements.
With this work, we have demonstrated that although utilizing constant values for reflectivity and optical depth simplifies the TTM and allows shorter calculation time for qualitative analysis of materials thermal response to the USPL irradiation, it could result in values significantly different from the case when temperature dependence of those parameters is taken into account. The evaluation of the ultrashort pulse laser absorption efficiency as a temperature-dependent parameter will allow more accurate simulation of the target thermal response in the applications where it is critical, such as prediction of the material damage threshold, laser ablation threshold, and the ablation profile.
ACKNOWLEDGMENTS
This work is partially supported by the NSF, PIRE project.


