


Introduction
MeV and KeV ion streams emitted from plasma generated by pulsed lasers (ns–ps pulse durations) can be detected using different devices, such as semiconductors, an ionizing chamber, track detectors, gaf-chromix films, and others. At a very low ion energy, below 1–10 keV, their detection is not simple, and magnetic spectrometers coupled to Faraday cups or secondary electron multipliers (SEMs) can be employed to analyze their energy distributions, charge state distribution, and mass-to-charge ratios, measurements that permit to characterize the plasma source properties (Torrisi et al., Reference Torrisi2010, Reference Torrisi2015).
Magnetic spectrometers can provide significant improvements in the ion beam analysis (IBA), including mass and energy resolution of the detected particles (protons, ions, electrons). A magnetic spectrometer is a device that makes use of the Lorentz force F = qvxB, where q is the ion charge, v the ion velocity, m its mass, and B the magnetic field to focus the particles coming from an object (the target) to an image along the spectrometer focal plane (Herbert and Johnstone Reference Herbert and Johnstone2003). For charge particles incident orthogonally to the magnetic field, the trajectory curvature will have a radius depending on R = mv/qB. Ionized atoms and molecules can be deflected by the magnetic fields, although electrically neutral ones are not. The ions deflected by a magnetic field according to their masses can be detected by an ion collector (IC) or, at a very low current, by an SEM to gain electrical signal. The lighter they are, the more they are deflected; more charge they have and more are deflected. Different ions are deflected by the magnetic field by different amounts depending on their mass-to-charge ratio. For example, if an ion had a mass of 28 amu and a charge of 1+, its mass/charge ratio would be 28. An ion with a mass of 56 amu and a charge of 2+ would also have a mass/charge ratio of 28.
Because the position along the focal plane is a function of the ion energy, measurement of the position can be interpreted in terms of the particle's energy.
The spectrometer design and the value and shape of the used magnetic field represent the key parameters to optimize the IBA.
Only ion streams with a given m/q deflected by the B field reaches the ion detector. The other ions collide with the walls of the collimator where they will pick up electrons and be neutralized. Eventually, they get removed from the mass spectrometer by the vacuum pump. By varying the magnetic field, you can bring each ion stream, in turn, on to the detector to produce a current that is proportional to the number of ions arriving. The mass of each ion being detected is related to the size of the magnetic field used to bring it on to the detector. The machine can be calibrated to record current (which is a measure of the number of ions) against m/q directly. The mass is measured on the 12C scale (1 amu = 1.67 × 10⁻²⁷ Kg). The detector consists of a Faraday cup or, for low current, of an SEM that permits to be sensitive to the scale of pA (Wang et al., Reference Wang, Sun and Xu2017).
Of course also electrical spectrometers can be used to analyze the produced ion streams from laser-generated plasma, such as ion energy analyzer (IEA) (Laska et al., Reference Laska2000) or Thomson parabola spectrometers (Torrisi et al., Reference Torrisi2013), using both electrical and magnetic deflections, to measure the m/q ratio of high-energetic particles; however, the magnetic field presented in this paper represents a simple solution to detect ions at an energy of the order of 1 keV per charge state or less and to plot their ion energy distribution without use of additional deflections by electrical fields.
Experimental set-up
A Litron compact high-energy Nd:YAG laser operating at 1064 nm wavelength (Litron Lasers, 2018), 3 ns pulse duration, 200 mJ maximum pulse energy, focused at a spot area of about 0.7 mm2, and about 1010 W/cm2 was employed in this experiment to generate plasmas in high vacuum (10−6 mbar). The laser is focused on the target using a lens placed in air, externally to the vacuum chamber, and a glass window of input aperture; it was employed in a single shot. The laser pulse energy is measured using a suitable Joule-meter. A He–Ne laser is employed for all the alignment of the experimental setup.
The target used in this experiment consists of sheets with 0.5 mm thickness and 2 cm × 2 cm surface of polyethylene (PE; CH2), aluminum, and copper. Targets are mechanically moved from outside the chamber by step motors.
The incident angle of the laser beam on the target is 45°. The ion emission from plasma was measured along the normal to the target surface where its maximum yield is expected.
The ion emission was monitored using an IC coupled to a fast storage oscilloscope, placed at a distance of 1.27 m, and permitting to perform measurements in a time-of-flight (TOF) configuration (Torrisi et al., Reference Torrisi2009). IC has an input grid polarized at −50 V to permit the suppression of secondary electrons produced by the impact of the ions with the collector.
A magnetic spectrometer is aligned to the target normal direction along which two pin holes are placed in front of the magnetic field input; the first has 3 mm in diameter and the second 1 mm in diameter, to collimate the entrance of ions and to define exactly the entrance of ion direction with respect to the direction of the magnetic field. ICs can be employed to analyze the deflected ions; however, due to the high ion collimation, their current is low (~0.1–1 nA), and for this reason, it is preferable to a use a windowless electron multiplier (WEM) as a detector (Torrisi et al., Reference Torrisi2018). It was placed at 30° angle with respect to the normal direction and permits to enhance the sensitivity to the detected ions. Its input is vertically collimated at 1 mm aperture to permit a good geometrical position of the deflected and detected ions. WEM uses a power supply of 3 kV for the final anode polarization producing an electron multiplication in the dynodes with a gain of about 105.
The WEM detector is employed in TOF approach using a fast memory oscilloscope. The TOF distance of WEM (or IC) from the target was 1.27 m.
Figure 1a reports the scheme of the experimental set-up used for this experiment and Figure 1b the photo of the apparatus. It is possible to observe the total geometry used, the WEM position, and the position of other ICs employed to monitor the ions and electrons not arriving on the WEM. A ring IC (ICR) was employed to control the total flux of the ions emitted from plasma in the direction of the spectrometer chamber, before the pin holes collimators, at a distance of 90 cm from the target.
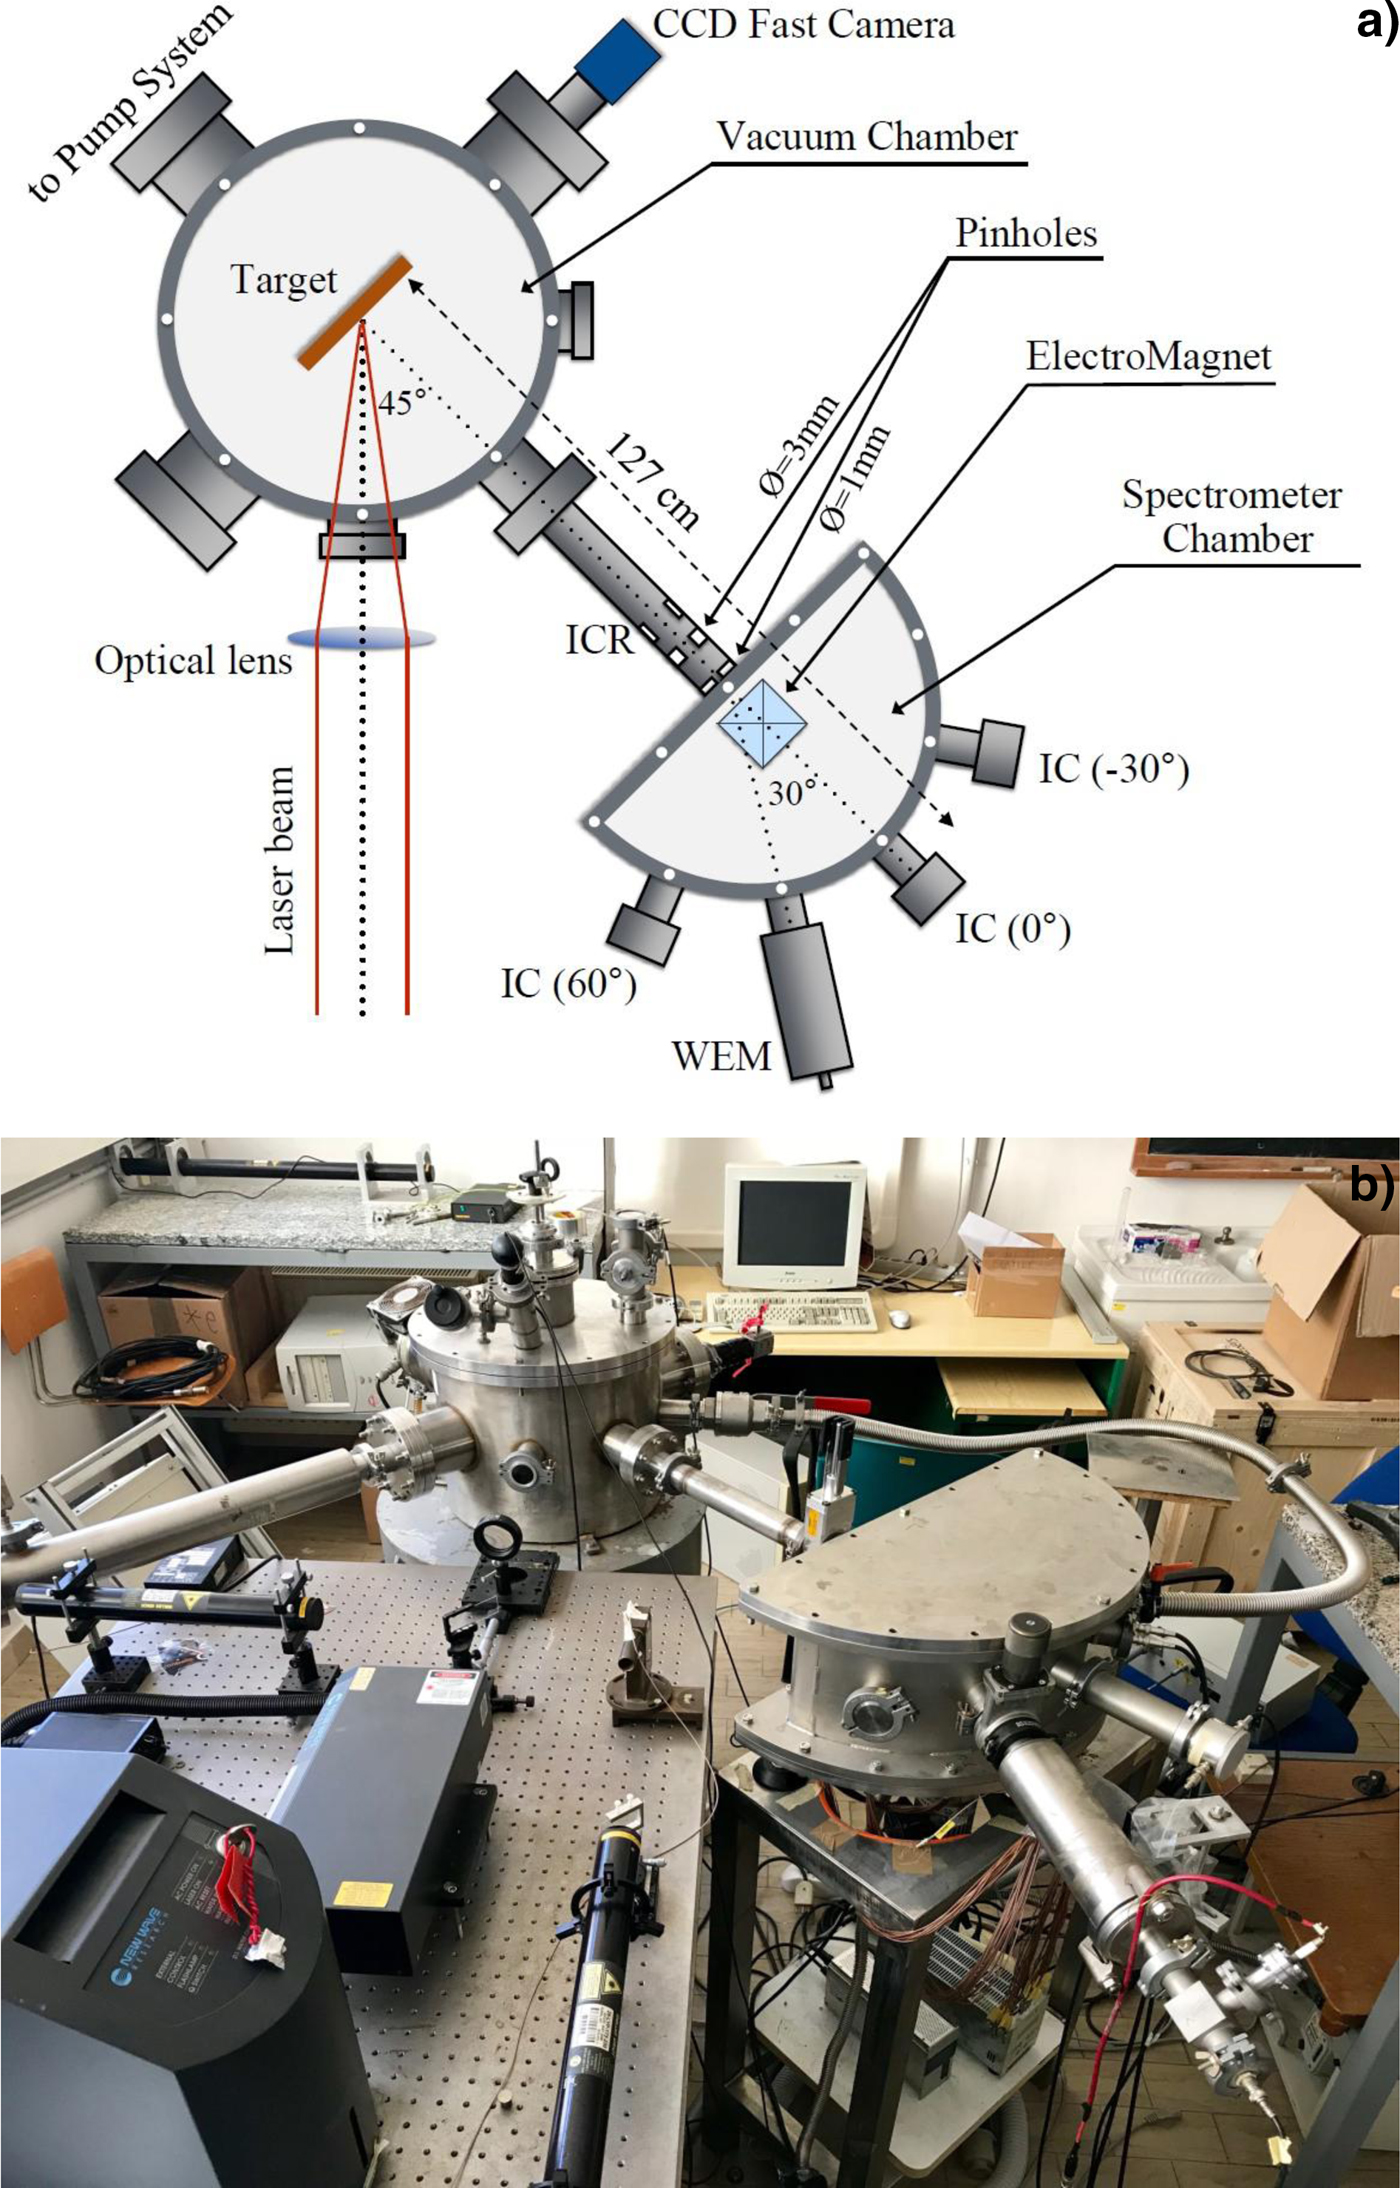
Fig. 1. Scheme of the experimental set-up with vacuum chamber for laser–matter interaction and magnetic spectrometer analysis chamber (a) and photo of the apparatus (b).
An electromagnet generating a magnetic field depending on the current in its coils was employed. Its power supply has a maximum voltage of 24 V and its electrical resistance is 3.8 Ω. The maximum obtainable magnetic field is of 0.35 T.
The solenoid producing the magnetic field has an active expansion volume of 3 cm × 3 cm × 3 cm, as measured with an accurate Gaussmeter (Hirst GM08). Its calibration plot, reporting the magnetic field versus the applied voltage, is presented in Figure 2a, indicating a maximum field of about 0.35 T obtained applying a power supply of 12 V to the coil resistance of 3.8 Ω. Figure 2b reports a photo of the used solenoid, generating the requested magnetic field controllable by the applied voltage. Figure 2c reports a photo of the electromagnet polar expansion view from the 0° aperture of the spectrometer chamber used to control the system alignment.
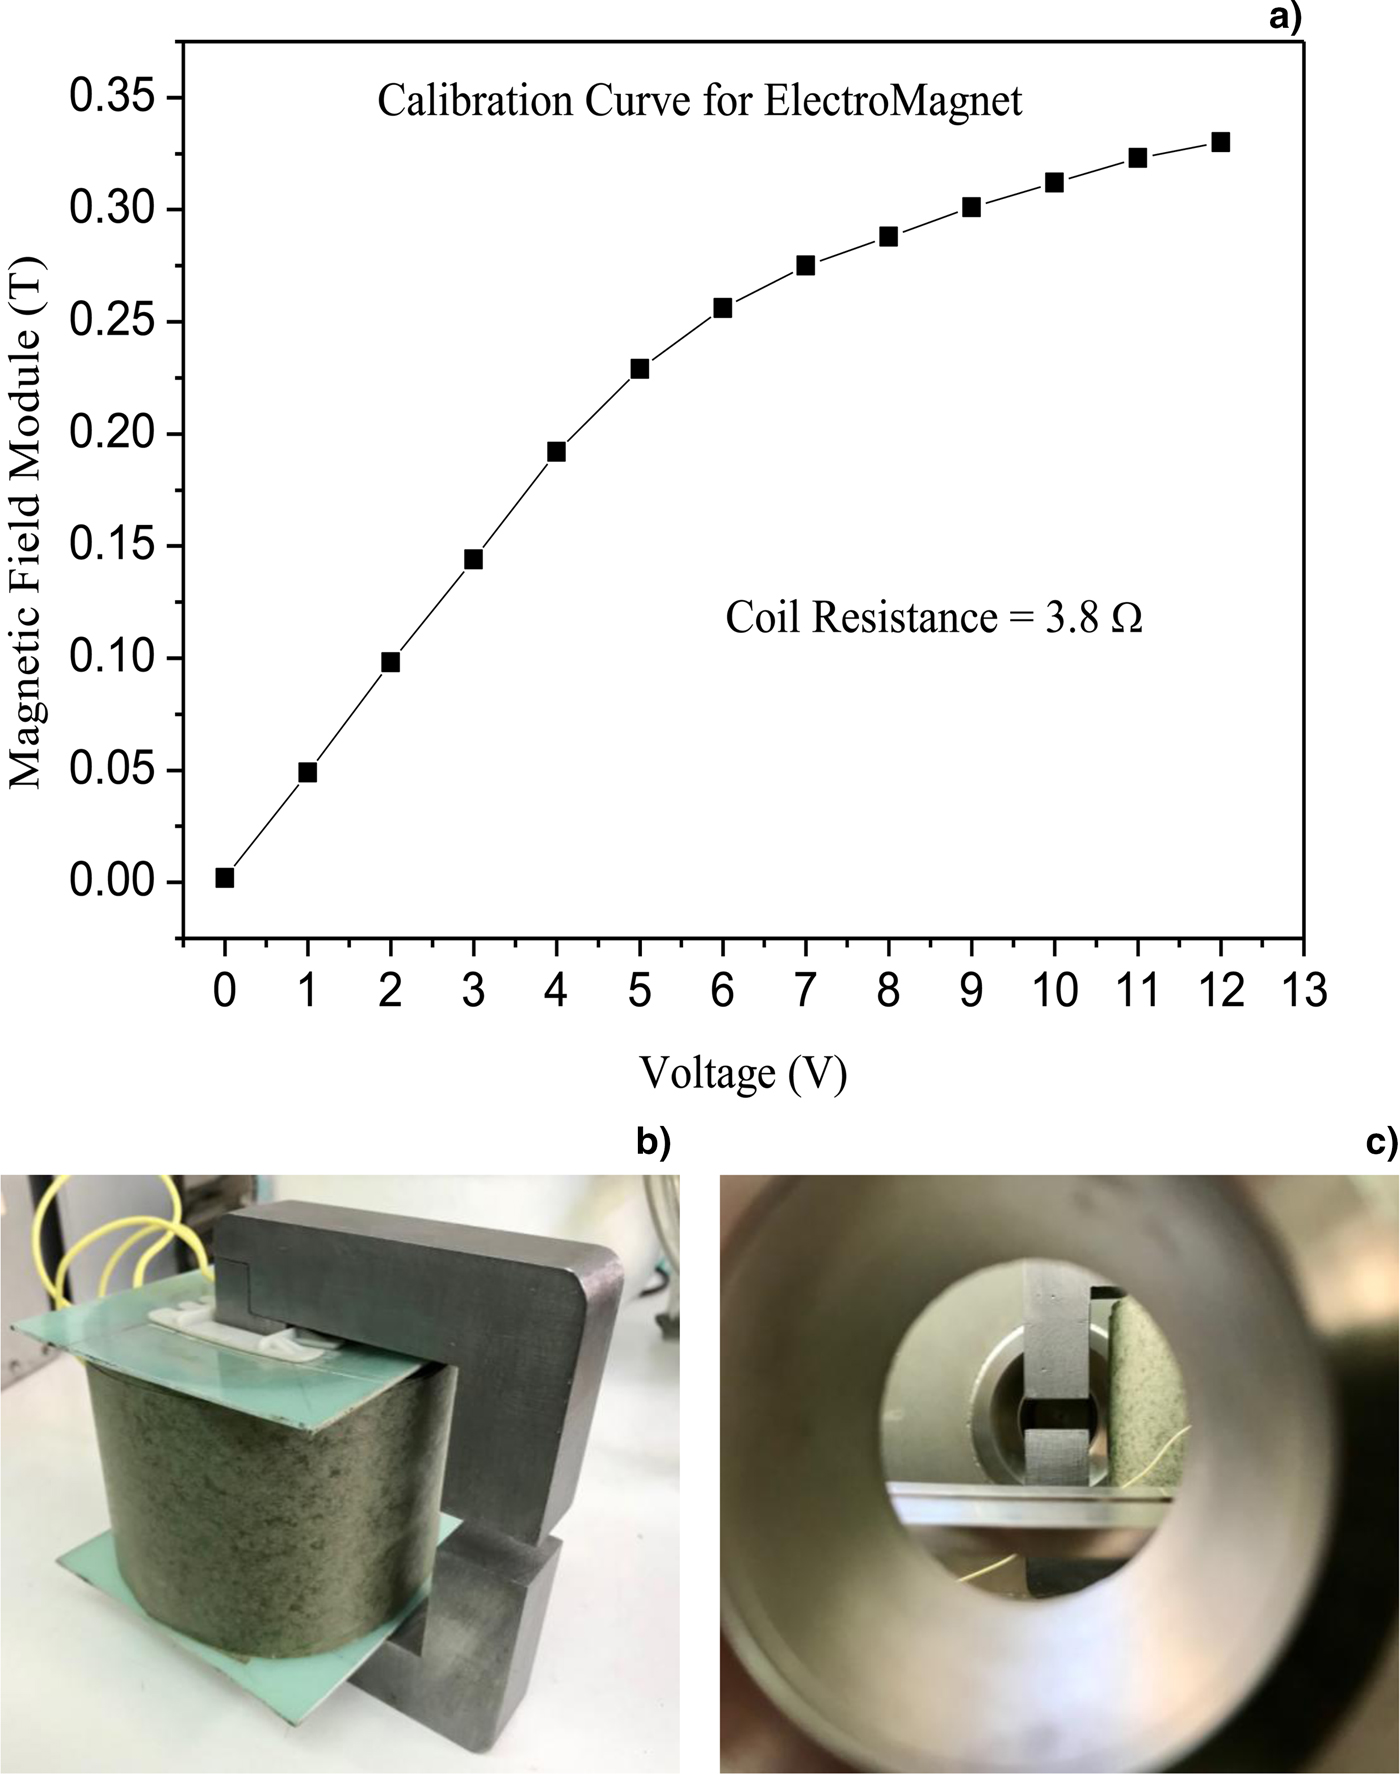
Fig. 2. Magnetic field versus applied voltage reaching a maximum value of about 0.35 T (a), photo of the used solenoid (b), and of the electromagnet polar expansion view from the 0° aperture of the spectrometer chamber employed to control the system alignment (c).
The magnetic field is applied orthogonally to the direction of the incident ions produced by plasma. Ions cross the magnetic field in the middle of its active volume, on a plane on which the WEM detector is placed.
A fast CCD camera operating in the visible wavelength region observes the plasma plume luminosity emitted from the target through a glass window at 90° angle with respect to the incident laser direction, as reported in Figure 1a. Its exposition time is controllable and its minimum value is 5 µs. CCD camera exposition opening is triggered by the TTL laser pulse. The wire connectors between laser trigger and CCD camera were reduced to a minimum value to reduce the time delay. The CCD images are acquired and elaborated using a fast PC.
COMSOL code was employed to perform some simulations of the produced ions from the plasma source, of their deflection applying the magnetic field and of their energy detection. The COMSOL multiphysics simulation software environment facilitates all steps in the modeling process defining the geometry, meshing, specifying the involved physics mechanisms, solving, and then visualizing the results (COMSOL, 2018).
Results
Irradiating the three targets in the same experimental conditions, the obtained ICR spectra are reported in Figure 3a, 3b, 3c for PE, Al, and Cu targets, respectively.

Fig. 3. TOF spectra acquired by the ICR detector, relative to the ions arriving to the collimators, placed before the magnetic deflector, relative to the laser irradiation of polyethylene (a), aluminum (b), and copper (c) target.
The PE spectrum indicates that the faster ions, due to protons, are located at about 6.5 µs, corresponding to the proton kinetic energy of 100 eV. The minimum TOF of carbon ion peak is located at about 10.5 µs, at which corresponds a kinetic energy of 458 eV. Assuming the proton energy to represent the energy acquired in the non-equilibrium plasma for charge state, the carbon ions are ionized up to 4+. The average ICR signal of about 3 mV with a duration of about 10 µs, acquired with an input oscilloscope resistance of 50 Ω and with a mean charge state of 1+ (the charge state 1+ is more intense of the higher that have higher ionization potential and ionization cross-section), indicates a number of detected carbon ions of about 3.8 × 10⁹/laser shot.
ICR does not detect all the ions emitted from plasma because its solid angle is limited and because it is a ring collector that transmits the major ion component toward the axis direction along which the magnetic spectrometer is aligned.
The Al spectrum indicates that the faster protons are located at about 6.5 µs, confirming their maximum proton kinetic energy of 100 eV. The minimum TOF of aluminum ion peak is located at about 12 µs, at which corresponds a kinetic energy of 780 eV. Assuming the proton energy to represent the energy acquired in the non-equilibrium plasma for charge state, the Al ions are ionized up to 7+. The average ICR signal of about 38 mV with a duration of about 15 µs, acquired with 50 Ω and a mean charge state of 1+, indicates a number of detected aluminum ions of about 7.1 × 10¹⁰/laser shot.
The Cu spectrum indicates that the faster protons are located at about 6.5 µs, confirming their maximum proton kinetic energy of 100 eV. The minimum TOF of copper ion peak is located at about 16.5 µs, at which corresponds a kinetic energy of 980 eV. Assuming the proton energy to represent the energy acquired in the non-equilibrium plasma for charge state, the Cu ions are ionized up to 9+. The average ICR signal of about 22 mV with a duration of about 25 µs, acquired with 50 Ω and a mean charge state of 1+, indicates a number of detected copper ions of about 6.9 × 10¹⁰/laser shot.
Using an IC collector at 30° angle with respect to the normal to the target surface, the ion signal is low, due to the high collimation at 1 mm diameter before the magnetic field and to the angular spreading of deflected ions by the magnetic field on the base of their ion energy distribution. Figure 4 reports two typical examples of IC-TOF spectra of collimated (1 mm) and deflected Al (a) and Cu (b) ions by a magnetic field of 0.15 and 0.2 T, respectively. IC has an aperture of about 3 cm diameter; thus, it does not permit to distinguish very well between different charge states, detecting charge states 1+ and 2+ together. It is possible to observe that the electrical ion signals decrease to about one order of magnitude with respect to the ICR detector. Thus, if we collimate its aperture to increase the ion energy resolution, the current becomes too low and comparable to the background.

Fig. 4. Typical examples of IC-TOF spectra of collimated (1 mm) and deflected Al (a) and Cu (b) ions by a magnetic field of 0.15 and 0.2 T, respectively.
After this preliminary analysis of produced plasma using the three different targets, spectra were acquired using the three targets irradiated in the same experimental conditions and different magnetic fields to deflect the ions toward the more sensitive electron multiplier WEM detector.
Figure 5 reports three typical WEM-TOF spectra obtained irradiating PE (a), Al (b), and Cu (c) and using a magnetic field of 0.08, 0.175, and 0.2 T, respectively. The origin of the spectra time is obtained by the photopeak of the ICR detector. Spectra are rich in noise due to the high collimation of the second pin hole having only 1 mm diameter. The negative peaks are due to the detection of the electrons multiplied inside WEM and switched on by the ion impact on the first WEM dynode, ions which are deflected by the applied magnetic field in the horizontal plane. By changing the voltage applied to the coil, i.e. by changing the magnetic field, it was possible to acquire different spectra similar to those reported in Figure 5. The negative peaks indicate that in this case, it is possible to distinguish the different charge states; they are narrow for lighter elements, such as protons, and are larger for higher elements, such as copper ions. The peak width is higher for elements with a lower charge state and narrow for high charge state. These effects are due to the velocity indetermination, Δv, of the ions arriving to the detector and to the ratio (v ± v)/q, which must remain constant for a fixed deflection radius R. It means that for a charge state 2+, the Δv indetermination is double with respect to the 1+ charge state and thus its peak is narrow in time.

Fig. 5. Typical WEM-TOF spectra obtained irradiating PE (a), Al (b), and Cu (c) targets and using a magnetic field of 0.08, 0.175, and 0.2 T, respectively.
By considering the ion yield in terms of the area subtended by each ion peak and by plotting it as a function of the ion velocity, it was possible to plot the ion velocity distributions. These results are reported in the plot of Figure 6 for PE (a), Al (b), and Cu (c) plasmas.

Fig. 6. Ion velocity distributions obtained plotting the WEM ion peak areas as a function of the ion velocity for PE (a), Al (b), and Cu (c) plasmas. The fits were obtained using the CBS (9) function.
The measurements of ion velocity distributions can be fitted using Maxwell distributions, characterized by a mean velocity value, a maximum yield and a velocity width that is inversely proportional to the plasma temperature. Moreover, it is possible to observe that the distributions of different particles and charge states are different. By increasing the charge state, the distribution shifts toward higher velocity, proportionally to the ion charge state. The regular distribution shift with the charge state is due to the electric field generated in the non-equilibrium plasma and driving the ion acceleration along the normal to the target surface. The experimental data in this regime of laser intensity are in agreement with the theoretical model advanced by Torrisi and known as “Coulomb–Boltzmann-shifted” (CBS) regime (Torrisi, Reference Torrisi2016).
The PE plot shows mainly three carbon ion charge states, C+, C2+, and C3+, with mean kinetic energies of about 95, 192, and 297 eV, respectively; while other charge states are negligible with respect to these and comparable with the background. In this case, the mean proton energy is about 93 eV.
The Al plot shows mainly three aluminum ion charge states, Al+, Al2+, and Al3+, with mean kinetic energies of about 130, 248, and 300 eV, respectively; the other charge states are negligible with respect to these and comparable with the background. In this case, the mean proton energy is about 115 eV.
The Cu plot shows mainly four copper ion charge states, Cu+, Cu2+, Cu3+, and Cu4+, with mean kinetic energies of about 125, 288, 403, and 610 eV, respectively; the other charge states are negligible with respect to these and comparable with the background. In this case, the mean proton energy is about 142 eV.
The measured ion energy distributions agree with the Boltzmann fit of the theoretical distribution by CBS approach. From such fits, it is possible to extrapolate an equivalent plasma temperature, kT, which is of 17.4, 22.6, and 24.7 eV for plasma produced by PE, Al, and Cu targets, respectively. Moreover, the plasma potential, V 0, assumes the value of 27.4, 34.1, and 45.9 V in the three cases, respectively. The temperatures and the potentials increase with the effective atomic number of the plasma atoms, i.e. with the electron density of the produced plasma, in agreement with the literature.
The ion kinetic energies are acquired, thanks to the plasma temperature and to the Coulombian effects occurring in the electric fields developed in the non-equilibrium of charge distribution. In particular, the ion velocity along the normal to the target surface has three components: the first due to the thermal interactions, v t, the second due to the adiabatic gas expansion in vacuum, v k, and the third due to the Coulombian forces, v c, depending on the following relations (Torrisi, Reference Torrisi2016):
 $$v_{\rm t} = \sqrt {\displaystyle{{3kT} \over m}}, v_k = \sqrt {\displaystyle{{{\rm \gamma} kT} \over m}}, v_{\rm c} = \sqrt {\displaystyle{{2\;ezV_0} \over m}}, $$
where kT is the plasma temperature, m the ion mass, γ the adiabatic coefficient, e the electron charge, z the charge states number, and V 0 the acceleration potential developed in the non-equilibrium plasma. In order to have an idea of the values assumed by these three different velocity components, Table 1 reports the three components of the ion velocity, thermal, adiabatic expansion, and Coulombian, evaluated for the different ions emitted from PE, Al, and Cu plasmas.
Table 1. The three components of the ion velocity, thermal, adiabatic expansion, and Coulombian, evaluated for the different ions emitted from PE, Al, and Cu plasmas

It is possible to observe that the ion velocity due to thermal interactions and adiabatic expansion is similar, while that due to Coulomb interactions increases with the charge state becoming higher with respect to the thermal ones.
A further investigation of the produced plasma was obtained by the CCD images of the plasma plume for the three targets. These images report the visible emission from plasma during 5 µs exposition time from the laser shot. By fixing the target position and the spatial scale correspondence with the image pixels, it is possible to evaluate the plasma expansion velocity in the vacuum chamber in the three cases, because the exposition time is known and the plasma plume length is measurable. Figure 7 reports the CCD images of the plasma plume for PE (top), Al (middle), and Cu (bottom) targets irradiated in the same experimental conditions. The evaluation of the visible plume gives a velocity of 6.5 × 10³ m/s for PE, 8.7 × 10³ m/s for Al, and 1.1 × 10⁴ m/s for Cu targets. These velocities do not correspond exactly to those calculated by using Eq. (1) and reported in Table 1. This is not a perfect correspondence due to some ns delay in the CCD camera acquisition with respect to the laser shot trigger and due to the light sensitivity of the CCD camera, which is limited and does not observe very low levels of visible light. However, the different plume length indicates that it is correlated mainly to the plasma temperature, growing from PE to Al and up to Cu, more than to the total ion velocity acquired by the different ions inside the plasma.

Fig. 7. CCD images of the plasma plume for PE (top), Al (middle), and Cu (bottom) targets irradiated in the same experimental conditions.
Obtained results were confirmed also by simulation studies obtained using the COMSOL code applied to the geometry employed in the experiment, to the used three-dimensional magnetic field of deflection, and to the measured ion energy distributions. Figure 8 reports some simulation results concerning the used geometry and the deflected Al ions, with a Boltzmann distribution, arriving on the WEM detector. Figure 8a is relative to the detection of Al1+ that, submitted to a magnetic field of 0.175 T, undergoes a deflection with an average radius of 5.76 cm. Figure 8b is relative to the detection of Al2+ that, submitted to 0.175 T, undergoes a deflection with an average radius of 4.29 cm. Figure 8c is relative to the detection of Al3+ that, submitted to 0.175 T, undergoes a deflection with an average radius of 3.49 cm. Due to the overlapping of the three ion energy distributions, the WEM observes the three peaks at different acquisition times, detecting the faster A3+ ions followed by the slower Al2+ and Al1+ ones. The false color scale represents the different ion velocity.

Fig. 8. COMSOL multiphysics simulations concerning the detection of deflected Al1+ (a), Al2+ (b), and Al3+ (c) ions by 0.175 T magnetic field, and plot of the particle velocity as a function of the deflection angle (d).
The plot reported in Figure 8d indicates the particle velocity as a function of the deflection angle at 0.175 T. The velocity indetermination produces a thickening of the curves relative to the three Al charge states. The increment of the velocity indetermination at 30° is of the order of ±4.3%. It determines the peak enlargement in the WEM spectra reported in Figure 5, which are acquired in time, thus are inversely proportional to the ion velocity.
Discussion and conclusions
Although many ion spectrometers can be employed in the experiments involving plasma physics, such as the most versatile Thomson parabola spectrometer (Torrisi et al., Reference Torrisi2013), IEA (Laska et al., Reference Laska2000), and complex mass spectrometers, significant difficulties are encountered in the spectrometry of low-energetic ions, with energies below 1–10 keV, such as that produced by the new generation of laser ion sources using ns pulses and intensities of about 1010 W/cm2. In these cases, the ion energy is insufficient to reach the active zone of solid-state detectors, to produce high ionizations in chamber detectors and to produce track images in reactive films. The proposed simple magnetic spectrometer permits to realize a plasma diagnostics also at a plasma temperature of 10 eV detecting ions also at 100 eV of energy and permitting to go back to their ion energy distributions.
The used electromagnet is simple to build and permits to realize stable and uniform magnetic field up to 0.35 T for selection of ions based on their Lorentz deflection.
Of course, the prototype used in this experiment needs to be improved to reach the higher magnetic field, to use a more useful WEM reaching a higher sensitivity in terms of ion current and angular distribution and in terms of its controllable system to deflect ions up to energies of the order of 100 keV per charge state.
The need to characterize the studies plasma comes from the different applications that it has. Laser ion sources are more and more employed to produce ions at high-current and high-charge state to be injected in big ion accelerators, such as cyclotrons (Gammino et al., Reference Gammino2000). Proton ion sources can be investigated controlling the prepared hydrogenated targets using low-intensity lasers before to irradiate the target in large facilities using fs lasers at intensities higher than 1018 W/cm2 (Cutroneo et al., Reference Cutroneo2014). Pulsed laser deposition technique can be better controlled using plasma diagnostics to improve the adhesion of emitted particles with the covering substrate (Lanzafame et al., Reference Lanzafame2010). Post ion acceleration can be employed starting from such produced plasmas and apply a high electric field of post-acceleration of the order of 30–100 kV in order to produce multi-ion beams used for ion implantation (Cutroneo et al., Reference Cutroneo2016).
Work is in progress to increase the deflecting magnetic field and to analyze also ion energy distributions of heavy elements. Moreover, the future spectrometer provides the use of multiple WEM detectors distributed at different deflection angles to speed up the ion energy distribution measurements.
Acknowledgments
This work was supported by the “Research and Mobility” project of the Messina University No. 74893496, scientifically coordinated by Professor L. Torrisi.


