


INTRODUCTION
To develop the relativistic electron beam sources, the cathode materials are the key factor, and carbon-fiber cathode has been an appropriate candidate to generate electron beam (Cheng et al., Reference Cheng, Liu and Qian2013; Fan et al., Reference Fan, Liu and Lv2013; Liu et al., Reference Liu, Zhang, Fan, Hong and Feng2012; Peng et al., Reference Peng, Liu, Song and Su2011; Shao et al., Reference Shao, Tarasenko, Zhang, Baksht, Yan and Shut'Ko2012; Teng et al., Reference Teng, Chen, Sun, Song, Xiao and Du2013; Zhang et al., Reference Zhang, Tarasenko, Shao, Baksht, Burachenko, Yan and Kostyray2013a; Reference Zhang and Liu2013b; Reference Zhang and Liu2012b). Carbon-fibers are usually utilized to reinforce composite materials due to their superior mechanical properties such as high specific strength modulus, low expansion coefficient, small density, good environmental compatibility, long-term durability, and high resistance to chemical corrosion (Li et al., Reference Li, Liu, Wan, Xu, Cheng and Wen2009a; Pan et al., Reference Pan, Zhang, Peng and Qiu2010; Tiwari et al., Reference Tiwari, Sharma, Panier, Mutel, Mitschang and Bijwe2011). Carbon-fibers are used in vacuum electronic tubes because this type of high-current electron beam source typically has a long life-time and low work function while producing a uniform plasma across the cathode surface at a small plasma expansion velocity (Li et al., Reference Li, Chang, Zhang, Liu, Chen and Wen2012; Reference Li, Cheng, Zhang, Ji, Chang, Xu, Liu, Wen, Li and Wan2011; Reference Li, Liu, Xu, Chang, Wan and Wen2009c; Reference Li, Liu, Xu, Chen, Chang, Wan and Wen2009d). By combining CsI with carbon-fibers, strong plasmas can be generated from the cathode surface under slower plasma expansion while the diode gap during the main voltage pulse is almost unchanged (Li et al., Reference Li, Liu, Wen and Liu2009b). Additionally, the carbon-fibers can be subjected to different types of surface modification, for example, chemical and thermal processes, electron beam irradiation, and ultrasonic bombardment (Nohara et al., Reference Nohara, Filho, Nohara, Kleinke and Rezende2005). It has been observed that plasma treatments can enhance the roughness and adsorption ability of the fiber surface and some polar groups can be introduced onto the fiber surface (Kolb et al., Reference Kolb, Mattson, Edelblute, Hao, Malik and Heller2012).
An atmosphere plasma produced by dielectric barrier discharge or radio-frequency discharge can be used to modify carbon-fibers and non-thermal atmospheric plasmas have received increasing attention in surface and materials processing, especially pertaining to biomedical engineering (Kolb et al., Reference Kolb, Mattson, Edelblute, Hao, Malik and Heller2012). Compared to conventional plasma systems confined in a vacuum chamber, non-thermal atmospheric plasmas have advantages such as lower operating cost, smaller equipment cost-of-ownership, and production of abundant radical species (Lu et al., Reference Lu, Jiang, Xiong, Tang, Hu and Pan2008a). Atmospheric plasma torches, one type of non-thermal atmospheric plasma sources, are capable of generating plasmas in open space rather than in a discharge gap (Lu et al., Reference Lu, Jiang, Xiong, Tang, Hu and Pan2008a). The atmospheric plasma torches are flexible, compact, and efficient (Lu et al., Reference Lu, Jiang, Xiong, Tang and Pan2008b), thereby rendering direct treatment of large samples relatively straightforward. Plasma torches are commonly generated by direct-current micro-hollow cathode discharge, high-frequency dielectric barrier discharge, radio-frequency inductively-coupled microwave discharge, as well as radio and microwave coupled discharge (Sarani et al., Reference Sarani, Nikiforov, Geyter, Morent and Leys2011; UGent et al., Reference UGent, UGent, UGent, UGent and UGent2011; Wu et al., Reference Wu, Lu, Ostrikov, Liu and Pan2011; Reference Wu, Wang, Huang, Lu and Ostrikov2012; Yan et al., Reference Yan, Zou, Lu, He, Shi, Xiong, Gao, Xiong, Li, Ma, Yu, Wang, Wang and Yang2009; Yousfi et al., Reference Yousfi, Hennad, Benhenni, Eichwald and Merbahi2012; Zhang et al., Reference Zhang, Sun, Feng, Wang, Liang, Zhu, Becker, Zhang and Fang2012a).
Although carbon-fiber reinforced aluminum composites have been processed by high-current pulsed electron beams (Li et al., Reference Li, Liu, Xu, Chen, Chang, Wan and Wen2009d), the use of non-thermal atmospheric plasma torch is not as common and the mechanism of surface property enhancement is not well understood. In this work, the efficacy of the non-thermal atmospheric plasma torch treatment of carbon-fiber reinforced aluminum composite is investigated. The non-thermal plasma torches are produced between two coaxial electrodes separated by a small gap. A pulsed high voltage is applied to the inner electrode whereas the outer electrode is grounded. The untreated and treated materials are characterized systematically by scanning electron microscopy (SEM), energy-dispersive X-ray spectroscopy (EDS), and Raman spectroscopy.
EXPERIMENTAL DETAILS
Figure 1a depicts the schematic of the non-thermal plasma device operated at atmospheric pressure. The device includes three main sections, a power supply or high voltage generator to produce the high voltage, gas injection system, and gas discharge system. The high voltage generator consists of a transformer and modulator, and the generated high voltage of 10–50 kV is applied to the copper electrode of the plasma device. The copper electrode which serves as the anode has a diameter of 2 mm and length of 100 mm. The length, inner diameter, and outer diameter of the stainless steel tube are 87 mm, 20 mm, and 30 mm, respectively. The copper electrode is located at the axis of the stainless steel tube. As shown in Figure 1, the stainless steel cone is connected to the right end of the tube and the left end of the tube is sealed by an insulator made of a macromolecular polymer. The tip of the cone is open and the interval between the hole and right end of the tube is 15 mm. The tube and cone constitute the shell of the chamber for the gas discharge.
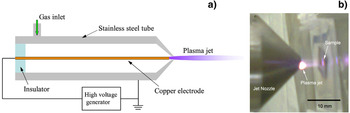
Fig. 1. (Color online) (a) Schematic of the non-thermal nitrogen plasma torch at atmosphere pressure, including the high-voltage generator, insulator, copper electrode, stainless steel tube, and gas inlet. (b) Photograph of the plasma torch nozzle interacting with the sample.
In the experiments, nitrogen was bled into the chamber via the inlet at the side of the chamber to produce the discharge. The shell of the chamber was grounded by copper wires. The gas discharge triggered between the gaps of the two electrodes produced the gas plasma in the gap if the chamber was fully sealed. However, as a result of the gas flow, the gas plasma generated at atmospheric pressure was transported from the gap between the two electrodes through the small hole at the end of the chamber. Figure 1b presents a visual illustration of the interaction between the atmospheric plasma torch and sample. Figure 2 shows the dependence of current and voltage of plasma torch discharge. Here the current and voltage are measured by changing the resistance connected with torch outer shield and ground. One can see that the discharge current remained at the order of milliamperes, and increased with the applied voltage.
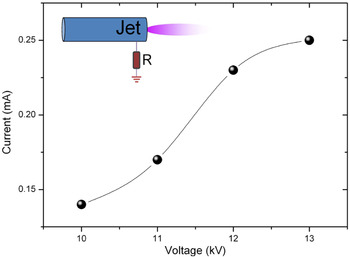
Fig. 2. (Color online) Current versus voltage of plasma torch discharge.
The carbon-fiber-reinforced aluminum composite was produced by the squeeze casting technique. The carbon-fibers had a temperature range of 300 to 3 K and the diameter of the fibers was 5 µm. By using 99.95% nitrogen at 700°C under 10 PA, the epoxy layer was removed from the carbon-fibers which were then stretched in the fixed direction. The fibers were placed in a stainless steel tube on a crucible. An aluminum melt was incorporated into the carbon fibers by a squeeze machine. After cooling, the carbon-fiber-reinforced aluminum composite was produced.
RESULTS AND ANALYSIS
The plasma torch is transported from the discharge by the flowing gas through this discharge channel. This distance between the copper electrode and nozzle opening defines the gap between the electrodes and is fixed at 1 mm. The gas discharge occurs in the small gap and the electric field in the gap between the two electrodes is on the order of 107 V/m. It should be pointed out that this is the externally applied electric field, but the microscopic electric field on the surface of the tip of the copper electrode can exceed the externally applied electric field. The diameter of the nozzle opening is 3 mm which is critical to the operation of the gas discharge and generation of the plasma torch. The diameter of nozzle opening affects the radial dimension of the plasma torch. A significant part of the energy produced by the discharge results in heating and increases the temperature of the expelled plasma torch. Figure 3 presents the time evolution of the surface temperature of the thermal probe used to detect the atmospheric plasma torch. The thermal probe is located at an axial distance of 8 mm and the axis center of the plasma torch. The surface temperature of the thermal probe increases to 48°C within 40 s after the plasma torch is turned on and then stabilizes. After the plasma torch is turned off, the surface temperature of the thermal probe decreases rapidly back to room temperature. The axial and radial distributions of the plasma torch temperature can be measured by adjusting the position of the thermal probe relative to the nozzle opening.
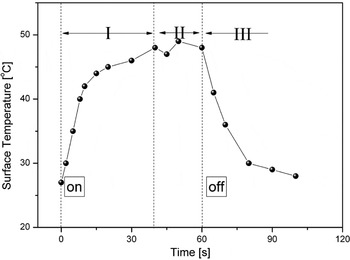
Fig. 3. Relationship of surface temperature of the thermal probe versus measurement time as the plasma torch is being switched on and off with the distance between the opening of the plasma torch nozzle and surface of thermal probe being 8 mm (room temperature = 27°C).
Figure 4 shows the effect of gas flow rate on the length of plasma jet. It can be observed that the maximum length of plasma jet occurs at the flow rate of about 3 l/min, and higher or lower flow rate will cause the reduction of plasma jet length. Therefore, the flow rate of argon gas remains at about 3 l/min during the experiments of surface treatment of carbon fiber. The plasma torch with a luminous plume of around 15 mm in length is expelled from the discharge channel as shown in Figure 1b. The temperature distribution versus distance from the nozzle opening is presented in Figure 5a. The temperature is recorded by a thermal probe and room temperature is 27°C. As the axial distance d from the nozzle opening is increased to 6 mm, the temperature of the plasma torch increases from 36°C at d = 1.5 mm to around 47°C at d = 6 mm. For 6 mm < d < 8 mm, the temperature of plasma torch is around 47°C, whereas for 8 mm < d < 12.5 mm, the temperature diminishes from 47°C to 40°C. For 12.5 mm < d < 22 mm, the temperature of plasma torch remains at around 40°C, but when the distance exceeds 22 mm, the temperature of plasma torch begins to decrease again. Some plastic or biological samples are prone to damage at high temperature. For example, if cellular materials are subjected to a temperature a few degrees higher than the ambient one, the cellular materials may suffer irreparable damage. In the case of plasma treatment of cellular materials, the proper temperature can be achieved by adjusting the axial position of the sample relative to the nozzle opening. Hence, the axial distribution of the plasma torch is very important and determines the appropriate location of the sample. In our experiments, the visible length of the plasma torch is about 15 mm and according to the axial distribution of plasma torch, the effective length of the plasma torch is estimated to be over 20 mm, as shown in Figure 5a. In the plasma treatment of the carbon-fiber-reinforced aluminum composite, the axial distance of sample relative to the nozzle opening is selected to be 8 mm corresponding to the maximum allowable temperature. The radial distribution of the plasma torch temperature at different distances is presented in Figure 5b. Regardless of the axial distance, the plasma torch temperature decreases to below 37°C at 1.5 mm off the axis of the plasma torch and remains at over 30°C until the radial distance exceeds 2.5 mm. The visible radius of the plasma torch is about 1.5 mm which is possibly limited by the geometric diameter (3 mm) of the nozzle opening. Actually, the radius of the plasma torch should at least exceed the visible radius of the plasma torch due to radial diffusion of the ions and it determines the effective area exposed to the plasma torch and extent of interaction between the plasma torch and sample surface.
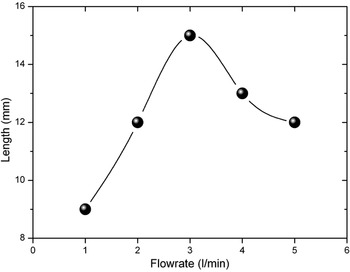
Fig. 4. Effect of argon flow rate on the length of plasma jet.
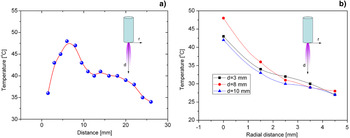
Fig. 5. (Color online) Temperature distribution of the atmospheric plasma torch: (a) Along the axial direction and (b) Along the radial direction. The temperature data are obtained by a thermal probe. The operating gas is nitrogen and room temperature is 27°C.
Figure 6a presents the SEM image of the surface of the carbon-fiber-reinforced aluminum composite untreated by the nitrogen atmospheric plasma torch. As shown by the side view, some fillings composed of possibly aluminum or aluminum-oxide are distributed among the fiber gaps. These fillings link the carbon-fibers and produce excellent electrical or mechanical connection between the fibers to potentially increase the hardness of the materials. Here, the carbon-fiber-reinforced aluminum composite is placed at the axial center of plasma torch at a distance of 8 mm at which the temperature of the nitrogen atmospheric plasma torch is around 47°C based on the results shown in Figure 5. After plasma processing for 15 min, small quantities of particles several hundreds of nanometers in size having a non-uniform distribution can be observed from Figure 6b. The carbon-fibers have a smaller amount of scraps compared to the original surface, indicating that the plasma torch cleans and smooth the surface. As the plasma processing time increases, the number of particles goes up, as shown in Figure 6c. The surface of the carbon-fibers begins to roughen after 30 min and after 60 min, the density, size, and amount of particles increase obviously, as shown in Figures 6b and 6d. Some deposited materials produced by the plasma torch also appear on the carbon-fibers.
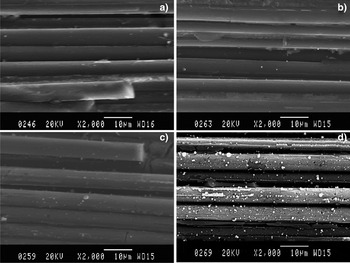
Fig. 6. SEM images of the untreated and treated surfaces of the carbon-fiber-reinforced aluminum composite at an amplification factor of 2000: (a) Untreated sample, (b) Sample treated by the plasma torch for 15 min, (c) Sample treated by the plasma torch for 30 min, and (d) Sample treated by the plasma torch for 60 min. The axial distance of the sample surface from the nozzle opening is 8 mm and the gas is nitrogen.
To further determine the surface characteristics of carbon-fiber-reinforced aluminum composite treated by nitrogen atmospheric plasma torch, Figure 7a depicts the SEM micrograph of the surface of the carbon-fibers after plasma treatment for 15 min. Many particles with diameters of less than 1 µm are observed from the surface and some particles are as small as 100 nm. The EDS results (inset in Fig. 7a) reveal that the particles are composed of copper-oxide. The apparent source of copper is the copper electrode. Figure 7b shows the SEM image of fibers after plasma treatment for 30 min and a layer of copper-oxide is observed although the surface is still not totally covered. As the surface treatment time is increased further, the surface is finally covered entirely by copper-oxide, as shown in Figure 7c. Figure 7d shows the magnified surface of the treated carbon-fiber in Figure 7c disclosing many scraps among the particles. Furthermore, the particles are not spherical like the ones in Figure 7a and these particles are clusters of copper-oxide. It should be pointed out that the lack of copper-nitride on the surface of carbon-fiber may be due to the rapid decomposition of copper nitride by heating in air.
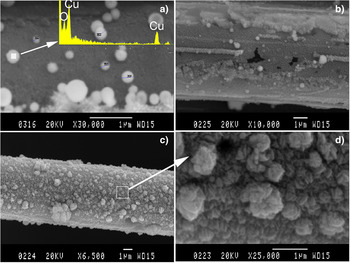
Fig. 7. (Color online) SEM images: (a) Carbon-fiber-reinforced aluminum composite treated by the plasma torch for 15 min (30,000×) with the inset being the EDS spectrum, (b) Sample treated by the plasma torch for 30 min (10,000×), (c) Sample treated by the plasma torch for 60 min (6,500×), and (d) Sample treated by the plasma torch for 60 min (25,000×). The axial distance between the sample surface and nozzle opening is 8 mm and the plasma gas is nitrogen.
The structural changes in the carbon-fiber-reinforced aluminum composite before and after the plasma torch treatment are determined by Raman spectroscopy which is a useful tool to discern the ordered and disordered crystalline structures of carbon. Graphitic carbon and other sp2 bonded amorphous carbons exhibit strong Raman scattering thus providing useful information about the phases and structural changes in the materials. The carbon-fiber-reinforced composite shows one apparent peak at about 1589 cm−1 (G band) and another apparent peak at about 1363 cm−1 (D band) prior to the plasma treatment, as shown in Figure 8a. The G band arises from all sp2 bonds of graphite due to the vibrational mode of E2g whereas the G band corresponds to the sp2 bonds in the broken aromatic rings of disorder graphite due to the A1g vibration mode (Nohara et al., Reference Nohara, Filho, Nohara, Kleinke and Rezende2005). The ratio of the D and G bands (I D/I G) can be regarded as a measure of the crystalline order of carbon materials. The I D/I G values are derived from the Raman data using the Lorentzian function based on the ratio of the areas of the D and G bands. As shown in Figure 8a, I D/I G is calculated to be 1.48 for the untreated carbon-fiber-reinforced aluminum composite. After plasma treatment for 15 min, the D band and G band are located at 1353 cm−1 and 1579 cm−1, respectively and the I D/I G value is 2.61, as shown in Figure 8b. After 30 min of plasma treatment, the D and G bands are at 1350 cm−1 and 1570 cm−1, respectively and I D/I G is 2.15, as shown in Figure 8c. After 60 min, the locations of the D and G bands are 1354 cm−1 and 1584 cm−1, respectively and I D/I G is 1.61, as shown in Figure 8d. Hence, the band locations are similar for the untreated and treated samples, but the I D/I G ratios are different. The I D/I G ratio increases after the plasma treatment but among the treated samples, the ration decreases with treatment time.
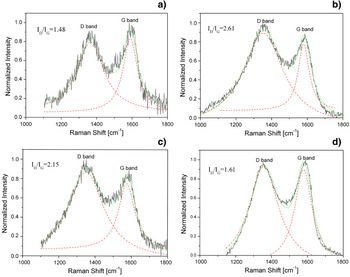
Fig. 8. (Color online) Raman spectra acquired from the carbon-fiber-reinforced aluminum composite: (a) Untreated sample (reference), (b) Sample treated by the plasma torch for 15 min, (c) Sample treated by plasma torch for 30 min, and (d) Sample treated by plasma torch for 60 min.
The graphite crystalline size L a is equal to C/(I D/I G), where C = 4.4 nm (Nohara et al., Reference Nohara, Filho, Nohara, Kleinke and Rezende2005). Figure 9 presents the surface crystalline size of the untreated and treated samples. After treatment for 15 min, the graphite crystalline size decreases from about 3 nm to about 1.7 nm. As the treatment time increases, the graphite crystalline size increases to about 2.7 nm, but on a whole, after the surface treatment, the graphite crystalline size becomes smaller than that of the untreated materials. The trend reflects the alterations in the ordering of the graphitic structures. The smaller graphite crystalline size after the plasma surface treatment indicates less ordering of the graphitic structures compared to the untreated sample. Furthermore, as the treatment time increases, the larger graphite crystalline size shows more ordering of the graphitic structures. To reduce the graphite crystalline size in the carbon-fibers, it is necessary to control the treatment time.
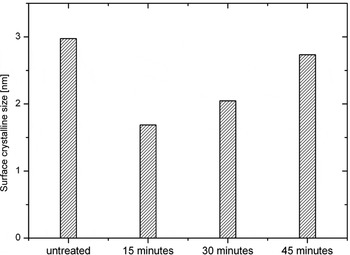
Fig. 9. Comparison of crystalline size of untreated and treated carbon fibers after plasma treatment for different durations.
To further investigate the deposition mechanism, the surface of the copper electrode is examined by SEM. Figure 10 depicts the SEM micrographs of the corroded surface on the copper electrode after the gas discharge. The surface is obviously damaged as shown in Figure 10a. Figures 10b and 10c further disclose the presence of craters and fragments on the copper electrode. As shown in Figure 10c, adjacent craters form honeycombs and the lateral dimension of these craters is about 10 µm. The fragments and craters are distributed randomly on the corroded surface and particles with diameters of several micrometers can be observed from the craters in Figure 10d. Formation of fragments, craters, and particles is closely related to the ablation process on the electrode. For metal electrodes, the high-voltage discharge characteristics are dictated by the craters and micro-protrusions. The edge between adjacent craters forms micro-protrusions from which ejection of electrode materials arises. As the high-voltage discharge continues, the micro-protrusions disappear gradually and the craters become larger. The ejected electrode materials lead to the formation of the particles in the craters shown in Figure 10d. Therefore, deposition of copper onto the surface arises from ablation of the copper electrode during high-voltage gas discharge.
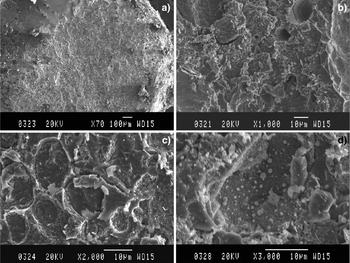
Fig. 10. SEM images of corroded surface on the copper electrode after gas discharge at different magnifications: (a) 70 × , (b) 1,000 × , (c) 2,000 × , and (d) 3,000×.
DISCUSSIONS
Carbon-fiber-reinforced aluminum composite samples prepared by squeeze casting are treated by an atmospheric nitrogen plasma torch. The axial and radial distributions of the plasma temperature are determined in order to select the optimal treatment temperature and sample location. The maximum temperature is observed at an axial distance of 8 mm from the nozzle opening. SEM discloses the presence of particles on the plasma-treated materials and as the treatment time increases, the density and number of deposited particles go up. After 60 min, a continuous layer composed of copper-oxide is deposited onto the sample. Raman spectroscopy reveals that the D band and G band locations of the untreated and plasma-treated samples are similar but the area ratios are different. The areas of the D band and G band increase after the plasma treatment due to the reduced graphite crystalline size in the carbon-fibers. Analysis of the copper electrode surface reveals materials ablation from the discharge thereby releasing copper from the source. This plasma torch treatment is effective in altering the surface properties of carbon-fiber-reinforced aluminum composite.
Based on the experimental observations, the plasma generated by atmospheric plasma torch is dusty plasma in nature. Dusty plasma is an ionized gas containing small particles of solid matter, which become electrically charged, as shown in Figure 11. Particles may be dielectric or conducting, and typically range from nanometer clusters to millimeter sizes. The interaction between a dust grain and the surrounding plasma is an extremely complicated two-way process. This interaction is the charging of the dust grain. The charge depends on the fluxes of ions and electrons from the plasma onto the grain surface. The charged grains will modify their plasma environments by setting up space charges and electrostatic fields. The dust plasma produced by atmospheric plasma torch is still rather poorly understood, and we need better understanding of it. Here, the dusty plasma is assumed to obey the fluid dynamics. According to the mass conversation equation, we can obtain
 $$\displaystyle{{\partial \lpar {\rm \rho} v_Z\rpar \over \partial Z}} + \displaystyle{1 \over R} \displaystyle{{\partial \lpar R{\rm \rho} v_R\rpar \over \partial R}} = 0 \comma \;$$
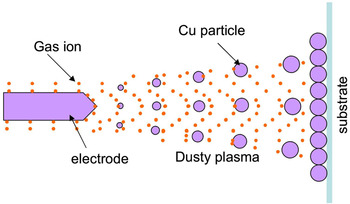
Fig. 11. (Color online) Dusty plasma produced by atmospheric plasma torch.
which is at cylindrical coordinates, and ρ is the mass density of plasma torch, v z is the axial velocity of plasma drift, v R is the radial velocity of plasma drift. Thus, it can be transferred to be
 $$\displaystyle{{\partial \lpar {\rm \rho} v_Z\rpar \over \partial Z}} + \displaystyle{{\partial \lpar {\rm \rho} v_R\rpar \over \partial R}} + \displaystyle{{\rm \rho} v_R \over R} = 0.$$
Here, the angular velocity of plasma drift is neglected, namely, v φ= 0. According to Bernoulli equation, we can obtain
 $$dP = - \displaystyle{{\rm \rho} \over 2} d \lpar v_R^2 + v_Z^2 \rpar .$$
Further, the ion-acoustic velocity C s can be described as
 $$C_s^2 = \displaystyle{dP \over d{\rm \rho}}\comma \;$$
where P is the internal pressure of dusty plasma torch. Thus,
 $$d{\rm \rho} = - \displaystyle{{\rm \rho} \over C_s^2} \lpar v_R dv_R + v_Z dv_Z\rpar \comma \;$$
Additionally, the following equations can be considered,
 $$\displaystyle{{\partial {\rm \rho} \over \partial Z}} = - \displaystyle{{\rm \rho} \over C_s^2} \left(v_R \displaystyle{\partial v_R \over \partial Z} + v_Z \displaystyle{\partial v_Z \over \partial Z} \right)\comma \;$$
 $$\displaystyle{\partial {\rm \rho} \over \partial R} = - \displaystyle{{\rm \rho} \over C_s^2} \left(v_R \displaystyle{\partial v_R \over \partial R} + v_Z \displaystyle{\partial v_Z \over \partial R} \right).$$
By the combination of the above equations, we can obtain
 $$\eqalign{&\left(1 - \displaystyle{v_R^2 \over C_s^2} \right)\displaystyle{\partial v_R \over \partial R} - \displaystyle{v_Z v_R \over C_s^2} \displaystyle{\partial v_R \over \partial Z} - \displaystyle{v_R v_Z \over C_s^2} \displaystyle{\partial v_Z \over \partial R}+ \left(1 - \displaystyle{v_Z^2 \over C_s^2} \right)\displaystyle{\partial v_Z \over \partial Z} = - \displaystyle{v_R \over R}.}$$
For the dusty plasma torch with axial symmetry and non-rotation,
 $$\displaystyle{\partial v_R \over \partial Z} = \displaystyle{\partial v_Z \over \partial R}.$$
Thus, we can obtain the following equation,
 $$\eqalign{&\left(1 - \displaystyle{v_R^2 \over C_s^2} \right)\displaystyle{\partial v_R \over \partial R} - \displaystyle{v_Z v_R \over C_s^2} \displaystyle{\partial v_R \over \partial Z} - \displaystyle{v_R v_Z \over C_s^2} \displaystyle{\partial v_Z \over \partial R} + \left(1 - \displaystyle{v_Z^2 \over C_s^2} \right)\displaystyle{\partial v_Z \over \partial Z} = - \displaystyle{v_R \over R}.}$$
Here, the axial velocity of plasma drift is assumed to be the ion-acoustic velocity C s, v z = C s, and the radial velocity of plasma expansion v R is independent of Z. According to Eq. (10), the radial velocity of plasma expansion v R can obtained, as shown in Figure 12a. Based on Eq. (5) and the values of v R and v z, the plasma density can be calculated, as shown in Figure 12b. In Figure 12c, the value of ρv 2/2 is presented by using the values of plasma density and plasma expansion velocity. In Figure 12d, the pressure difference relative to the axial center of plasma jet ΔP is calculated by using Eq. (3) and the values of plasma density and plasma expansion velocity. Here, it should be pointed out that the results in Figure 12 are obtained under the conditions of different emitter radii or internal electrode radii. It was found from Figure 12a that the plasma expansion velocity grows with the increase in the distance from the emission center. Further, for the smaller emission radius, the plasma expansion velocity increased faster. In each case, rapidly increasing velocity occurs close to the emission center, which is followed by a slowly changed process. Most notably, the plasma torch with different emission radii is a supersonic flow. Figure 12b shows the distribution of relative plasma density. One can see that the plasma density fast decrease along the radial direction of plasma torch. Thus, a boundary between the emission zone and rarefaction plasma region is generated. Specially, at emission radius of 1 mm, the radius of plasma boundary can be estimated to be less than 2 mm. For the copper electrode of 2 mm diameter, namely, the radius of emission radius was 1 mm, the visible radius of plasma torch was about 1.5 mm. Thus, the calculated result agrees well with the experimental observation. From the values of ρv 2/2 can be obtained for different emission radii in Figure 12c, one can see that in each case, the value of ρv 2/2 from the peak to steady-state decreased at the distance of 1 mm from the emission center. Further, the pressure difference relative to the axial center of plasma torch is presented in Figure 12d. One can see that as the radius of emission center increased from 0.2 mm to 1 mm, the pressure difference grew faster and faster. That is, the plasma torch with a small emission radius will produce a low internal plasma pressure.
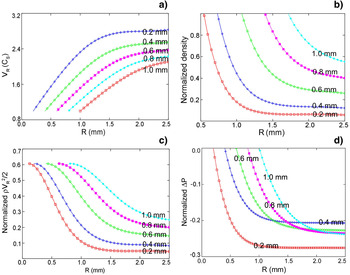
Fig. 12. (Color online) (a) velocity distribution of plasma expansion, (b) plasma density, (c) value of ρv 2/2, and (d) pressure difference.
In this paper, the atmospheric plasma torch was applied to treat the surface of carbon-fiber-aluminum composite. It was found experimentally that the plasma produced by atmospheric plasma torch is dusty plasma, due to the generation of copper particles participating in the ejection process of plasma torch. Thus, the dusty plasma including copper particles induced the deposition of copper-oxide on the surface of carbon-fiber-aluminum composite. The plasma torch was analyzed by fluid dynamics, and it was found that the plasma can be controlled by adjusting the dimensions of internal electrode. Currently, in the field of pulsed power and microwave irradiation, the key technique is to improve the electron beam sources. Further, the surface treatment of cathode is a major approach to enhance the property of electron beam sources. In our previous works, the introduction of heavier particles on the surface of cathode can lower the velocity of diode gap closure and improve the uniformity of electron emission (Li et al., Reference Li, Liu, Wen and Liu2009b). The surface deposition by plasma torch is also a simple method to introduce the heavier particle on the cathode surface. In this paper, the copper or copper oxide are introduced on the surface of carbon fiber, that is, the heavier particles are deposited by plasma torch, which can provide new prospective for developing pulsed electron beam sources.
ACKNOWLEDGEMENT
The work was supported by Hong Kong Research Grants Council (RGC) General Research Funds (GRF) nos. CityU112510 and 112212, Natural Science Foundation of China (Granted No. 51101027), and Program for New Century Excellent Talents in Heilongjiang Provincial University. The authors were grateful to Drs. Cheng Cheng and Zhengwei Wu for helpful discussions and suggestions.


