LIQUID-FILLED LASER-DRIVEN SHOCK TUBE CONCEPT
A laser-driven shock tube (LST) has been proposed by Zvorykin and Lebo (Reference Zvorykin and Lebo2000) as a novel laboratory technique to generate strong shock waves (SW) in gases and liquids by deposition of KrF laser pulse energy on a thin planar layer adjacent to the entrance of a compact gas-filled or liquid-filled cavity. This technique may be applied for studies of various fundamental hydrodynamic phenomena with time scale of several microseconds and space scale of ten millimeters: the development of hydrodynamic instabilities at contact interfaces between different liquids and gases (Cela et al., Reference Lopez Cela, Piriz, Serna Moreno and Tahir2006; Piriz et al., Reference Piriz, Lopez Cela, Serna Moreno, Tahir and Hoffmann2006a, Reference Piriz, Lopez Cela, Tahir and Hoffmann2006b), hypersonic gas flow around the bodies, effects of strong shock wave refraction and cumulation. These problems are of great importance in inertial confinement fusion (ICF), cosmology, astrophysics, and aerospace engineering (Batani et al., Reference Batani, Dezulian, Redaelli, Benocci, Stabile, Canova, Desai, Lucchini, Krousky, Masek, Pfeifer, Skala, Dudzak, Rus, Ullschmied, Malka, Faure, Koenig, Limpouch, Nazarov, Pepler, Nagai, Norimatsu and Nishimura2007; Gonzalez et al., Reference Gonzalez, Stehle, Audit, Busquet, Rus, Thais, Acef, Barroso, Bar-Shalom, Bauduin, Kozlova, Lery, Madouri, Mocek and Polan2006; Manheimer & Colombant, Reference Manheimer and Colombant2007).
The LST concept was first realized in gases. Planar SW with velocities as high as 30 km/s were initiated toward the laser beam by erosion plasma blow-off in rarefied air when 100-J, 100-ns KrF laser pulses irradiated solid targets (Zvorykin et al., Reference Zvorykin, Bakaev, Iskakov, Lebo, Sychugov and Tishkin2003, Reference Zvorykin, Bakaev, Lebo and Sychugov2004a, Reference Zvorykin, Bakaev, Batani, Lebo, Levchenko, Sychugov, Tishkin and Zayarnyi2004b, Reference Zvorykin, Krasnyuk, Lebo and Levchenko2005; Lebo et al., Reference Lebo, Iskakov, Mikhailov, Rozanov, Starodub, Sklizkov, Tishkin and Zvorykin2003, Reference Lebo, Ilyasov, Iskakov, Jitkova, Mikhailov, Rozanov, Starodub, Sklizkov, Tishkin and Zorykin2004; Bakaev et al., Reference Bakaev, Batani, Krasnyuk, Lebo, Levchenko, Sychugov, Tishkin, Zayarnyi and Zvorykin2005; Krasnyuk & Lebo, Reference Krasnyuk and Lebo2006). In a forward direction, the SW was pushed by thin polystyren (CH) films accelerated by free-expanding plasma up to velocities ~3.5 km/s independently of the gas density. When plasma expansion was confined by a transparent fused silica substrate the velocities increased by a factor 1.3–1.4. A rapid growth of the film thickness from initial few microns to few millimeters was observed during its acceleration (~100 ns) and deceleration (~1 µs) stages, and it was caused by the hydrodynamic instability and turbulent mixing at plasma-film interface. It is well known that a planar interface between two substances undergoing constant or pulsed acceleration exhibits Rayleigh-Taylor (RT) (Taylor, Reference Taylor1950) or Richtmyer-Meshkov (RM) (Richtmyer, Reference Richtmyer1960; Meshkov, Reference Meshkov1969) instabilities. It was shown that any irradiation non-uniformity enhanced instabilities development. A prism-raster focusing system provided large enough (7 × 7 mm2) square irradiation spot on a target with uniform intensity distribution to ensure initially planar SW generation. The moderate laser intensities q = 0.1–1 GW/cm2 and long pulse duration of 100 ns has distinguished our experiments from those performed at the ICF-scale huge powerful lasers with high intensities q = 1– 100 TW/cm2 and nanosecond pulses (see, i.e., Kilkenny et al., Reference Kilkenny, Glendinning, Haan, Hammel, Lindl, Munro, Remington, Weber, Knauer and Verdon1994, Reference Kilkenny, Alexander, Nikroo, Steinman, Nobile, Bernat, Cook, Letts, Takagi and Harding2005; Farley et al., Reference Farley, Peyser, Logory, Muray and Burke1999; Nobile et al., Reference Nobile, Nikroo, Cook, Cooley, Alexander, Hackenberg, Necker, Dickerson, Kilkenny, Bernat, Chen, Xu, Stephens, Huang, Haan, Forsman, Atherton, Letts, Bono and Wilson2006; Aglitskiy et al., Reference Aglitskiy, Metzler, Karasik, Serlin, Velikovich, Obenschain, Mostovich, Schmitt and Weaver2006).
A simple but rather informative method to study RT and RM instabilities was implemented in a gravity-accelerated aquarium containing two stratified liquids and bounced on a coil spring (Castilla & Redondo, Reference Castilla, Redondo, Linden, Youngs and Dalziel1993; Jacobs & Sheely, Reference Jacobs and Sheely1996). Two-liquid system has an advantage in comparison with two-gas system, as it does not need a thin membrane to separate the substances. Thus, the effect of RT and RM instabilities development at liquids interface would be pure of membrane remnants.
In this paper (see also Zvorykin et al., Reference Zvorykin, Berthe, Boustie, Levchenko and Ustinovskii2008), by an example of dibutyl-phthalate (DBP), which is an opaque liquid for KrF laser radiation at wavelength 248 nm but transparent for visible probe light, we present results on planar SW generation and dynamics aiming afterward to study SW passage through a contact surface with another immiscible liquid. A technique to introduce and to measure controllable sinusoidal perturbations at the contact interface is described. Laser strength and nonlinear absorption in some optical materials and pure deionized water, which can be used as transparent LST windows to increase generated pressure, were measured for 100-ns KrF laser pulses.
GARPUN KRF LASER FACILITY
The layout of target shooting experiments is shown in Figure 1. KrF laser GARPUN operated in injection-controlled regime with a discharge-pumped EMG 150 TMSC master oscillator and electron-beam-pumped 16 × 18 × 100-cm amplifier equipped with an unstable resonator (with magnification factor M = 6) (Basov et al., Reference Basov, Bakaev, Bogdanovskii, Vadkovskii, Grigor'yants, Zvorykin, Metreveli, Suchkov and Sychugov1993; Zvorykin et al., Reference Zvorykin, Didenko, Ionin, Kholin, Konyashchenko, Krokhin, Levchenko, Mavritskii, Mesyats, Molchanov, Rogulev, Seleznev, Sinitsyn, Tenyakov, Ustinovskii and Zayarnyi2007). It produced laser pulses of E las = 100 J energy, with pulse duration at full width at half-maximum (FWHM) τ las = 75 ns and radiation divergence 0.1 mrad at 248-nm wavelength. By increasing a distance between resonator mirrors, an output beam was made slightly convergent. It had a reduced cross section of 10 × 10 cm when arrived at two-component homogenizing system consisting of a prism rasterFootnote 1 and a lens (Zvorykin et al., Reference Zvorykin, Bakaev, Lebo and Sychugov2004a; Bakaev et al., Reference Bakaev, Batani, Krasnyuk, Lebo, Levchenko, Sychugov, Tishkin, Zayarnyi and Zvorykin2005). By splitting an incident beam into 25 individual 2 × 2-cm beamlets and overlapping them at a focal plane (raster effective focal length F eff = 1000 mm) this raster provided non-uniformity less then a few percents across the square spot, which could be resized by adding a focusing lens with an appropriate focal length. For additional F = 650 mm lens 7 × 7-mm spot was obtained. Peak laser intensities q = E las/S lasτlas (S las = 0.5 cm2) were varied in the range of q = 0.004–2 GW/cm2 by attenuating the incident laser energy.

Fig. 1. Layout of target shooting experiments at GARPUN KrF laser facility.
PLASMA AND SW REGISTRATION
Hydrodynamics of laser plasma and SW were investigated by a streak camera or high-speed photo-chronograph with slit-scanning of images by means of a rotating mirror. The schlieren and shadow techniques with a quasi-steady collimated probe beam produced by a capillary-discharge light source were combined with the high-speed slit-scanning recording of images of laser plasma in self luminescence (Fig. 1) (Danilychev & Zvorykin, Reference Danilychev and Zvorykin1984; Zvorykin & Lebo, Reference Zvorykin and Lebo1999; Zvorykin et al., 2004; Bakaev et al., Reference Bakaev, Batani, Krasnyuk, Lebo, Levchenko, Sychugov, Tishkin, Zayarnyi and Zvorykin2005).
Figure 2 demonstrates a slit-scanning image of laser interaction with condensed matter in atmospheric air. The matter was opaque for UV laser radiation, which was absorbed in a thin surface layer and, vice versa, was transparent for probe light. Laser pulse formed a plasma plume in evaporated material, which expanded into the ambient air. As a result, a strong SW was generated in the air toward incident laser radiation and a compression wave propagated from the front surface into the solid matter with approximately constant velocity close to sound velocity. A planar SW waveform configuration was observed by the moment when SW propagation length into the matter was less than the laser spot size.

Fig. 2. Combined slit-scanning records of laser plasma (dark in the negative image) and SW (light) propagating from the interface in the ambient air and into condensed matter.
PRESSURE GAUGES AND LAYOUT OF PRESSURE MEASUREMENTS
As for moderate laser intensities of interest, SW velocity weakly depends on the pressure jump at SW front, pressure amplitudes and temporal evolution were measured directly with a piezoelectric gauge. Different techniques were developed earlier to evaluate SW pressure or back-free surface velocities of thin solid targets irradiated by laser pulses. In electromagnetic velocity gauges, a back surface of metal foil was put in contact with two pins, and voltage generated in magnetic field according to Laplace's law was measured (Boustie et al., Reference Boustie, Couturier, Romain, Zagouri and Simonnet1996; Peyre et al., Reference Peyre, Berthe, Fabbro and Sollier2000). Interferometer system for any reflector (VISAR) measured Doppler shift of a continuous probe laser beam reflected by the back-free surface of loaded target (Barker & Hollenbach, Reference Barker and Hollenbach1972; Berthe et al., Reference Berthe, Fabbro, Peyre, Tollier and Bartnicki1997; Tollier et al., Reference Tollier, Fabbro and Bartnicki1998). However, the most common technique for shock pressure measurements is piezoelectric gauges. Thin polyvinylidene-fluoride (PVDF) film and its copolymer with trifluoroethylene P(VDF/TrFE) after specific treatments (stretching and subsequent application to electric field) demonstrate strong piezoelectric effect, being the most suitable material to construct different types of pressure gauges (Obara et al., Reference Obara, Bourne and Mebar1995; de Rességuier et al., Reference de Rességuier, Couturier, Boustie, David and Niérat1996; Bauer, Reference Bauer2003). The polymer piezoelectric gauges in comparison with more usual X-cut crystalline quartz (Graham, Reference Graham1975; Fabbro et al., Reference Fabbro, Fournier, Ballard, Devaux and Virmont1990; Devaux et al., Reference Devaux, Fabbro, Tollier and Bartnicki1993) have evident advantages: (1) higher sensitivities, which is important for moderate laser intensities and respectively moderate generated pressures in the presence of a strong parasitic noise; (2) linear response for higher pressure values.
The layout of pressure measurements in dibutyl-phthalate (DBP) is shown in Figure 3. DBP was chosen because it absorbs 248-nm light very strongly. Linear absorption coefficient being measured with a spectrophotometer in a thin cavity of 3.3-µm thickness was about α = 1.1 × 103 cm−1. No information is available concerning nonlinear absorption in the DBP. However, it is expected to be definitely higher at higher laser intensities. It means the penetration range of laser radiation in our experiments was much less then the spot size and the SW with initially planner front was generated at the liquid surface. Sound velocity in the DBP is c 1 = 1.408 × 10³ m/s and its density is ρ1 = 1.043 × 10³ kg/m3. Those correspond to acoustic impedance of c 1ρ1 = 1.47 × 10⁶ kg × s−1 × m−2.

Fig. 3. Layout of pressure measurements in DBP.
The copolymer pressure gauge assemble was set inside the liquid at various depths from the surface irradiated by the laser. It had 490-µm-thick sensitive element in the form of parallelepiped made of P(VDF/TrFE) with mole composition 77/23%. The outer square 10 × 10-mm electrodes and inner square 4 × 4-mm electrodes were attached to the parallelepiped faces in a guard-ring configuration. The active area of A = 0.05 cm2 (shown in Fig. 3 by a dashed line) was defined by the polarized surface in the preliminary poling process. It was slightly less than the inner electrode and thus two-dimensional effects when the SW propagated along-through the sensitive element were eliminated. A specific resin whose acoustic impedance was matched with the copolymer's one filled the transducer body to avoid SW reflection on the rear surface of the copolymer. The calibration test with flyer impacts was carried out earlier that gave for a piezoelectric constant a value K = 5.35 µC/cm2 (de Rességuier et al., Reference de Rességuier, Couturier, Boustie, David and Niérat1996). The transducer current was delivered to Tektronix TDS 2024 scope with 100-Ω twisted-pare cable loaded by two 100-Ω resistors in parallel.
The relationship for the oscilloscope response is given by de Rességuier et al. (Reference de Rességuier, Couturier, Boustie, David and Niérat1996) and Peyre et al. (Reference Peyre, Berthe, Fabbro and Sollier2000)
where V(t) is the voltage (V), R = 50 Ω is resistance, e 0 = 0.49 × 10⁻³ m is initial copolymer thickness, and Δu 2(t) is a difference of material velocities (m/s) at the front and rear surfaces of the sensitive element. Before the SW reaches the rear surface Δu 2 = u 2, material velocity at the front surface.
Pressure amplitude can be expressed from Hugoniot adiabat of copolymer material
where ρ2 = 1.767 × 10³ kg/m3 is density, c 2 = 2.579 × 10³ m/s is sound velocity in the copolymer, and S = 1.586.
As copolymer acoustic impedance c 2ρ2 = 4.56 × 10⁶ kg × s−1 × m−2 is larger than of DBP, the SW was partially reflected at DBP/copolymer interface giving rise to increased SW amplitude in the copolymer. The relationship between reflected and transmitted SW can be found using P(u) diagram and taking into account that pressures and material velocities at the interface have to comply with a condition of continuity (Zel'dovich & Raizer, Reference Zel'dovich and Raizer1966). As we did not know Hugoniot adiabat for DBP, we have used its acoustic expression P 1 = p 1c 1u 1, which is valid for moderate pressures when c 1>>Su 1 and SW velocity D 1 = c 1 + Su 1 ≈ c 1 is close to sound velocity.
In the acoustic limit, pressure amplitude in the DBP is less than measured in the copolymer by a factor
PRESSURE VS LASER INTENSITY SCALING LAW AND SW GENERATION MECHANISM IN DBP
Typical oscilloscope traces of laser pulse measured by a photodiode and pressure gauge response are shown in Figures 4 and 5 in different time scales. The gauge response behaves as two-polar periodical signal with gradually decreasing amplitude. Time delay τ of the first positive peak relative laser pulse is determined by a passage of the SW through the thickness of DBP. The rise time of pressure ~10 ns is shorter than the leading edge of incident laser pulse. 190-ns width of a positive peak is SW transit time through the copolymer thickness. Negative signal corresponds to a pressure tail when pressure at the front surface of the copolymer becomes less than its preceding values transmitted to the back surface. The second signal with a reversed polarity is delayed by 3τ, and it appears due to a partial reflection of the SW at DBP/copolymer interface where pressure polarity is conserved and another reflection at the DBP front free-surface where the SW is transformed into a release wave (RW) with an opposite tension. Afterward the same reverberation cycle is repeated with a respective change in signal polarity.

Fig. 4. (Color online) Laser pulse and copolymer gauge response for the DBP thickness of 1.2 mm.

Fig. 5. (Color online) Laser pulse and copolymer gauge response for the DBP thickness of 1.2 mm and different incident radiation energies.
A variation of pressure gauge signals with incident laser energy E las or peak intensity q is demonstrated in Figure 5. Decreasing peak pressure and increasing time delay relative the onset of laser pulse are observed for reduced laser energies. As SW velocity has a minor dependence on SW pressure being approximately equal to sound velocity in DBP, the latter can be only explained by an increasing delay in SW generation for lower laser energies. Some time is required for incident laser flux to heat the surface layer of the DBP up to boiling temperature t b = 340°C and to ignite high-pressure plasma in the vapor. This time increases with a reduction of laser energy and the threshold of plasma formation is attained when it becomes comparable with pulse duration. Being reduced to peak laser intensity, it was found to be q th ≈ 0.05 GW/cm2.
Peak pressures in the DBP measured at 1.2-mm depth under irradiated surface in dependence on peak laser intensity are shown in Figure 6, and corresponding time delays τ are in Figure 7. The similar dependences have been measured also for larger depths. Except of low laser intensities q ≤ q th the pressure can be approximated by a power law P ~ q n with an index n = 0.43 ÷ 0.46.

Fig. 6. Peak pressure in DBP measured at 1.2-mm depth versus peak laser intensity.

Fig. 7. Time delay of SW arrival relative the onset of laser pulse in DBP at 1.2-mm depth versus peak laser intensity.
Peak pressure and time delay of the SW in dependence on the DBP thickness beneath irradiated surface are presented in Figures 8 and 9. It is seen that pressure amplitude decreases slowly with the depth while time delay is approximately proportional to DBP thickness.

Fig. 8. Peak pressure versus DBP thickness measured at peak laser intensity 0.5 GW/cm2.

Fig. 9. Time delay of SW arrival relative the onset of laser pulse versus DBP thickness at peak laser intensity 0.5 GW/cm2.
Many experimental and theoretical studies established a scaling law for the ablation pressure or momentum transferred to planar targets in dependence on laser intensity and laser wavelength (see i.e., Phipps et al., Reference Phipps, Turner, Harrison, York, Osborne, Anderson, Corlis, Haynes, Steele, Spicochi and King1988; Zvorykin & Lebo, Reference Zvorykin and Lebo1999 and references cited therein). Most of them express this dependence in the form of power law P ~ q nλm with indexes varying in the range n = 0.67 ÷ 0.80 and m = −(0.2 ÷ 0.3). Thus, the present pressure dependence with n = 0.43 ÷ 0.46 contradicts to previous ones. In addition, absolute pressure p = 0.8 GPa measured at q ≈ 1 GW/cm2 is about three times higher then those estimated on the base of previous scaling laws. In our opinion, this difference might originate from the volumetric behavior of absorption of KrF laser radiation in the DBP. Volume absorption arises if the effective deposition depth l abs of incident radiation is significantly larger than the thermal diffusion length during laser-target interaction![]() . Here k = K/ρC v represents thermal diffusivity coefficient; ρ, density of target material; C v, constant-volume specific heat. For typical parameters of organic liquids and laser pulse duration τlas = 75 ns the length of thermal diffusion x th ≈ 10−5 cm is much less than the penetration range of laser radiation in DBF l abs = 1/α = 0.9 · 10−3 cm. According to Phipps et al. (Reference Phipps, Harrison, Shimada, York, Turner, Corlis, Steele, Haynes and King1990) the pressure and momentum transfer increase in several times for volume-absorbing substances. In some respect, such regime is close to plasma-confined interaction (see below). A circumstantial evidence for such assumption is the pressure dependence on laser intensity in present experiments, which is close to that for a confined regime described by a power law with an exponent n = 0.5 (Anderholm, Reference Anderholm1970; Fabbro et al., Reference Fabbro, Fournier, Ballard, Devaux and Virmont1990).
. Here k = K/ρC v represents thermal diffusivity coefficient; ρ, density of target material; C v, constant-volume specific heat. For typical parameters of organic liquids and laser pulse duration τlas = 75 ns the length of thermal diffusion x th ≈ 10−5 cm is much less than the penetration range of laser radiation in DBF l abs = 1/α = 0.9 · 10−3 cm. According to Phipps et al. (Reference Phipps, Harrison, Shimada, York, Turner, Corlis, Steele, Haynes and King1990) the pressure and momentum transfer increase in several times for volume-absorbing substances. In some respect, such regime is close to plasma-confined interaction (see below). A circumstantial evidence for such assumption is the pressure dependence on laser intensity in present experiments, which is close to that for a confined regime described by a power law with an exponent n = 0.5 (Anderholm, Reference Anderholm1970; Fabbro et al., Reference Fabbro, Fournier, Ballard, Devaux and Virmont1990).
OPTICAL PROPERTIES OF LASER-DRIVEN SHOCK TUBE WINDOWS
The pressure amplitude produced by plasma blow-off might be increased by an order of magnitude if plasma expansion is confined by some transparent solid or liquid material adjacent to evaporated surface. First demonstrated by Anderholm (Reference Anderholm1970), the effect of water for plasma-confined regime has been further studied with a variety of laser wavelengths (1.064, 0.532, 0.355, and 0.308 µm) and pulse durations (150, 50, 25, 3, 0.6 ns) (Fabbro et al., Reference Fabbro, Fournier, Ballard, Devaux and Virmont1990; Devaux et al., Reference Devaux, Fabbro, Tollier and Bartnicki1993; Boustie et al., Reference Boustie, Couturier, Romain, Zagouri and Simonnet1996; Tollier et al., Reference Tollier, Fabbro and Bartnicki1998; Berthe et al., Reference Berthe, Fabbro, Peyre and Bartnicki1999, Reference Berthe, Sollier, Peyre, Fabbro and Bartnicki2000; Peyre et al., Reference Peyre, Berthe, Fabbro and Sollier2000). Breakdown at the front surface of water put a restriction on available laser intensities and highest pressures attained. Unlike the detrimental effect of short laser wavelengths on water breakdown, the confined laser interaction was shown to be more efficient in UV than IR laser irradiation (Berthe et al., Reference Berthe, Fabbro, Peyre and Bartnicki1999).
Linear absorption in pure water for KrF laser radiation is negligible and it can be used as a transparent “window” overlaying the highly absorbing liquid in LST. But nonlinear absorption, being determined for the first time at λ = 248 nm wavelength for long 100-ns laser pulses in this study, appeared to be rather high and should be taken in consideration. Nonlinear absorption was found in transmission measurements of laser radiation through a cavity of 2-cm length filled with purified deionized water and covered with quartz glass windows. A specific resistance of water being a measure of its purity was ~1 MΩ × cm. Laser beam was focused by the prism raster combined with F = 2400 mm lens, which produced uniform irradiation in a square spot of 14 × 14 mm, twice as much as in DBP shooting experiments. As an effective focal length of the focusing system was 690 mm, much bigger than the cavity length, the spot size was kept constant along the cavity. Incident E 0 and transmitted E 1 laser energies and pulse forms were measured by photodiodes and calorimeters and then they were used to calculate transmittance T = E 1/E 0 at corresponding peak laser intensity q.
Figure 10 represents inverse transmittance 1/T = E 0/E 1 of water-filled cavity in dependence on laser intensity q. Fresnel reflection of the windows is omitted from this graph. It is seen that experimental dots are well approximated by linear dependence 1/T = 1 + βlq, which is typical for two-photon absorption. It is the main absorption process, as the two photons energy 2h ν = 10 eV is well above water ionization potential or dissociation energy ≈ 6.5 eV (Reuther et al., Reference Reuther, Laubereau and Nikogosyan1996). But the found nonlinear absorption coefficient β =3.9 cm/GW is at least eight times higher than that measured before in the water for UV laser light at λ = 266 nm and short pulses of picosecond or femtosecond duration (Nikogosyan & Angelov, Reference Nikogosyan and Angelov1981; Dragomir et al., Reference Dragomir, McInerney, Nikogosyan and Ruth2002). The apparent reason is intermediate products formed in primary two-photon ionization and dissociation of water, i.e., H, OH, e−aq, H2O2, H3O+, etc., which have long enough lifetime and can additionally absorb KrF laser radiation in a linear process (Reuther et al., Reference Reuther, Laubereau and Nikogosyan1996).

Fig. 10. Inverse transmittance of water-filled cavity in dependence on laser intensity: experimental dots and linear approximation.
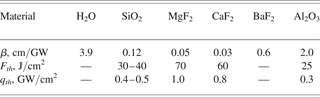
Nonlinear absorption in water is compared in Table 1 with effective β values for various optical materials suitable for LST window: quartz glass (SiO2), magnesium fluoride (MgF2), calcium fluoride (CaF2), barium fluoride (BaF2), and synthetic leucosapphire (Al2O3) (Eliseev et al., Reference Eliseev, Fadeeva, Zvorykin, Morozov, Sagitov and Sergeev1996). As β = 0.12 cm/GW for glass is significantly lower than for water, nonlinear absorption in the cavity windows did not affect on the measured cavity transmittance. Note that the present effective β values for ~100-ns KrF laser pulses are again by an order of magnitude higher than measured earlier at λ = 248 nm for picosecond and femtosecond laser pulses. Indeed, only SiO2 band-gap energy of 7.8 eV allows two-photon absorption of KrF quanta while in CaF2 band-gap energy (10 eV) is just equal to 2h ν. Band-gap energies in MgF2 (11.6 eV) and LiF (11.8 eV) are too wide for direct two-photon absorption. Three-photon absorption was found to be a primary process in these materials, followed by linear absorption at color centers appeared in repetitive irradiations (see i.e., Simon & Gerhardt, Reference Simon, Gerhardt and Szatmari1989; Tomie et al., Reference Tomie, Okuda and Yano1989; Hata et al., Reference Hata, Watanabe and Watanabe1990). In our case, a quasi-continuous color centers formation during long-pulse KrF samples irradiation apparently increases resulting nonlinear absorption.
Table 1. Nonlinear absorption coefficient and laser strength of optical materials transparent for KrF laser radiation

Breakdown thresholds F th, [J/cm2] and q th [GW/cm2] were also determined for optical materials in large-spot (S las = 0.5 cm2) experiments (Zvorykin et al., Reference Zvorykin, Bakaev, Gaynutdinov, Levchenko, Sagitov, Sergeev, Stavrovskii and Ustinovskii2006), and their values characterize the upper limit of laser intensity attainable in plasma-confined regime with these materials.
STANDING ACOUSTIC WAVES AT LIQUIDS INTERFACE
Figure 11 demonstrates a layout of test bench experiments where sinusoidal standing acoustic waves were produced at the interface between two immiscible liquids by a pair of microphones. They were fed by an audio-frequency oscillator with tunable frequency range 1 Hz–1 kHz. A reflection (or transmission) of expanded probe He-Ne laser beam was used to visualize a pattern of these initial perturbations to be further affected by a compression wave propagating from the upper liquid. Standing wave acts like an array of cylindrical mirrors or lenses focusing the light reflected or refracted by liquids interface.

Fig. 11. (Color online) Layout of test-bench experiments with excitation of sinusoidal standing acoustic waves.
Figure 12 illustrates how a planar probe beam is focused by a sinusoidal surface. The distance where reflected rays intercept with an axis drawn through the sinusoidal maxima is given by the formula

Fig. 12. (Color online) Focusing of planar probe beam by sinusoidal interface.
It is seen that most of incident rays would be collected at the distance ![]()
On the screen set in this point distinct strings were observed. By measuring the position of effective focus and interval between the strings, which is equal to excited wavelength, one could find both a wavelength λ (wave number k) and an amplitude a of sinusoidal perturbations. Their values as low as a*k ~ 10−4 in product can be easily detected.
Three layers of immiscible liquids with slightly different densities were composed with the upper layer of transparent distillated water (with density ρ = 1.0 g/cm3) for plasma confinement, an opaque mixture of kerosene and chloroform (ρ = 1.0 ÷ 1.2 g/cm3) for absorbing laser radiation, and a solution of NaCl in the water (ρ ≥ 1.2 g/cm3) where hydrodynamic instabilities would be developed.
CONCLUSIONS
Experiments were performed with 100-J, 100-ns KrF laser facility GARPUN to generate planar shock waves in some opaque liquids. Pressure amplitudes up to 0.8 GPa were achieved in dibutyl-phthalate at moderate laser intensities about 1 GW/cm2 with low damping along the shock wave propagation depth. The scaling law P ~ q n (n = 0.43 ÷ 0.46) and three-times higher pressure values compared with laser-solid-target interaction are explained by volumetric character of laser radiation absorption. Nonlinear absorption coefficients and laser breakdown thresholds were measured for pure water and optical materials transparent for UV laser radiation. Test bench experiments were performed to produce standing acoustic waves as initial perturbations at the interface between two immiscible liquids. Thus, the necessary experimental data were acquired to suggest a new experimental technique—liquid-filled laser-driven shock tube, which is intended for modeling of RT and RM hydrodynamic instabilities development.
ACKNOWLEDGEMENTS
The authors are grateful to Prof. D. Batani from the University of Milano Bicocca, Italy for his coordination of this research under the INTAS Project 01-0846. Prof. I.G. Lebo from Technical University MIREA promoted our work by useful discussions, and Dr. P.B. Sergeev from P.N. Lebedev Physical Institute provided us with the data on nonlinear absorption in optical materials.