


1. INTRODUCTION
Dense plasma focus devices (DPFD) produce pulsed plasma in a gas at few millibar of pressure, by applying a high-pulsed voltage between two coaxial cylindrical electrodes separated by an insulator. The anode is the central electrode and cathode bars symmetrically surround the anode. The discharge starts over the insulator surface, then the plasma current sheet (PCS) comes off and it is accelerated axially by the magnetic field that is self-generated by the current. At the open end of the anode, the PCS produces a plasma column (pinch) by compressing neutral gas in a small region (Fig. 1). Various physical phenomena take place during the pinch phase and cause the emission of pulsed X rays (Zambra et al., Reference Zambra, Silva, Pavez, Pasten, Moreno and Soto2009; Barbaglia et al., Reference Barbaglia, Bruzzone, Acuña, Soto and Clausse2009; Barbaglia et al., Reference Barbaglia, Soto and Clausse2012; Pavez et al., Reference Pavez, Pedreros, Zambra, Veloso, Moreno, Tarifeño-Saldivia and Soto2012; Neog et al., Reference Neog, Mohanty and Borthakur2008), charged particles (Jakubowski et al., Reference Jakubowski, Sadowski and Zebrowski2001; Bhuyan et al., Reference Bhuyan, Chuaqui, Favre, Mitchell and Wyndham2005; Mohanty et al., Reference Mohanty, Bhuyan, Neog, Rout and Hotta2005; Neog & Mohanty, Reference Neog and Mohanty2007; Jain et al., Reference Jain, Moreno, Avaria, Pavez, Bora, Inestrosa-Izurieta, Diez, Alvarez, Tapia, Marcelain, Armisen and Soto2016), and neutrons (Silva et al., Reference Silva, Moreno, Soto, Birstein, Mayer and Kies2003; Soto et al., Reference Soto, Silva, Moreno, Zambra, Kies, Mayer, Clausse, Altamirano, Pavez and Huerta2008; Verma et al., Reference Verma, Rawat, Lee, Krishnan, Springham and Tan2009; Ellsworth et al., Reference Ellsworth, Falabella, Tang, Schmidt, Guethlein, Hawkins and Rusnak2014) if working gas is deuterium. After pinch an axial shock (Soto et al., Reference Soto, Pavez, Moreno, Inestrosa, Veloso, Gutierrez, Vergara, Castillo, Clausse, Bruzzone and Delgado-Aparicio2014) and plasma jets (Pavez et al., Reference Pavez, Pedreros, Tarifeno-Saldivia and Soto2015) are produced. These later phases have been recently characterized and found applications in the plasma wall interaction in fusion reactor (Soto et al., Reference Soto, Pavez, Moreno, Inestrosa, Veloso, Gutierrez, Vergara, Castillo, Clausse, Bruzzone and Delgado-Aparicio2014; Inestrosa-Izurieta et al., Reference Inestrosa-Izurieta, Ramos-Moore and Soto2015) and possible application related to astrophysical jet phenomena (Pavez et al., Reference Pavez, Pedreros, Tarifeno-Saldivia and Soto2015).

Fig. 1. Scheme of a plasma focus and its plasma dynamics. Cathode radius: r cat, anode radius: r a, effective anode length: L eff, insulator length: L ins. Capacitance of the capacitor bank: C 0, charging voltage: V 0, total resistance: R 0, total inductance: L 0. Dynamics, I: breakdown, II: rundown, III: compression, IV: pinch, V: axial plasma shock after pinch disruption.
The origin of neutrons from DPFD is mainly explained based on beam-target fusion mechanism (Yamamoto et al., Reference Yamamoto, Shimoda, Yashi and Hirano1984; Jager & Herold, Reference Jager and Herold1987; Kelly & Marquez, Reference Kelly and Marquez1995; Castillo et al., Reference Castillo, Herrera, Rangel, Alfaro, Maza and Sakaguchi2002; Verma et al., Reference Verma, Rawat, Lee, Krishnan, Springham and Tan2009). The pinch formation mechanism produces various physical phenomena, which induce electromagnetic (EM) fields. Charged particles accelerate in the influence of the induced fields. Electrons move toward the anode, and produce hard X rays (HXRs) via bremsstrahlung, upon impinging the anode. On the other hand, ions move away from the anode. If the discharges are produced with deuterium gas, deuterons, which accelerate away from the anode, collide with the background plasma and produce neutrons via D–D beam-target fusion mechanism. Beam-target fusion mechanism is widely accepted in order to explain neutron production in DPFD, mainly along the axis. A fraction of neutrons of thermonuclear origin is also reported (Moo et al., Reference Moo, Chakrabarty and Lee1991; Soto, Reference Soto2005).
Beam-target model explains neutron emission phenomena if neutrons originate during the pinch phase or at later time. In the case of neutrons origin, prior to the pinch phase, it is possible that neutron production is not necessarily governed by the beam-target fusion mechanism, prior to the pinch phase. Nonetheless, in order to estimate neutron origin time, one must consider all the possible temporal events, as will be described in the following paragraph.
Time appearance of HXR and neutron signals in oscilloscope can be written as the sum of the following times; origin time of the signals (HXR/neutron), time taken by the signals to reach the photomultiplier tubes (PMTs), PMT processing time (electron transit time), and time taken at the cables which are connecting the PMT to the oscilloscope. The speed of neutrons, which were estimated by time of flight (TOF) method as used by Moreno et al., (Reference Moreno, Veloso, Pavez, Tarfeno-Saldivia, Klir and Soto2015), was applied to estimate the time taken by neutrons to reach the PMT.
TOF requires an array of PMTs, separated by a certain distance. The speed of neutrons can be estimated by dividing the distance between two PMTs by time difference of the start of the neutron signal in each PMT. The assumption here is that neutrons seen by two PMTs, in the same discharge, would have been originated at the same time and have the same speed, and we are considering the neutrons that arrive first to the PMTs. In the present study, with the consideration of all the times, neutron origin time with respect to HXR origin time is estimated.
In Section 2, the experimental setup is presented. Scheme for THA is presented in Section 3. The results are discussed in Section 4 and the work is concluded in Section 5.
2. EXPERIMENTAL SETUP
In Figure 1, a schematic of PF-400J (880 nF, 38 nH, 20–30 kV, 176–539 J, ~300 ns time to reach peak current) (Silva et al., Reference Silva, Moreno, Soto, Birstein, Mayer and Kies2003; Soto et al., Reference Soto, Pavez, Moreno, Inestrosa, Veloso, Gutierrez, Vergara, Castillo, Clausse, Bruzzone and Delgado-Aparicio2014; Veloso et al., Reference Veloso, Soto, Pavez and Moreno2014; Tarifeno-Saldivia et al., Reference Tarifeno-Saldivia, Pavez and Soto2014; Moreno et al., Reference Moreno, Veloso, Pavez, Tarfeno-Saldivia, Klir and Soto2015; Jain et al., Reference Jain, Moreno, Avaria, Pavez, Bora, Inestrosa-Izurieta, Diez, Alvarez, Tapia, Marcelain, Armisen and Soto2016) along with various plasma phases is shown. The hollow anode was made of stainless steel, with a diameter of 12 mm, partially covered by an alumina insulator over which the PCS is initially formed. The effective length was ~7 mm. A coaxial arrangement of eight equally spaced stainless steel rods surrounds the anode, which together with the baseplate constitute the grounded cathode.
Schematic of the experimental arrangement to detect HXR and neutron signals is presented in Figure 2. Four PMTs (combined with scintillators, BC-408), Hamamatsu model R1828-01, were used in order to record HXR and neutron signals in the axial and radial directions, simultaneously. The PMTs, which were in the axial direction, were labeled FM25 and FM27 and in the radial direction FM28 and FM29. Distance between FM25 and FM27, (likewise between FM28 and FM29) was selected at 20 cm, arbitrarily. Deuterium gas at 8 mbar pressure was used to create the discharges. In the present study, a total of five signals, namely dI/dt and two PMTs in each direction (axial and radial), have been recorded per discharge with two oscilloscopes (TDS3014B, 600 MHz, 5 GS/s and TDS5104B, 1 GHz, 1.25 GS/s). The dI/dt signal was divided in both oscilloscopes and used as a source trigger. Since this study is strongly dependent on time precision measurements, it is important to check if both oscilloscopes show various phases of the PF-400J in the dI/dt signals at the same time.

Fig. 2. Experimental arrangement to measure neutron and HXR signals, and to estimate the neutron speed. The distance between the top of the anode and the PMTs should be adequate, so that the HXR signals do not overlap with the neutron signals.
In Figure 3, dI/dt signals saved in two oscilloscopes are shown. Both of the signals overlap each other. Various phases (breakdown, rundown, compression, and pinch) are visible. The start of the compression is considered at the point where dI/dt curve changes its slope due to the presence of the compression at the top of the anode. In the absence of the compression, the curve will not show a dip and will continue smoothly. To make it clearly visible, a black dotted line is drawn, as shown in Figure 3. With this observation, it can be assumed safely that the events captured in both oscilloscopes have no time delay due to source trigger.

Fig. 3. dI/dt signals recorded using two oscilloscopes after splitting, which were used to trigger the oscilloscopes. Overlapping of the dI/dt signals suggest that the events captured by two oscilloscopes will not be affected by the triggering and splitting processes. The breakdown, rundown, and compression phases are indicated.
In Figure 4, HXR and neutron signals captured by the PMTs in the axial and radial directions are shown. The first fall at the signal corresponds to HXR and the later to neutrons. It is worth to mention here that hydrogen discharges do not show the second fall at the signals in contrast to deuterium discharges. Thus, in deuterium discharges, the second fall at the signals in the PMTs corresponds to neutrons. However, the late appearance of neutron signals cannot be interpreted as neutrons would have been originated after HXR. In order to find out the origin time of neutrons with respect to HXR, various transit times have to be considered. As HXR are much faster than neutrons, there is a possibility that HXR could be produced later but due to their speed still reach PMT first and hence appear first in oscilloscope. Keeping in mind various transit times between origin of HXR/neutron signals and oscilloscope, a time history analysis (THA) methodology is applied. In the following, this analysis is presented in detail.

Fig. 4. The HXR and neutron signals recorded by the PMTs in the axial and radial directions. Distance between the PMTs FM27 and FM25, like FM28 and FM29, was 20 cm, according to Figure 1. The first signal corresponds to the HXR and later signal is the neutron pulse. A clear separation between the HXR and neutron pulses can be seen. The time is measured from the beginning of the discharge according to Figure 3. The “y”-axis is in arbitrary units.
3. TIME HISTORY ANALYSIS
Time of appearance of HXR and neutron signals in the oscilloscope can be written as
 $$t_{xry,{\rm Osc}} = t_{xry,O} + t_{xry,D} + t_{xry,d} + t_{xry,{\rm cables}}$$
where t xry,osc: time of appearance of HXR signals in oscilloscope; t xry,O : time of origin of HXR; t xry,D : TOF of HXR from the source to the PMTs; t xry,D : electron transit time of the PMTs; t xry,cables: transit times in the cables to transfer HXR signals to oscilloscope.
For neutrons
 $$t_{n,{\rm Osc}} = t_{n,O} + t_{n,D} + t_{n,d} + t_{n,{\rm cables}}$$
where t n,Osc: time of appearance of neutron signals in oscilloscope; t n,O : time of origin of neutrons; t n,D : TOF of neutrons from the source to the PMTs; t n,d : electron transit time of the PMTs; t n,cables: transit times in the cables to transfer neutron signals to oscilloscope.
Figure 5 shows all these processes which are mentioned in Eqs (1) and (2).

Fig. 5. Scheme for time history analysis of electrical signals.
The origin time of neutrons (t n,O ) relative to HXR (t xry,O ) can be written as:
 $$\eqalign{& t_{n,{\rm osc}} - t_{xry,{\rm Osc}} = (t_{n,O} - t_{xry,O}) + (t_{n,D} - t_{xry,D}) \cr & + (t_{n,d} - t_{xry,d}) + (t_{n,{\rm cables}} - t_{xry,{\rm cables}})} $$
That gives
 $$\eqalign{& t_{n,o} - t_{xry,o} = (t_{n,{\rm Osc}} - t_{xry,{\rm Osc}}) - (t_{n,D} - t_{xry,D}) \cr & - (t_{n,{\rm cables}} - t_{xry,{\rm cables}})}$$
For a given PMT, the processing time will be same for both the HXR and neutron signals. In this case
 $t_{n,d} - t_{xry,d}\sim 0$
. TOF of HXR from the source to the PMTs, t
xry,D
, is calculated by dividing the distance between the anode and PMT by speed of light. Note that here it is assumed that HXR source dimensions are much smaller than the distance traveled by HXR to reach the PMTs. Due to this, the source size should not affect the final outcomes significantly. In order to estimate TOF of neutrons, t
n,D
, at first neutron speed was estimated using TOF method in both directions. The following procedure was used to estimate the speed of neutrons. Neutron signal in two PMTs, separated by 20 cm in each direction can be designated as “1” and “2”. The equations for neutron signals “1” and “2” can be written as;
$t_{n,d} - t_{xry,d}\sim 0$
. TOF of HXR from the source to the PMTs, t
xry,D
, is calculated by dividing the distance between the anode and PMT by speed of light. Note that here it is assumed that HXR source dimensions are much smaller than the distance traveled by HXR to reach the PMTs. Due to this, the source size should not affect the final outcomes significantly. In order to estimate TOF of neutrons, t
n,D
, at first neutron speed was estimated using TOF method in both directions. The following procedure was used to estimate the speed of neutrons. Neutron signal in two PMTs, separated by 20 cm in each direction can be designated as “1” and “2”. The equations for neutron signals “1” and “2” can be written as;
 $$t_{n1,{\rm Osc}} = t_{n,O} + t_{n1,D} + t_{n,d} + t_{n1,{\rm cables}}$$
 $$t_{n2,{\rm Osc}} = t_{n,O} + t_{n2,D} + t_{n,d} + t_{n2,{\rm cables}}$$
The time difference will be
 $${\rm \Delta} t_{n,{\rm Osc}} = t_{n2,{\rm Osc}} - t_{n1,{\rm Osc}} = t_{n2,D} - t_{n1,D} + t_{n2,{\rm cables}} - t_{n1,{\rm cables}}$$
 $$v = \displaystyle{{20 \times {10}^{ - 2}} \over {{\rm t}_{n2,D} - t_{n1,D}}}({\rm m}/{\rm s})$$
4. RESULTS AND DISCUSSION
Figures 6 shows the origin time of neutrons (t n,O ) with respect to the origin time of HXR (t xry,O ) in the axial and radial directions. It can be seen that there are discharges during which neutrons have been originated before HXR. In the axial direction, t n,O −t xry,O varies between 0 and −40 ns (−15.1±11.6 ns), for the discharges in which neutrons are produced prior to HXR. In the radial direction, such variation is between 0 and −20 ns (−8.41 ± 5.7 ns). On the other hand, neutrons that are originated after HXR have time difference 0–20 ns (7.48 ± 6.61 ns) in the axial direction and 0–30 ns (14.31 ± 8.27) in the radial direction.

Fig. 6. Time of origin of neutrons with respect to the origin time of HXR in the axial and radial directions. In the axial direction, most of the discharges show that neutron production takes place before HXR. On the other hand, in the radial direction most of the discharges show that neutron production take place after HXR.
The pinch lifetime can be deduced approximately using scaling laws (Lee & Serban, Reference Lee and Serban1996), t P[ns] ≈ 2 × anode radius [mm]. In the case of PF-400J, the anode radius is 6 mm, so the pinch lifetime is12 ns. The assumption that HXR origin time coincide with the pinch suggests that some of the neutrons would have been originated before both HXR and pinch. Note that such coincidence has been reported by Dulatov et al., (Reference Dulatov, Lemeshko, Mikhailov, Prokuratov and Selifanov2014). Discharges with neutrons that were originated before pinch (i.e. before t n,O –txry,O = 0 in Fig. 6) are presented in Figure 6 in the axial and radial directions. For instance, 24 discharges in which neutron appears before pinch (assuming pinch span 0–10 ns on x-axis in Fig. 6), four discharges in which neutron appears after pinch, and eight discharges in which neutron appears within pinch in the axial direction. Similarly, in the radial direction 13 discharges in which neutron appears before pinch, 19 discharges in which neutron appears after pinch, and 10 discharges in which neutron appears within pinch. The negative values of t n,O −t xry,O were found more often in the axial direction than in the radial direction. Here it is interesting to note that if electrons and ions form beams under the effect of induced EM fields during the pinch phase, it seems that the runaway electrons should be faster than the ions, due to their lower mass. In this case, HXR origin time should appear first. Nonetheless, there is a possibility that high magnetic fields trap electrons at the surface of the pinch. Due to this trapping, only the electrons that have the higher kinetic energies than the magneto static potential energy may run away and form beams. However, at this moment, it is hard to precisely describe these processes. A thorough estimation (modeling) for these phenomena is required.
Observations that neutron originated ~40 ns before HXR in the axial and ~20 ns in the radial direction (utmost) may reveal that deuterium ions not only gain energy after the formation of the pinch, but also gain energy before the pinch formation (assuming HXR origin time coincide with the pinch). A possible mechanism by which deuterium ions gain energy during the compression phase can be explained qualitatively as follows. Let us consider a typical PCS dynamics during the compression phase. In this phase, the PCS compresses neutral gas rapidly at the top of the anode. During the compression, there is generation of radial shock waves, which ionize the deuterium gas. The ions reflect forth and back by the compressing PCS. Due to this forth and back reflection, the ions will start to gain energy from the compressing PCS and/or shocks. As much as the radius of the compression decreases, the ions gain more energy. This kind of acceleration of the ions by the action of shrinking wall is known as Fermi acceleration (Deutch & Kies, Reference Deutch and Kies1988). Figure 7 depicts Fermi acceleration mechanism during the compression phase. At this moment, it is not clear if Fermi acceleration is the only possible mechanism that regulates neutron production before the pinch formation. Please note that, here, Fermi acceleration mechanism is used as a qualitative argument. In the future, it will be interesting to solve Fermi acceleration equations in combination with the induced EM fields. These estimations will be useful in order to see the dominance of a particular mechanism during the compression and pinch phases.

Fig. 7. Schematic representation of the plasma current sheet (PCS) dynamics and Fermi acceleration by the shrinking PCS at the top of the anode. The multiple reflections of the deuterium ions by the PCS may accelerate the ions to higher energies.
Another observation is that neutrons origin time span 0–30 ns in the radial direction and 0–20 ns in the axial direction, after HXR (Fig. 6). As mentioned earlier, the pinch time in PF-400J is 12 ns. What could be the possible mechanisms that generate the fusion reactions 10 or 20 ns after the formation of the pinch? The dynamics of the pinch phase generates EM fields Sadeghi et al., Reference Sadeghi, Habibi and Ghasemi2017. The neutrons that are originated in the time difference of 0–10 ns (emitted after HXR) might have appeared, because of deuteron acceleration in the influence of the EM fields that are generated in the pinch phase along with Fermi acceleration. The later neutrons (10–30 ns in the radial direction and 10–20 ns in the axial directions) might be originated, due to the presence of the EM fields during the expansion of the pinch phase. During the expansion, the current redistribution will take place that will cause instantaneous EM fields generation. These EM fields may play an important role to accelerate the deuterons further during the pinch decay.
In order to explore the results further, the variation in neutrons kinetic energy with t n,O −t xry,O in the axial and radial directions is shown in Figure 8. An interesting observation is that neutron energies increase from the compression to the post-pinch phases. It seems that the longer the time of acceleration of deuterons, the higher the energies of neutrons. Figure 8 suggests that deuterons start to gain energy during the compression. Again, it seems, before the pinch, this observation can be explained by Fermi acceleration. During the pinch, the main source of energy gain might be the induced EM fields along with Fermi acceleration. It can be imagined that during the compression not all the deuterons that are accelerated by Fermi acceleration participate in the fusion processes. During the pinch phase, these deuterons further accelerate by the induced EM fields inside the pinch. Similarly, not all the deuterons that are gaining energy in the pinch phase take part in the fusion processes. The remaining deuterons may accelerate further at the moment of the decay of the pinch. The higher neutron energies after the decay of the pinch might be, because the deuterons are already energized during the compression and pinch phases. During the decay, deuterons gain even more energy and produce neutrons with the higher energies. However, the dependence of neutron energies on the collision angle and the deuteron energies has to be thoroughly studied. The present study is limited to the experimental observations that are obtained using THA. The interpretation of the THA reveals that in the axial direction, neutrons originate mostly before HXR. On the other hand, in the radial direction, neutron's origin time is mostly after HXR. In addition, it was found that neutron energies are lower that are produced before HXR and higher that are produced after HXR. This trend is observed in both the directions, the radial as well as the axial. In the axial direction, the neutron energies increase faster from the compression to the post-pinch phases.
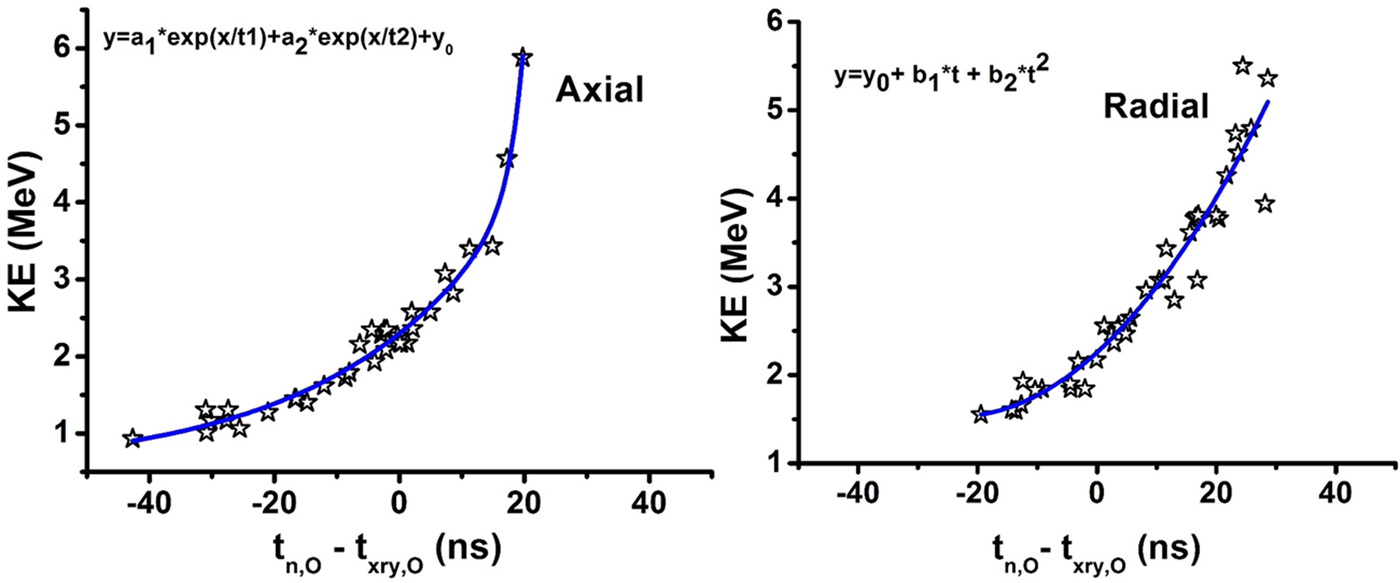
Fig. 8. Variation in the neutron energies with t n,O −t xry,O in the axial and radial directions. The energy increases from the compression to post-pinch phases in both directions. In the axial direction, the neutron energies increase faster after 10 ns. At the time t n,O −t xry,O = 0 the neutron energies are ~2.45 MeV.
On the other hand, in the radial direction, this increment is relatively slower. In fact, after 10 ns, the increment in energies changes much faster, in the axial direction compared to the radial direction. In addition, it was observed that the neutron energies corresponding to t n,O = t xry,O (when the occurrence of neutron and HXR origin coincide) for both the axial and radial directions coincident at ~2.45 MeV
5. CONCLUSION
DPFD PF-400J was operated at 8 mbar with deuterium gas to study the temporal correlation between HXR and neutron emission. HXR and neutron emission was detected using PMTs combined with the scintillators. A THA was applied to correlate the origin time between neutrons (reaching first to the detector) and HXR. It was found that neutrons are originated prior to HXR in most of the discharges in the axial direction. On the other hand, in the radial direction, neutrons are originated after HXR in most of the discharges. From the assumption that HXR origin time coincides with pinch, it follows that neutrons (that were originated before HXR) would have been originated prior to the pinch. It was speculated that deuterons gain energy not only during the pinch phase but also during the compression phase. It was found that neutron energies increase from the compression to post-pinch phases in both the axial and radial directions. Here, it is worth to mention that in the present work, we are only presenting the observation based on THA together with preliminary interpretations of these observations. Most certainly, further experimental and computational efforts are needed in order to explain the observed behavior qualitatively and quantitatively.
ACKNOWLEDGMENT
Authors thank the useful discussions with C. Pavez at the Chilean Nuclear Energy Commission. This work was supported by grant ACT-1115, CONICYT, Chile.


