Introduction
Gas discharges sustained by nanosecond-pulse generators with fast rise time and high-voltage amplitude transform into a form of diffuse discharge at atmospheric pressure (Shao et al., Reference Shao, Zhang, Niu, Yan, Tarasenko, Baksht, Burahenko and Shut'ko2011; Li et al., Reference Li, Liu, Ge, Bin, Huang and Lin2013; Mesyats Reference Mesyats2017). They have attracted much attention in laboratory research and applications (Gu et al., Reference Gu, Zhang, Wang, Yan and Shao2016; Chang et al., Reference Chang, Verboncoeur, Wei, Xie, Sun, Liu, Liu and Wu2017). The generation of diffuse discharges is accompanied by the generation of runaway electrons and X rays, especially under overvoltage of 3–5 times (Dasilva et al., Reference Dasilva, Millan, Mcgaw, Yu, Putter, Labelle and Dwyer2017; Tarasenko et al., Reference Tarasenko, Zhang, Kozyrev, Sorokin, Hou, Semeniuk, Burachenko, Yan, Kozhevnikov, Baksht and Lomaev2017). In essence, such high overvoltage provides sufficient high-reduced electric field for accelerating the electrons (Li et al., Reference Li, Xiong, Cheng, Peng and Pan2017). For electrons with energy above about 100 eV, the higher speed has the lower effective retarding force (Zhang et al., Reference Zhang, Shao, Yu, Niu, Yan and Zhou2010; Shao et al., Reference Shao, Tarasenko, Zhang, Burachenko, Rybka, Kostyrya, Lomaev, Baksht and Yan2013; Babaeva et al., Reference Babaeva, Zhang, Qiu, Hou, Tarasenko and Shao2017). A fraction of electrons will turn into a mode of continuous acceleration. The electrons with enough high energy are accelerated by an electric field to a higher energy level, with less and less effective retarding force as it accelerates. These electrons are defined as runaway electrons. They are able to explain the avalanche propagation and streamer formation in nanosecond-pulse discharges. For a long time, the behavior of runaway electrons is the main research task in the field of nanosecond-pulse discharges (Starikovskaia et al., Reference Starikovskaia, Anikin, Pancheshnyi, Zatsepin and Starikovskii2001; Levko et al., Reference Levko, Krasik and Tarasenko2012a; Marode et al., Reference Marode, Dessante and Tardiveau2016).
Runaway electron beam (REB) current is a key parameter for investigating behavior of the runaway electrons. Many scientific groups have devoted to the measurement of the REB since 1974. Tarasova et al. (Reference Tarasova, Khudyakova, Loiko and Tsukerman1974) firstly measured the REB behind an anode foil from a gas diode at atmospheric pressure, and the number of runaway electrons penetrating an 8-μm aluminum (Al) foil was ~109. However, the waveform of the REB current was not obtained. After that, the time resolution of the experimental equipment limits the investigation on the directly measurement of REB current, which has not been promoted until 2000s. Since 2000s, Tarasenko et al. (Reference Tarasenko, Baksht, Burachenko, Kostyrya, Lomaev and Rybka2008) designed collectors to measure the REB current in nanosecond-pulse discharge. The REB current reached ~50 A in atmospheric air, and the number of runaway electrons was 2.7 × 10¹⁰ after a 10-μm Al foil. The full width at half maximum (FWHM) of the REB current was approximately 0.1 ns. Babich and Loiko (Reference Babich and Loiko2010) investigated the REB in atmospheric air when the applied voltage was about 250–270 kV. The REB current had an amplitude of 0.08–0.1 A, a rise time of 0.5 ns, and a FWHM of 0.8 ns. Mesyats et al. (Reference Mesyats, Yalandin, Sharypov, Shpak and Shunailov2008) used collectors with three configurations to investigate the REB in nanosecond-pulse discharges in a 19 mm gap at atmospheric pressure. The rise time of the measured REB current was approximately 100 ps, and the corresponding FWHM ranged from 0.5 to 5 ns. In our previous work, a home-made collector was used to measure the REB current in air and SF6, whose typical waveforms showed that the rise time of the REB current was ~0.5 ns, and its FWHM was ~1 ns (Zhang et al., Reference Zhang, Tarasenko, Shao, Beloplotov, Lomaev, Sorokin and Yan2014). As seen from the above experimental research, after oscilloscopes and collectors with required time resolution became available in 2005, it is able to investigate the mechanism of the nanosecond-pulse discharges based on runaway electrons. Until now, the time resolution of the REB current has reached 100 ps or better (Tarasenko et al., Reference Tarasenko, Shunailov, Shpak and Kostyrya2005, Reference Tarasenko, Lomaev, Beloplotov and Sorokin2016; Mesyats et al., Reference Mesyats, Reutova, Sharypov, Shpak, Shunailov and Yalandin2011; Sharypov et al., Reference Sharypov, Shpak, Shunailov, Ul'masculov and Yalandin2013; Tarasenko and Rybka, Reference Tarasenko and Rybka2016). The study of the characteristics of the runaway electrons under different conditions is extensively conducted. Further calculation of the number density and energy distribution of the runaway electrons is also available (Levko et al., Reference Levko, Yatom, Vekselman, Gleizer, Gurovich and Krasik2012b; Zhang et al., Reference Zhang, Tarasenko, Gu, Baksht, Wang, Yan and Shao2015; Kozyrev et al., Reference Kozyrev, Kozhevnikov, Lomaev, Sorokin, Semeniuk and Tarasenko2016).
Note that many researches have been carried out on measuring REB using collectors and shunts (Mesyats et al., Reference Mesyats, Reutova, Sharypov, Shpak, Shunailov and Yalandin2011; Levko et al., Reference Levko, Yatom, Vekselman, Gleizer, Gurovich and Krasik2012b; Tarasenko et al., Reference Tarasenko, Baksht, Beloplotov, Burachenko, Kostyrya, Lomaev, Rybka and Sorokin2015, Reference Tarasenko, Lomaev, Beloplotov and Sorokin2016). It is consisted of a receiving part, a metal case, a coaxial connector, and an insulator for separating the coaxial connector with the metal case (Tarasenko et al., Reference Tarasenko, Baksht, Beloplotov, Burachenko, Kostyrya, Lomaev, Rybka and Sorokin2015, Reference Tarasenko, Lomaev, Beloplotov and Sorokin2016). Due to the requirement of the impedance matching, most of the collectors are designed as a termination of a transmission line. The REB current is calculated by the ratio of the induced potential from the receiving part and the matched resistance (50 or 75 Ω). Some researches adopt a collector gage, where REB current passes through the gage aperture of a diameter of 9.5 mm (Mesyats et al., Reference Mesyats, Reutova, Sharypov, Shpak, Shunailov and Yalandin2011). Note that the collector has a similar structure to the Faraday cup. The impedance matching between the pulsed power generator and the discharge reactor as well as the collector is fixed. Thus, the exact value of the equivalent resistance of the collector is unclear. In addition, the secondary electrons produced by the runaway electrons and the receiving part will increase the measured REB current, leading to the inaccuracy of the REB current. Hu and Rovey (Reference Hu and Rovey2011) provided a movable design of a Faraday cup with a nanosecond response and adjustable impedance for fast electron beam measurement. This Faraday cup had 50 Ω characteristic impedance to match with a 50 Ω standard Bayonet Neill–Concelman (BNC) coaxial cable. However, in their experiments the Faraday cup was used in a relatively low voltage peak, and the time resolution was several nanoseconds. The goal of the present work is to demonstrate another approach with a universal Faraday cup with a known sampling resistor to measure the REB current in nanosecond-pulse discharge. Effects of the gap spacing, gas pressure, and cathode material on the REB current are presented based on the designed Faraday cup.
Experimental setups
Figure 1 shows the schematic picture of the experimental setup. A nanosecond-pulse generator (VPG-30-200) is used to produce nanosecond-pulse discharges. The generator is based on a transmission line transformer and a thyratron. The wave impedance of the transmission line is 65 Ω. The output voltage has a rise time of 1.6 ns and a FWHM of 3–5 ns (Zhang et al., Reference Zhang, Tarasenko, Gu, Baksht, Wang, Yan and Shao2015). The polarity of the output pulses is negative. The discharge is produced in a discharge chamber with a tube-to-plane gap. The cathode is a stainless steel (SS) tube which connects to the end of the transmission line. The diameter and the thickness of the tube are 6 mm and ~100 µm, respectively. The anode is a grounded Al foil with a diameter of 80 mm. The thickness of the Al ranges from 10 to 40 µm. The adjustable interelectrode gaps are 5–12 mm. The voltage applied to the electrodes is measured by a capacitive divider located at the end of the transmission line. A homemade Faraday cup is used to measure the REB current behind the anode. For comparison, a collector is also used to measure the REB current, which is used in the previous measurement (Zhang et al., Reference Zhang, Tarasenko, Gu, Baksht, Beloplotov, Burachenko, Yan, Lomaev and Shao2016). The receiving part of the collector has a diameter of 40 mm. The time resolution of the collector is ~0.5 ns. A Lecory 808Zi-A oscilloscope is used to record the voltage and REB current via a coaxial cable of 1 m. The maximum bandwidth of the oscilloscope is 8 GHz, and the sample rate is 40 G/s. It is sufficient to measure the signal with a rise time of ~100 ps (Tarasenko et al., Reference Tarasenko, Lomaev, Beloplotov and Sorokin2016). The detailed description of the Faraday cup will be discussed in the next section.
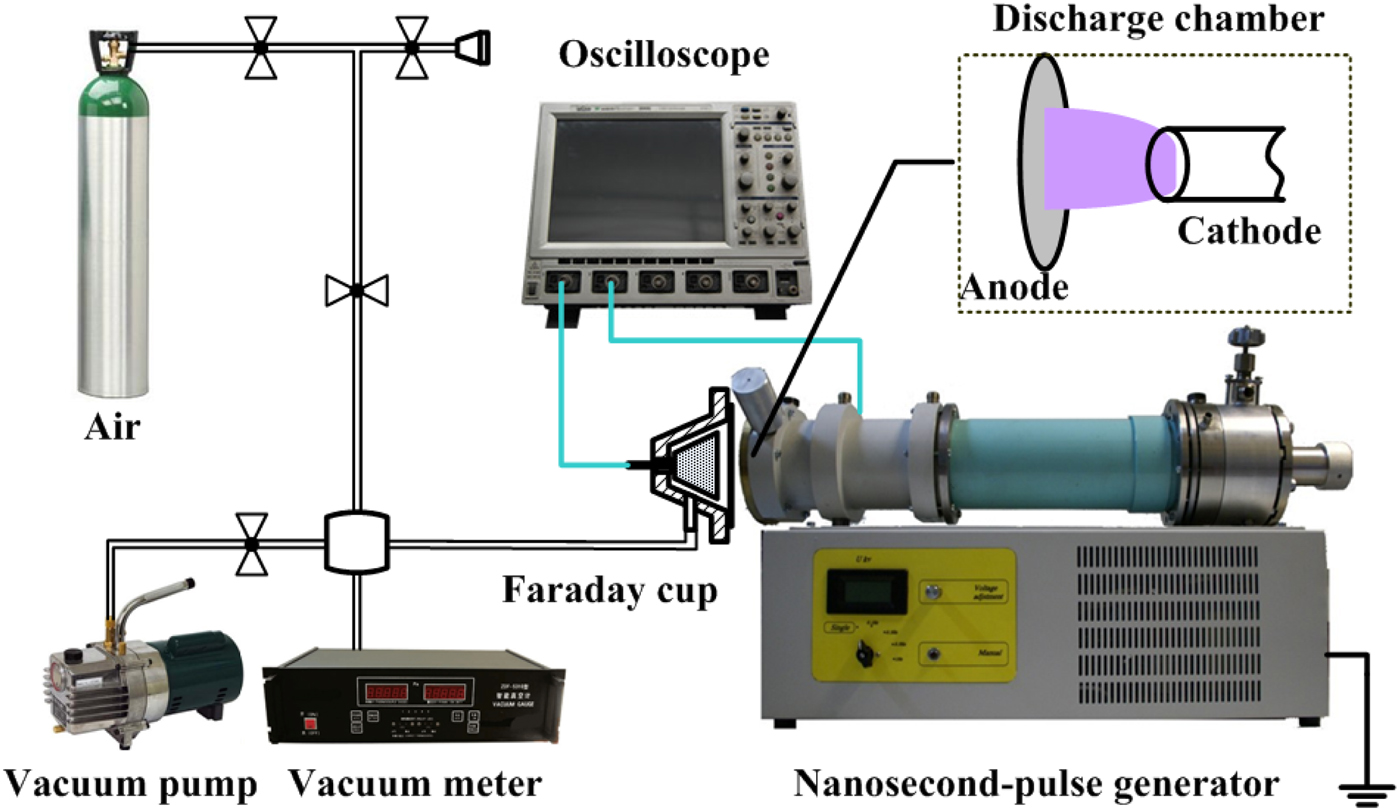
Fig. 1. Schematic picture of the experimental setup.
Description and test of the Faraday cup
Description of the Faraday cup
The schematic diagram of the Faraday cup is shown in Figure 2. The Faraday cup consists of a conducting metallic chamber, including a receiving part, a dielectric support, a grounded metal shell, and a connector (Kumar et al., Reference Kumar, Chandra, Mitra, Beg, Sharma, Shar-ma and Mittal2014; Tarasenko et al., Reference Tarasenko, Lomaev, Beloplotov and Sorokin2016). The receiving part is used to absorb the REB. The dielectric support is used to insulate the small current from the grounded metal shell. The connector is used to conduct the small current to the oscilloscope via a measurement circuit. The Faraday cup can also be used as a collector for the electron beam. In this case, electrons simply hit the receiving part and there is a current relating to the number of electrons. It is considered a universal electron detector because of its independence of energy, mass, chemistry, etc. Generally, a bias voltage (U bias) makes more electrons to be collected when a positive voltage is applied on the receiving part; a DC-block capacitor (C) is used to avoid the interference of the bias voltage, and a sampling resistor (R) is used to obtain the REB current on the oscilloscope.

Fig. 2. Schematic diagram of the Faraday cup.
Figure 3 shows the schematic structure and photograph of the homemade Faraday cup. In the Faraday cup, the metal shell is made of an Al cylinder. The inner diameter of the Al cylinder is 95 mm. It is connected to the discharge chamber, and the anode foil is fixed between the Al cylinder and the chamber. The receiving part is made of high purity graphite cup, which has small scattering loss, high sublimation temperature, and excellent electrical conductivity. Thus, the graphite cup can sustain beam impact resulted from multiple pulses. The distance between the receiving part and the anode foil is 2 mm. Furthermore, compared with the Al and copper (Cu), graphite would generate less secondary electrons. The diameter of the graphite cup is 40 mm, which is sufficient to measure the REB penetrated the anode foil. Moreover, the depth of the graphite cup bottom is 5 mm, exceeding the stopping distance (3 mm) for electrons with the energy of 1 MeV in graphite. It ensures all the high-energy electrons being collected by the Faraday cup. The dielectric support for the graphite cup is made of a coaxial PTFE with a thickness of 2 mm. It is used to hold the Faraday cup on the Al cylinder. The connector, which is made of a Cu column with a diameter of 3 mm, is used to conduct the REB current out of the Faraday cup. One end of the connector is firmly connected to the center of the receiving part, and another end is an N-type RF connector. The sampling resistor consists of eight non-inductance resistances, whose value is 500 Ω each. They are in parallel connection and distributed between the receiving part and the metal shell. A Cu ring firmly attaches to the graphite cup to ensure the connection of the receiving part and the sampling resistor. The measured value of the sampling resistors is 51.61 Ω via a microhmmeter, which matches the impendence of the oscilloscope. Thus, the exact REB current could be measured by this homemade Faraday cup. In addition, due to the REB current exceeds tens of milliamperes, in the collector, no additional U bias is used. The photograph of the Faraday cup is also shown in Figure 3. To prevent the influence of the secondary electrons emission, several coaxial grooves are etched on the graphite surface, decreasing the generation of the secondary electrons (Chang et al., Reference Chang, Liu, Chen, Sun, Liu, Guo, Cao, Wang and Song2015).
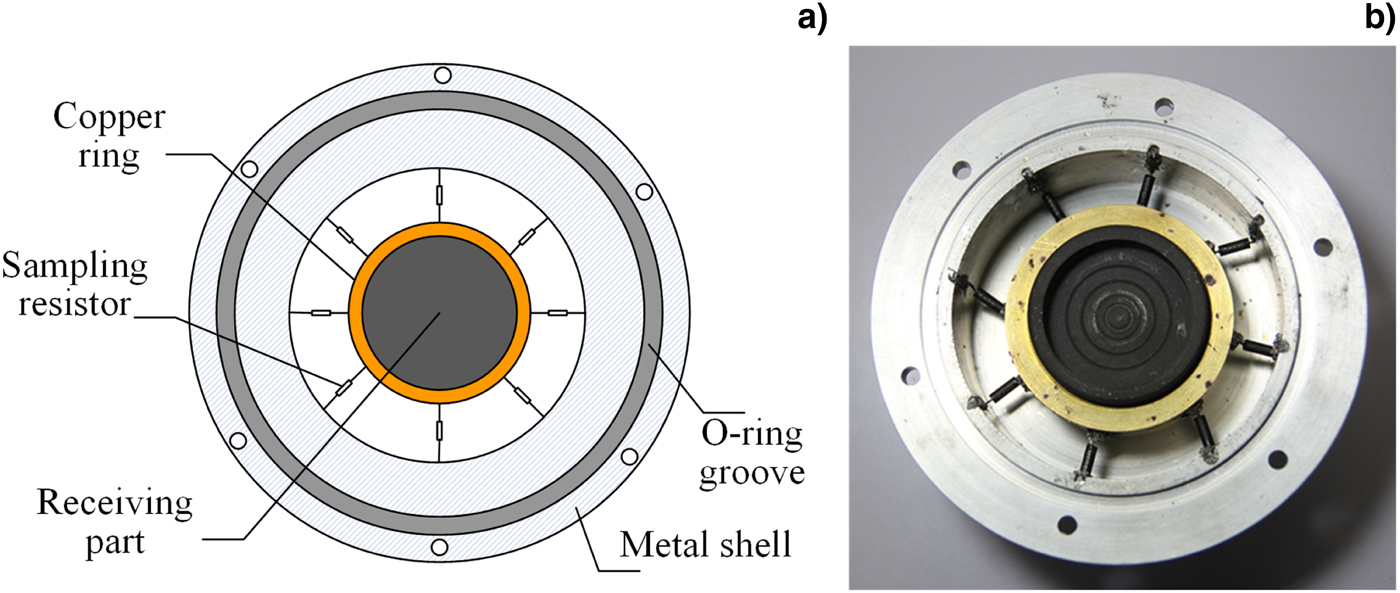
Fig. 3. Overview of the flow diagram in the simulation.
Test of the Faraday cup
Figure 4 shows typical voltage and current waveforms in nanosecond-pulse discharges. The experimental results are as follows: the applied voltage is approximately −120 kV, the gap spacing is 8 mm. Note that the measured REB current consists of a negative pulse and a consecutive positive pulse. The former appears during the rising edge of the applied voltage, it is the REB current. The latter is the reflection in the circuit due to the mismatch between the generator and the load. It could be seen that the REB current has a rise time of 348 ps and a FWHM of 510 ps, indicating that the time resolution of the Faraday cup is enough to record the REB current. Furthermore, the amplitude of the REB current is 28.8 mA, and it is much smaller than the amplitude of the discharge current, whose amplitude reaches 1.6 kA. The difference between the REB current and the discharge current is because the measured REB current origins by the part of the electrons, namely high-energy electrons behind the anode foil, while the discharge current is dependent on the whole current going through the plasma channel. In addition, the discharge current initiates after the generation of the REB current, confirming the preionization of the high-energy electrons in nanosecond-pulse discharges. For comparison, we measured the beam current when the anode foil with a thickness of 0.5 mm, as shown in Figure 5. It could be seen that no REB current was measured because almost all the runaway electrons are blocked by the thick anode. It confirms that the signal measured in Figure 4 comes from the REB downstream of the Al foil.

Fig. 4. Voltage and current waveforms in nanosecond-pulse discharges.

Fig. 5. Voltage and measured current with a cooper foil with a thickness of 0.5 mm.
To evaluate the measured REB current by the homemade Faraday cup, the REB current is also measured by a collector under the same experimental conditions. Figure 6 shows the measured voltage and REB current by the collector. It could be seen that the current also appears on the rising edge of the applied voltage, confirming that the measured current is the REB current. The REB current measured by the collector has an amplitude of 36.5 mA. It has a rise time of 423 ps and a FWHM of 605 ps. Compared with the REB current measured by the Faraday cup, although the receiving part for both the Faraday cup and collector has the same diameter, the REB current measured by the collector is higher. It is because the graphite cup in the Faraday cup has several coaxial grooves on the surface. They absorb the secondary electrons generated on the graphite surface. Otherwise, these secondary electrons may collide with the high-energy electrons penetrating the anode foil and lose energy in the collision. Thus, the secondary electrons are more likely to absorb in the Faraday cup. The comparison of the REB current measured by the Faraday cup and the collector shows the designed Faraday cup can be used to measure the REB in nanosecond-pulse discharge. It should be pointed that, owing to the effect of the circuit and the sampling resistor parameters, the time resolution of the Faraday cup is worse than 100 ps. It could be improved by decreasing the diameter of the receiving part and using the non-inductance chip resistor (Tarasenko et al., Reference Tarasenko, Lomaev, Beloplotov and Sorokin2016).

Fig. 6. Voltage and REB current measured by a collector.
Using the sequence mode of the oscilloscope, the time intervals between pulses are reduced in the horizontal axis. Figure 7 shows the consecutive waveforms of voltage and REB current after three shots. The experimental conditions are the same as those in Figure 4. It is obvious that the REB currents are similar from shot to shot, and the rise time and amplitude of the REB current has good repeatability. It means the measured REB currents by the designed Faraday cup are stable.
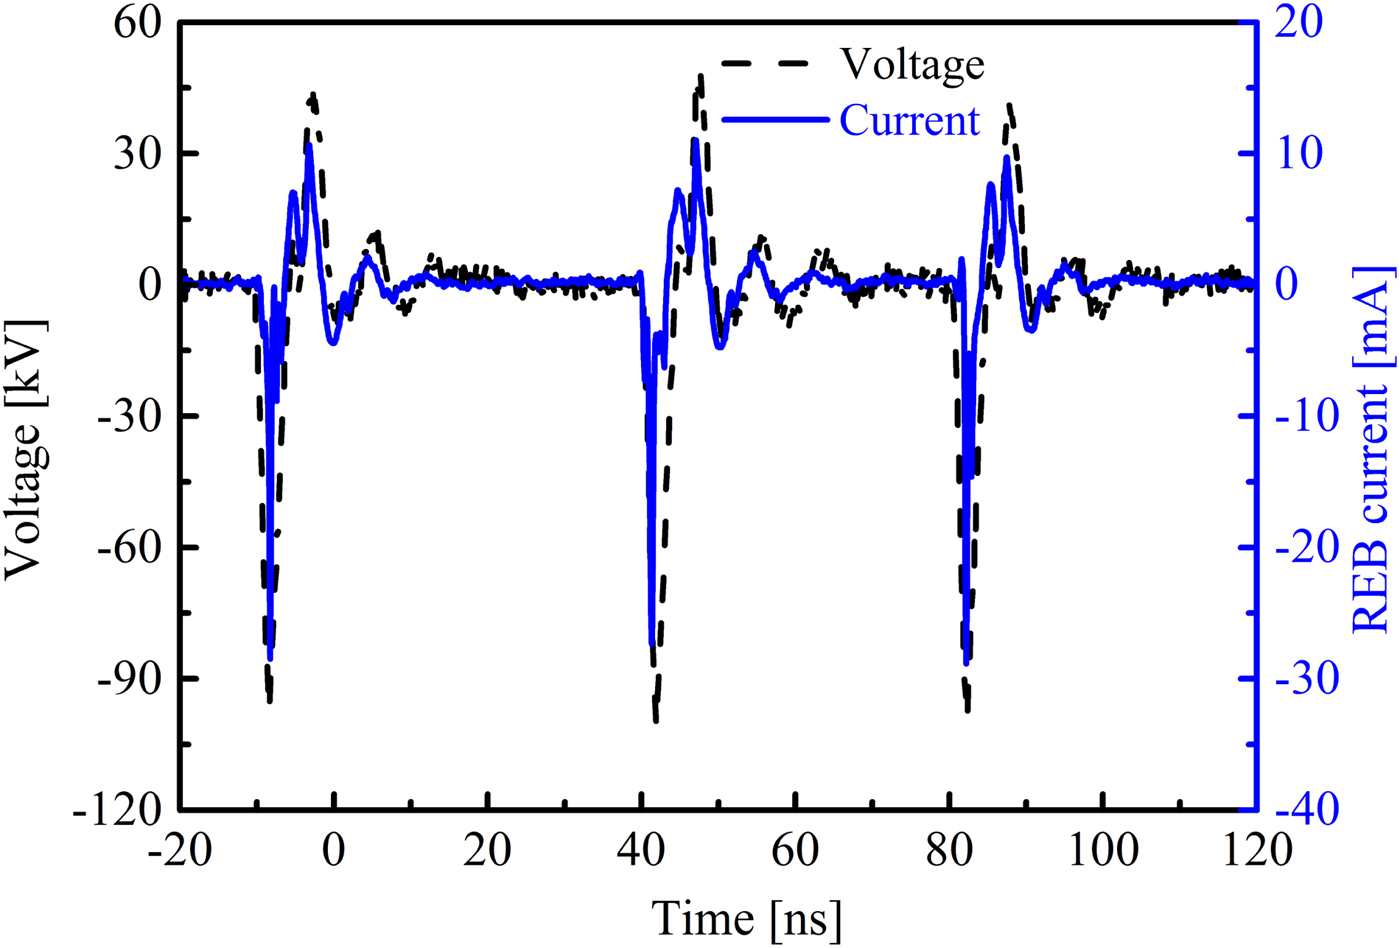
Fig. 7. Time-reduced consecutive waveforms of voltage and REB current.
Characteristics of the REB current
Effect of the interelectrode gap
The interelectrode gap affects the electric field in nanosecond-pulse discharges. Figure 8 shows the waveforms of the voltage and the REB current at different interelectrode gaps. The experimental conditions are as follows: the applied voltage is −120 kV, the interelectrode gap ranges from 5 to 12 mm. It could be seen that the amplitude of the voltage increases with the interelectrode gap, indicating the generation of the discharges. The REB currents are 38.6, 28.8, and 15.9 mA when the gap is 5, 8, and 12 mm, respectively. Figure 9 shows the dependence of the amplitude of the REB current on the interelectrode gap. Note that the amplitude of the REB current decreases when the interelectrode gap increases. It is because the electric field is strong enough to generate more initial electrons in the small gap than those in the large gap. These initial electrons are more likely to accumulate sufficient high-energy for generating REB in nanosecond-pulse discharges.
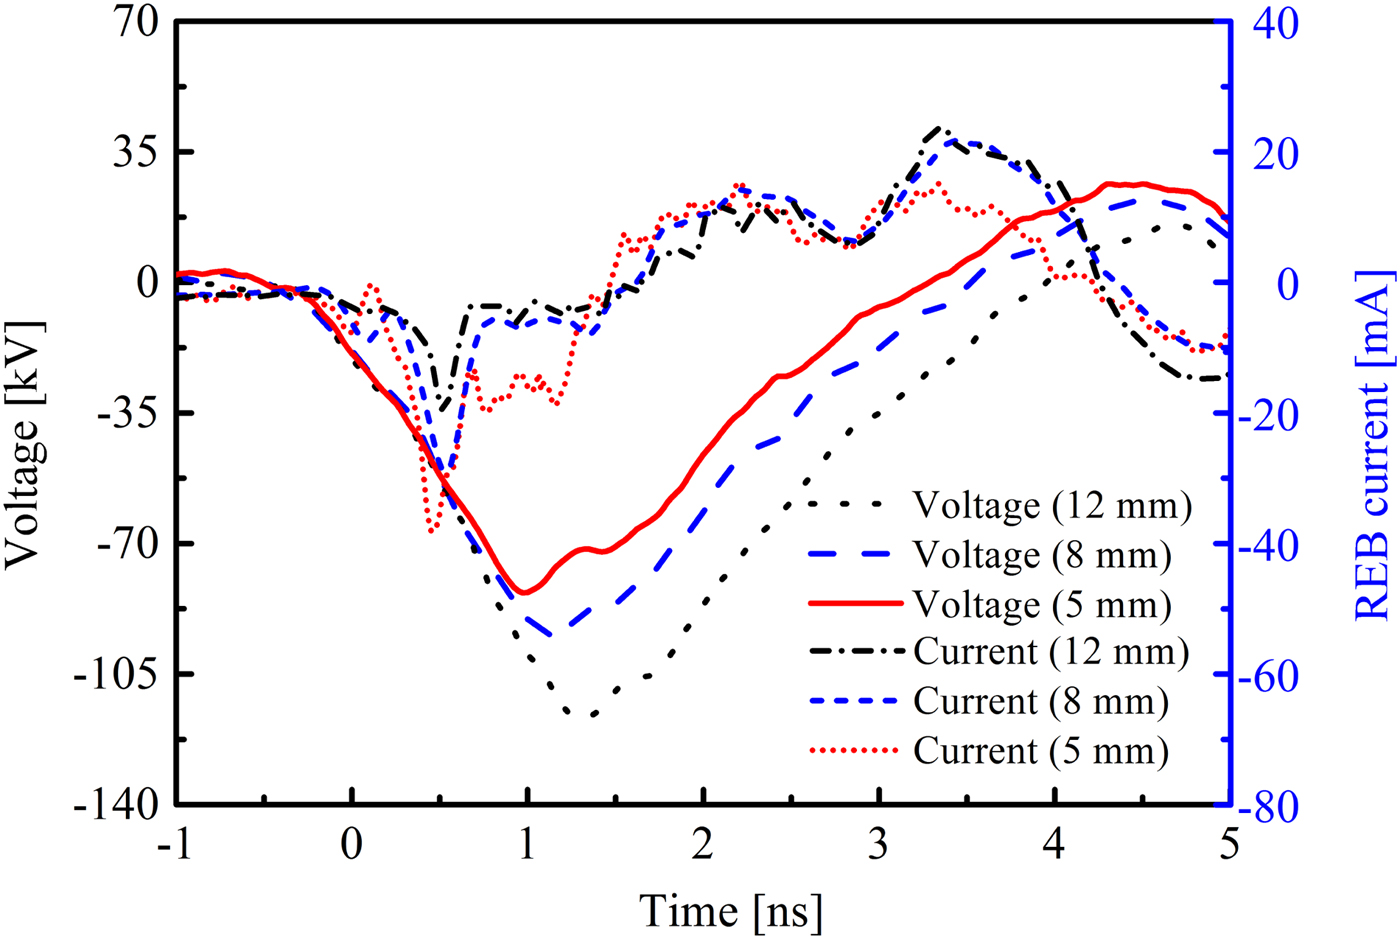
Fig. 8. Voltage and REB current at different interelectrode gaps.
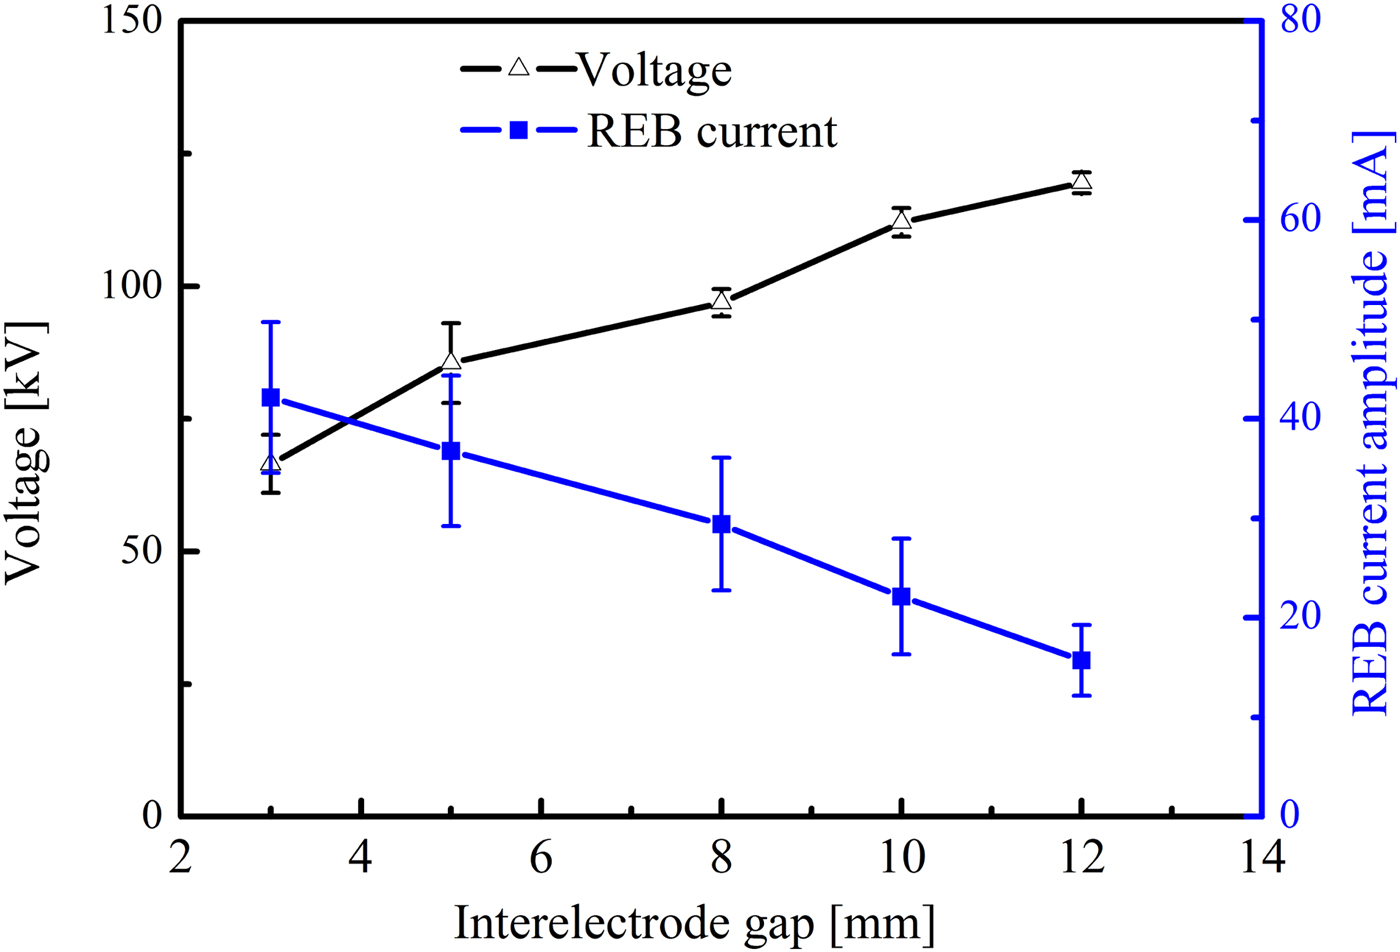
Fig. 9. Dependence of the amplitude of the voltage and REB current on the interelectrode gap.
Effect of the gap pressure
Gas pressure is another parameter that influences the mean free path of electrons. Faraday cup is also a general instrument to measure the beams in a vacuum or low-pressure environment. Using the homemade Faraday cup, the variation trends of the voltage and REB current under different pressures are measured, and the corresponding results are shown in Figure 10. The experimental conditions are as follows: the applied voltage is −120 kV, the gap is 12 mm, and the gas pressure ranges from 0.01 to 1 atm. The breakdown voltage increases with the air pressure. However, the REB current significantly decreases when the air pressure increases. Two reasons can be explained for the variation trend of the REB current. One is the breakdown voltage is higher at low pressure compared with that at high pressure, generating less initial electrons due to field emission under low pressure. The other reason is the mean free path of electrons is longer at low pressure than that at high pressure. The initial electrons are more likely to accelerate sufficient high-energy for running away from the head of the avalanche and forming streamer in the gap. The measurement results by using the Faraday cup successfully reflect the variation trend of the REB current at different gas pressures.
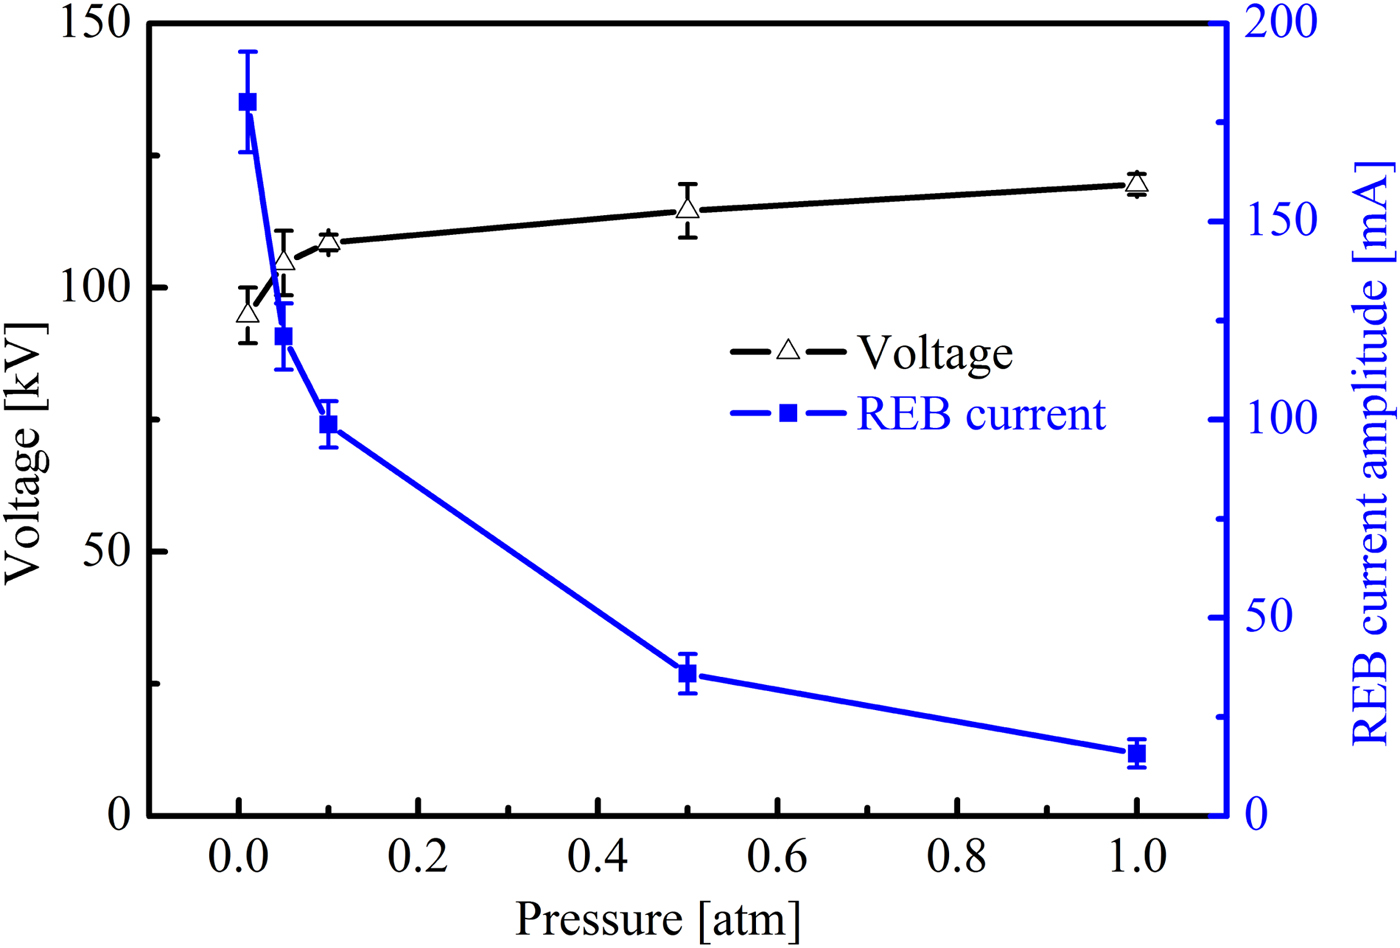
Fig. 10. Dependence of the amplitude of the voltage and REB current on the gas pressure.
Effect of the cathode material
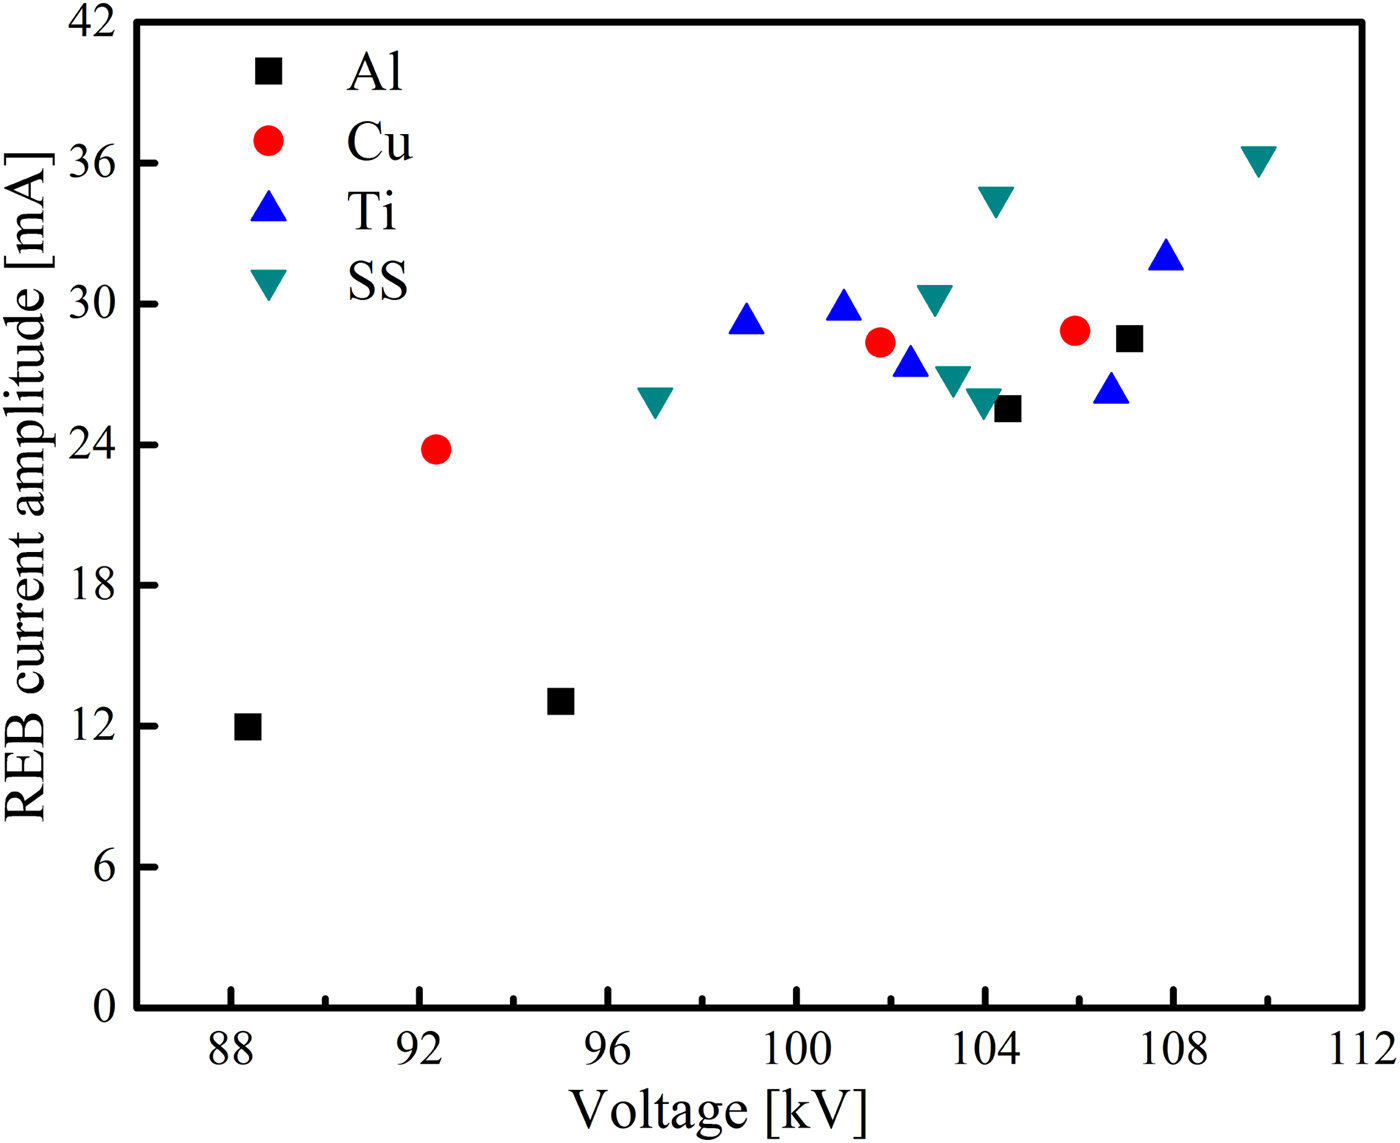
To obtain the effect of the cathode material on the REB current, foils made from Al, Cu, titanium (Ti), and SS are used as cathodes, respectively. Figure 11 shows the REB current and the corresponding voltage across the gap under the conditions of different cathode materials. The experimental conditions are as follows: all the cathodes have a diameter and a thickness of 6 mm and ~100 µm, respectively. The applied voltage is −120 kV and the gap spacing is 12 mm. Every point in the figure represents one single shot. It could be seen that the voltage across the gap is large when the SS cathode is used. The corresponding REB current is the highest. When the cathode is made from an Al foil, the amplitude of the REB current is the smallest. Table 1 shows the REB currents under the conditions of different gaps and cathode diameters. The cathode material is fixed at SS. The applied voltage is −120 kV and the gaps are 8 and 10 mm. Note that changing the cathode diameter significantly influences the REB current measured by the designed Faraday cup. When the cathode diameter increases, the REB current correspondingly increases, but it remains at the same order of magnitude.

Fig. 11. Amplitude of the REB current and the voltage under different cathode materials.
Table 1. Effect of the cathode diameters on the REB current

Discussion
A large amount of research has been conducted to investigate sub-nanosecond-pulse discharges with high amplitude and some hypotheses are proposed (Yatom et al., Reference Yatom, Shlapakovski, Beilin, Stambulchik, Tskhai and Krasik2016; Hou et al., Reference Hou, Zhang, Qiu, Gu, Wang and Shao2017). There is no unified theory about nanosecond-pulse discharge yet. It is well accepted that runaway electrons with high energy instead of the photoionization are the main factor causing the secondary electrons in the process of nanosecond-pulse discharge (Shao et al., Reference Shao, Tarasenko, Yang, Beloplotov, Zhang, Lomaev, Yan and Sorokin2014; Tarasenko et al., Reference Tarasenko, Baksht, Beloplotov, Burachenko, Kostyrya, Lomaev, Rybka and Sorokin2015).
When the negative pulse voltage is applied to the electrode, the electric field is enhanced around the area with a small curvature radius. Due to the rise time of the applied voltage within the range of sub-nanosecond, the local electric field can reach or even exceed the nominal field intensity of the cathode field emission in a very short time (Shao et al., Reference Shao, Tarasenko, Yang, Beloplotov, Zhang, Lomaev, Yan and Sorokin2014). The field emission produced by the cathode tip generates initial electrons. These initial electrons collide with molecules, forming electron avalanches which move rapidly toward the anode under the acceleration of the electric field. On the other hand, the positive ions produced by collision are left behind because of their huge mass and the field emission is enhanced near the cathode further. At the same time, the photoionization produced by the combination process promotes the production of electrons near the cathode. When the applied pulse voltage increases to tens even hundreds of kilovolts, the electric field around the cathode increases sharply. Because of the high-reduced electric field intensity E/N (E is the electric field intensity, N is the gas density), the electrons are accelerated by the electric field continuously. When the friction force is less than the electric field force, electrons enter the runaway regime (Oreshkin et al., Reference Oreshkin, Barengolts, Oreshkin and Mesyats2017).
The discharge modes in this experiment are diffuse discharge, and the voltage range of the diffuse discharge is significantly affected by the air gap spacing (Shao et al., Reference Shao, Wang, Zhang and Yan2018). With the increase of air gap distance, the voltage range of the diffuse discharge is larger than the diffuse discharge breakdown voltage of the air gap. Although the distance increases and the discharge voltage increases, the electric field significantly decreases. With the E/N in the gap reduces during the discharge, the electric field force of electrons decreases. Thus, the electrons could not accumulate sufficient energy, causing the number of electrons in the runaway regime to decrease.
With the increase of pressure p (in this paper corresponds to the case with large pd; d is the gap distance), the gas density increases and the mean free path of electrons decreases. If the gap distance is equal, the electric field strength required for the same energy is increased, so the breakdown voltage of the air gap under the same geometry increases, as shown in Figure 10. However, due to the higher gas density and greater friction force of electrons, the number of runaway electrons decreases with the increase of the pressure (Tarasenko et al., Reference Tarasenko, Lomaev, Beloplotov and Sorokin2016).
In the experiments, both cathode material and diameter prominently affect the REB current in a nanosecond-pulse discharge. The effect of the cathode material on the REB current is due to the work function of the metals. The work function of the SS is larger than Al, leading to more initial electrons in the field emission in the case of the SS cathode. Thus, more high-energy electrons would be turn to runaway mode. In addition, the generation of runway electrons not only at the cathode edge with the smallest radius curvature, but also at the side surface at the cathode (Tarasenko et al., Reference Tarasenko, Baksht, Burachenko, Kostyrya, Lomaev and Rybka2008). Increasing the cathode diameter with a fixed cathode length increases the side surface of the cathode. Therefore, the REB current increases when the cathode diameter increases.
Conclusions
A Faraday cup is designed to measure the REB in nanosecond-pulse discharges. In the Faraday cup, sampling resistor consists of a series non-inductance. A resistance is used to match the impendence of the oscilloscope. Several coaxial grooves are etched on the receiving part surface, which is made of graphite, decreasing the generation of the secondary electrons. The Faraday cup is tested in a nanosecond-pulse discharge with a rise time of 1.6 ns and a FWHM of 3–5 ns. The test results showed that the measured REB current has a rise time of 348 ps and a FWHM of 510 ps, indicating the Faraday cup has a time resolution of ~500 ps. The measured REB current is compared with the one measured by a collector, and the results confirm that the REB current could be obtained by the Faraday cup. Furthermore, time-reduced consecutive waveforms of REB current show the Faraday cup has good repeatability. The effects of the interelectrode gap, gap pressure, and cathode material on the REB current show that the REB current decreases when the gap spacing increases due to the decrease of the reduced electric field in the gap. Furthermore, when the pressure increases, the mean free path of electrons decreases leading to the decrease of the REB current. In addition, due to the large work function of the metal, the REB current is largest when the cathode is made of SS, while it is smallest when the cathode is made of Al. Increasing the cathode diameter leads to the increase of the REB current because more initial electrons will be generated at the side surface of the cathode.
Acknowledgments
This work was supported by the National Natural Science Foundation of China under contracts NSFC 51477164, 11811530066 and Fundamental and Frontier Science and Technology Project of State Grid Corporation.