1. INTRODUCTION
The advent of ultrashort ultraintense laser pulses led to the development of new exciting fields in laser plasma interaction (Karsch et al., Reference Karsch, Habs, Schatz, Schramm, Thirolf, Meyer-ter-Vehn and Pukhov1999; Malka et al., Reference Malka and Fritzler2004; Roth et al., Reference Roth, Brambrink, Audebert, Blazevic, Clarke, Cobble, Geissel, Habs, Hegelich, Karsch, Ledingham, Neelz, Ruhl, Schlegel and Schreiber2005; Mangles et al., Reference Mangles, Walton, Najmudin, Dangor, Krushelnick, Malka, Manclossi, Lopes, Carias, Mendes and Dorchies2006; Kawata et al., Reference Kawata, Kong, Miyazaki, Miyauchi, Sonobe, Sakai, Nakajima, Masuda, Ho, Miyanaga, Limpouch and Andreev2005; Yu et al., Reference Yu, Xu, He, Yu, Ishiguro, Zhang and Wong2005; Glowacz et al., Reference Glowacz, Hora, Badziak, Jablonski, Cang and Osman2006; Koyama et al., Reference Koyama, Adachi, Miura, Kato, Masuda, Watanabe, Ogata and Tanimoto2006; Lifshitz et al., Reference Lifshitz, Faure, Glinec, Malka and Mora2006; Sakai et al., Reference Sakai, Miyazaki, Kawata, Hasumi and Kikuchi2006; Yu et al., Reference Yu, Yu, Xu, Tian, Chen and Wong2007; Hora, Reference Hora2007; Dromey et al., Reference Dromey, Bellei, Carroll, Clarke, Green, Kar, Kneip, Markey, Nagel, Willingale, McKenna, Neely, Najmudin, Krushelnick, Norreys and Zepf2009; Fazio et al., Reference Fazio, Neri, Ossi, Santo and Trusso2009; Hoffmann Reference Hoffmann2008a, Reference Hoffmann2008b; Kasperczuk et al., Reference Kasperczuk, Pisarczyk, Nicolai, Stenz, Tikhonchuk, Kalal, Ullschmied, Krousky, Masek, Pfeifer, Rohlena, Skala, Klir, Kravarik, Kubes and Pisarczyk2009a, Reference Kasperczuk, Pisarczyk, Demchenko, Gus'kov, Kalal, Ullschmied, Krousky, Masek, Pfeifer, Rohlena, Skala and Pisarczyk2009b; Laska et al., Reference Laska, Badziak, Gammino, Jungwirth, Kasperczuk, Krasa, Krousky, Kubes, Parys, Pfeifer, Pisarczyk, Rohlena, Rosinski, Ryc, Skala, Torrisi, Ullschmied, Velyhan and Wolowsk2007; Limpouch et al., Reference Limpouch, Psikal, Andreev, Platonov and Kawata2008; Malekynia et al., Reference Malekynia, Ghoranneviss, Hora and Miley2009; Sharma & Sharma Reference Sharma and Sharma2009; Izgorodin et al., Reference Izgorodin, Abzaev, Balyaev, Bessarab, Cherkesova, Chulkov, Fenoshin, Garanin, Gogolev, Golubinsky, Ignat'ev, Irinichev, Lachtikov, Morovov, Nazarov, Nikolaev, Pepelyaev, Pinegin, Rojz, Romaev, Solomatina, Vasin and Veselov2009; Li et al., Reference Li, Liu, Cheng, Xu, Ge and Wen2009; Sadighi-Bonabi et al., Reference Sadighi-Bonabi, Navid and Zobdeh2009; Hong et al., Reference Hong, He, Wen, Du, Teng, Qing, Huang, Huang, Liu, Wang, Huang, Zhu, Ding and Peng2009; Kline et al., Reference Kline, Montgomery, Rousseaux, Baton, Tassin, Hardin, Flippo, Johnson, Shimada, Yin, Albright, Rose and Amiranoff2009). The generation of energetic ion beams from laser plasma interaction is an exciting area of research with important applications ranging from medical proton therapy (Bulanov & Khoroshkov, Reference Bulanov and Khoroshkov2002), high-energy-density physics (Patel et al., Reference Patel, Mackinnon, Key, Cowan, Foord, Allen, Price, Ruhl, Springer and Stephens2003), to fast ignition in inertial confinement fusion (Roth et al., Reference Roth, Cowan, Key, Hatchett, Brown, Fountain, Johnson, Pennington, Snavely, Wilks, Yasuike, Ruhl, Pegoraro, Bulanov, Campbell, Perry and Powell2001). A beam of energetic ions has an almost straight trajectory while penetrating matter, as well as an excellent coupling efficiency to the nuclear fuel, and delivers its energy in a well defined volume because ions deposit most of their energy at the end of their range, forming a Bragg peak (Caruso & Pais, Reference Caruso and Pais1996). To date mainly three laser-ion acceleration mechanisms have been demonstrated, i.e., the target-normal sheath acceleration (Cowan et al., Reference Cowan, Fuchs, Ruhl, Kemp, Audebert, Roth, Stephens, Barton, Blazevic, Brambrink, Cobble, Fernández, Gauthier, Geissel, Hegelich, Kaae, Karsch, Le sage, Letzring, Manclossi, Meyroneinc, Newkirk, Pépin and Renard-Legalloudec2004), the break-out afterburner (BOA) (Yin et al., Reference Yin, Albright, Hegelich and Fernández2006; Hegelich et al., Reference Hegelich, Albright, Cobble, Flippo, Letzring, Paffett, Ruhl, Schreiber, Schulze and Fernández2006), and the radiation pressure acceleration (RPA) (Esirkepov et al., Reference Esirkepov, Borghesi, Bulanov, Mourou and Tajima2004; Henig et al., Reference Henig, Steinke, Schnürer, Sokollik, Hörlein, Kiefer, Jung, Schreiber, Hegelich, Yan, Meyer-ter-Vehn, Tajima, Nickles, Sandner and Habs2009).
In target-normal sheath acceleration, the ponderomotive force of the laser provides thermal clouds of electrons and a strong charge-separation field to accelerate ions. This process can be described by the model of free plasma expansion into vacuum (Mora, Reference Mora2003). The density of target-normal sheat acceleration ions is too low (usually less than the critical density n c) for many applications, such as for research in high energy-density matter (HEDM) (Patel et al., Reference Patel, Mackinnon, Key, Cowan, Foord, Allen, Price, Ruhl, Springer and Stephens2003) and fast ignition (FI) (Roth et al., Reference Roth, Cowan, Key, Hatchett, Brown, Fountain, Johnson, Pennington, Snavely, Wilks, Yasuike, Ruhl, Pegoraro, Bulanov, Campbell, Perry and Powell2001). To increase the density of the ion beams, the rear surface can be tailored to a spherical curvature in order to ballistically focus these protons to a small spot (Patel et al., Reference Patel, Mackinnon, Key, Cowan, Foord, Allen, Price, Ruhl, Springer and Stephens2003; Roth et al., Reference Roth, Cowan, Key, Hatchett, Brown, Fountain, Johnson, Pennington, Snavely, Wilks, Yasuike, Ruhl, Pegoraro, Bulanov, Campbell, Perry and Powell2001; Wilks et al., Reference Wilks, Langdon, Cowan, Roth, Singh, Hatchett, Key, Pennington, Mackinnon and Snavely2001). Using a spherically shaped target, a focused proton beam is produced and used to heat a smaller volume to over 20 eV, which provides a unique method for creating isochorically heated high-energy density plasma states (Patel et al., Reference Patel, Mackinnon, Key, Cowan, Foord, Allen, Price, Ruhl, Springer and Stephens2003).
Based on particle-in-cell (PIC) simulations, the generation of proton beams using a target with a concave back surface was first studied by Wilks et al. (Reference Wilks, Langdon, Cowan, Roth, Singh, Hatchett, Key, Pennington, Mackinnon and Snavely2001). They found that protons can be focused to a spot with high energy density. Following this work, a comprehensive study of the dependence of the maximum proton energy on different (concave) target shapes has been presented by Okada et al. (Reference Okada, Andreev, Mikado and Okubo2006), which concluded that a parabolic concave target is optimal for proton acceleration. By using a thin parabolic concave target, the maximum ion energy is greatly enhanced, and an optimum width for generating a high-quality ion bunch exists (Liu et al., Reference Liu, Wu, Xie, Liu, Wang and Yu2008). Via adding an axial filament stemming to the apex of a cone cavity (umbrella-like cavity target), it is found that instead of diverging after first focusing, as in the cone-shaped target, the protons produced from the umbrella-like target are well collimated (Ma et al., Reference Ma, Sheng, Gu, Yu, Yin, Shao, Yu and Chang2009).
In this paper, we develop a simple fluid theory based on the charge-separation field to investigate the physical mechanism behind the ion jet generation. We find that the emergence of the ion jet is accompanied by a dramatic distortion of the expanding ion surface. We have obtained analytical expressions for the time when the ion jet emerges and the maximum velocity that the ion jet acquires. Our theoretical analysis has been verified by PIC simulations. Our paper is organized as follows: In Section 2, we analyze the dynamics of concave target irradiated by laser pulse. Based on an extended ion expanding model, we present our analytical results on ion jet generation. To confirm the theoretical estimates, we carry out a 2D3V PIC simulations in Section 3. The PIC simulations show a clear signal of ion jet generation. Our theoretical analyses are supported by the simulation results. Section 4 is the conclusion.
2. THE DYNAMICS OF THE ION EXPANDING MODEL
An ultraintense laser incident on a target accelerates a large number of electrons. These electrons propagate to the rear side of the typical thin foil target and produce a charge-separation field. The ion acceleration on the rear surface could be explained by the model of self-similar plasma expansion into vacuum (Mora, Reference Mora2003). In the expansion process, an ion layer with thickness of the Debye length λD on the ion expanding surface is accelerated by a time-dependent charge-separation field. Now we focused on the dynamics of the thin layer. In contrast to previous work (Mora, Reference Mora2003), we extend our analysis to a 2D configuration, and the laser is propagates along x direction. Essentially, the charge-separation field E f on the layer is position-independent, pointing normal to the rear surface.
The ion expansion is commonly described by the simple self-similar, isothermal, fluid model (Mora, Reference Mora2003; Fuchs et al., Reference Fuchs, Antici, D'humières, Lefebvre, Borghesi, Brambrink, Cecchetti, Kaluza, Malka, Manclossi, Meyroneinc, Mora, Schreiber, Toncian, Pépin and Audebert2006), in which the electrostatic charge-separation field is given by
where ![]() , and
, and ![]() is the ion plasma frequency, with e being the exponential constant, m i being the ion mass, q being the electron charge, ε0 being the electric permittivity, Z being the charge number, T h and n e0 the are temperature and density of the hot electrons that drive the rear-surface expand, t 0 is the time when the rear surface begins to expand. Then the equations of motion for an element on the layer become
is the ion plasma frequency, with e being the exponential constant, m i being the ion mass, q being the electron charge, ε0 being the electric permittivity, Z being the charge number, T h and n e0 the are temperature and density of the hot electrons that drive the rear-surface expand, t 0 is the time when the rear surface begins to expand. Then the equations of motion for an element on the layer become
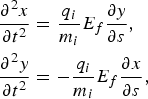
where q i is the ion charge, and ds = (dx 2 + dy 2)1/2 is the length of the surface element. These equations coincide with Ott's (1972) equations.
We set the initial front surface of the target at X. We immediately see that a one-dimension-fit carried out by Mora (Reference Mora2003)
is a trivial solution, and indeed this is just the unperturbed equilibrium, where ![]() is the Debye length when the rear surface begins to expand. The most general solution of Eq. (2) is
is the Debye length when the rear surface begins to expand. The most general solution of Eq. (2) is
where ξx,yσ (k, t) satisfy
and σ labels the independent solutions of Eq. (7). By assuming E f(t) changes slow, and neglecting the oscillating and dumping roots, we look for a Wentzel-Kramers-Brillouin solution of the form
where ![]() , a and k denote the amplitude and circular wavenumber of the perturbation, respectively. Since the solution Eqs. (5), (6) is nonlinear (Ott, Reference Ott1972), we look at a special case for a given k component to consider the solution in more detail
, a and k denote the amplitude and circular wavenumber of the perturbation, respectively. Since the solution Eqs. (5), (6) is nonlinear (Ott, Reference Ott1972), we look at a special case for a given k component to consider the solution in more detail

This solution extends the expanding model by adding a 2D-perturbation to a semi-empirical/analytical 1D solution of Mora (Reference Mora2003). For arbitrary amplitudes, Eqs. (9)–(10) are actually the parametric representation of a cycloid (i.e., the path followed by a point on the surface of a rolling wheel). When t = 0 the rear-side shape of the target is set to
The time evolution of the profile of the ion expanding surface is shown in Figure 1. Apparently, the above analysis is valid for ka < 1. At t = 0, when a is small, the curve is approximately sinusoidal, x ≈ X − a cos (ky); at 0 < t < t*, the sinusoidal shape has become distorted; at t = t* a cusp develops in the curve; and at t > t* the solution Eqs. (9)–(10) are not valid any more because the analytical model breaks down past the cusp. The critical time t* is solved in the following.

Fig. 1. Schematic of the time evolution of the profile of the ion expanding surface.
Now we restrict our analysis to t < t*. From Eqs. (9)–(10), we obtain the ion velocity on the expanding surface (Mora, Reference Mora2003)

where g(t) = q iE f(t)/m i, and ![]() is the ion-acoustic velocity. The transverse velocity on the expanding surface v e,y is shown in Figure 2. Initially, the profile of the transverse ion velocity in the phase space is approximately a sinusoidal wave. With time increasing, the profile becomes more distorted. This means that the ions on the surface are focused to the central axis, which is confirmed by the following analysis.
is the ion-acoustic velocity. The transverse velocity on the expanding surface v e,y is shown in Figure 2. Initially, the profile of the transverse ion velocity in the phase space is approximately a sinusoidal wave. With time increasing, the profile becomes more distorted. This means that the ions on the surface are focused to the central axis, which is confirmed by the following analysis.

The ion density of the expanding surface is dependent on the velocity via the equation of continuity
According to Eq. (13), we have

In the longitudinal direction, it is suitable to describe the expanding process by the one-dimension model. Then the ion density becomes
where n ip = 2n i0/(e(1 + τ2)) is the ion density at the expanding surface for the plane target (Mora, Reference Mora2003), n i0 = n e0/Z is the initial ion density of the sheath. There is a singularity when the denominator is zero. For s = 0, we obtain the critical time t* in the implicit form
This means that the ion density increases dramatically when the evolution time closes to t*.
The increase of the ion density on the central axis of the expanding surface makes the electrostatic field at this point more strong than that off the central axis (confirmed by the PIC simulation in the next section). Ions are pushed by the strong electrostatic field from the central axis of the expanding surface toward the background electrons, then an ion jet is generated, and the surface is broken and a cusp emerges. When the focusing and jet formation of ions come to balance, in the motion frame (moving together with the surface), the expanding ion surface becomes approximately steady, and the ion velocities along the surface should be approximately equal because the electrostatic field is perpendicular to the surface. This assumption is valid when the intensity of laser below relativistic regime, and the plasma could be treated as fluid. Then we predict the maximum longitudinal velocity when t > t*,

where

is the maximum velocity of a planar target.
Simple analytical expressions can be derived from the Eqs. (17) and (18) in the asymptotic limit, τ≫1. In this limit, E f ≈ 2E 0/(ωpit), and ![]() , cosh (Φ(t)) ≃ sinh(Φ(t)) ≃ exp(Φ(t))/2. Then from Eq. (17) and Eq. (18) we obtain the critical time
, cosh (Φ(t)) ≃ sinh(Φ(t)) ≃ exp(Φ(t))/2. Then from Eq. (17) and Eq. (18) we obtain the critical time

and the maximum ion velocity when t > t*

The above analysis is exact valid for the concave cavity shaped as Eq. (11), and it can be applied to other shapes of cavity approximately. As an example, we consider three kinds of special concave targets, circle, parabolic, and triangle, which have been discussed (Okada et al., Reference Okada, Andreev, Mikado and Okubo2006) comprehensively. The cavity are defined as 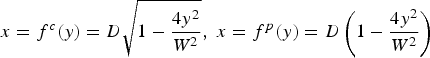 , and
, and ![]() , where f c, f p, f t denote circle, parabolic and triangle cavity, respectively, D is the depth and W is the diameter of the cavity. Now we expand the curve into the Fourier series. We have
, where f c, f p, f t denote circle, parabolic and triangle cavity, respectively, D is the depth and W is the diameter of the cavity. Now we expand the curve into the Fourier series. We have ![]() . Since the long-wavelength components tend to dominate the ion jet at long time (Ott, Reference Ott1972), we analyze the jet generation from the first order term. The first order terms are
. Since the long-wavelength components tend to dominate the ion jet at long time (Ott, Reference Ott1972), we analyze the jet generation from the first order term. The first order terms are ![]() and
and ![]() . It means that there are little differences. Then, we consider the second order terms. Since a 2t = 0, a 2p = −D/π2, and a 2c = DJ 1(2π)/2 ~ a 2p, it is less efficient to generate an ion jet from the rear-side of the trianglar concave target because of the missing second order perturbation. Hence, the maximum ion velocity of the trianglar concave target will be less than the other two kinds of targets. This simple analysis agrees with the simulation results (Okada et al., Reference Okada, Andreev, Mikado and Okubo2006).
. It means that there are little differences. Then, we consider the second order terms. Since a 2t = 0, a 2p = −D/π2, and a 2c = DJ 1(2π)/2 ~ a 2p, it is less efficient to generate an ion jet from the rear-side of the trianglar concave target because of the missing second order perturbation. Hence, the maximum ion velocity of the trianglar concave target will be less than the other two kinds of targets. This simple analysis agrees with the simulation results (Okada et al., Reference Okada, Andreev, Mikado and Okubo2006).
3. PIC SIMULATION
To confirm the above estimates, we carried out our PIC simulations with the 2D3V VORPAL code (Nieter & Cray, Reference Nieter and Cray2004). The schematic drawing of our simulations is shown in Figure 3. In a simulation box of 80 × 30 µm2 with a grid of 8000 × 1500 cells, a y direction linearly polarized laser pulse with central wavelength λ = 1 µm and peak intensity I = 1.38 × 10²⁰ Wcm−2 is incident normal onto a target along the x (axial) direction. The target density is 10n c, where n c = m eε0ω2/q is the critical plasma density, with m e the electron mass, ω = 2πc/λ the laser frequency, and c the velocity of light. The laser has a Gaussian envelope A y ~ A 0 exp [−(ρ/ρ0)2 − (t/T L)2], with spot size ρ0 = 10 µm, and pulse width L = cT L is ranging from 30 µm to 100 µm, where A 0 is the vector potential, T L denotes the laser pulse duration. The front surface of the target is located at x = 30 µm. The origin of the coordinate system is x = 0 µm, y = −15 µm. The transverse and longitudinal boundary conditions are periodic and absorbing, respectively. The target, with 30 µm in width and d = 10 µm in thickness, has a cavity on the rear surface. The geometry of the cavity is given by Eq. (11), where X = 40 µm, 2π/k = 16 µm. At the beginning of simulations, i.e., t = 0, the peak of the laser pulse is at x = −L and reaches the target surface at t 0 = 30λ/c + T L. The ion/electron mass ratio is m i/m e = 1836 and the charge number Z = 1. The transverse and longitudinal boundary conditions are periodic and absorbing, respectively. The initial electron and ion temperatures are assumed to be small and their effects can be ignored. When an ultraintense laser pulse irradiates a plasma target, the temperature of the laser-driven hot electrons T h is found numerically and experimentally to be given by the laser ponderomotive potential (Wilks et al., Reference Wilks, Kruer, Tabak and Langdon1992; Malka & Miquel, Reference Malka and Miquel1996),


Fig. 3. Schematic drawing of the simulation box.
The total number of electrons accelerated into the target is N e = fɛL/T h, where ɛL is the laser energy, and f = 1.2 × 10¹⁵I 0.74 (Wcm2) with saturation of 0.5 is the converted fraction from laser energy to hot electrons (Key et al., Reference Key, Cable, Cowan, Estabrook, Hammel, Hatchett, Henry, Hinkel, Kilkenny, Koch, Kruer, Langdon, Lasinski, Lee, Macgowan, Mackinnon, Moody, Moran, Offenberger, Pennington, Perry, Phillips, Sangster, Singh, Stoyer, Tabak, Tietbohl, Tsukamoto, Wharton and Wilks1998; Feurer et al., Reference Feurer, Theobald, Sauerbrey, Uschmann, Altenbernd, Teubner, Gibbon, Förster, Malka and Miquel1997).
Figures 4 and 5 show that the ion density and the axial electric field E x spatial distribution at t = 90λ/c for a = 1 µm, respectively. In this simulation, the critical time is t* = 83λ/c, and hence, the figure shows the spatial distribution after the critical time. In Figure 5, a strong charge-separation field at the front of the expanding surface is clearly shown. Figure 6 presents the comparison between the electric field E x on the cental axis and that off the central axis. It is shown that the electric field on the central axis is a stronger than that off the cental axis, and the ion expanding surface is distorted by the strong electric field with a singular cusp shown on the central axis. As expected, a forward ion jet emerges from the central axis of the ion expanding surface.

Fig. 4. (Color online) The ion density spatial distribution at t = 90λ/c for a = 1 µm. It is shown that an ion jet is generated.

Fig. 5. (Color online) The axial electric field E x spatial distribution at t = 90λ/c for a = 1μm. A bright thin layer in front of the target denotes the electric field at the ion expanding surface E f.

Fig. 6. (Color online) Comparison of the axial electric field E x at t = 90λ/c for a = 1 µm. The solid (blue) line denotes the electric field on the central axis (y = 0 µm), and the dashed (red) line denotes the electric field off the central axis (y = 3μm).
Figure 7 presents the ion velocity distribution. The left column subfigures (the longitudinal velocity) show that the ions extracted from the rear-side of the target are accelerated forward. The maximum axial velocity of the ions is located at the leading edge of the expanding ion surface on the central axis represented by a sharp peak in left column subfigures. The right column subfigures (the transverse velocity) verify our theoretical analysis in Figure 2. When t = 40λ/c, the transverse velocity distribution shows a sinusoidal wave profile, while when t = 70λ/c, the profile becomes more distorted.

Fig. 7. (Color online) Time evolution and ion phase space distributions of the longitudinal (left column) and the transverse (right column) direction at t = 40λ/c (top row) and t = 70λ/c (bottom row), by simulating a concave target with a = 1μm.
Figure 8 shows the relative ion density n i/n ip as a function of time. The simulation data agree well with the theoretical results Eq. (16). Initially, the relative ion density is about one. In the region of a anticipated asymptotic value of time t max, the relative ion density increases dramatically and closes to a saturation. This means that the focusing and jet formation of ions come to balance, and the forward ion jet will persist for a long time.

Fig. 8. Relative ion density n i/n ip as a function of time for concave target with a = 1 µm. In the region of a anticipated asymptotic value of time t max, the relative ion density increases dramatically and closes to a saturation. The solid line is our analytical predict according to Eq. (16)
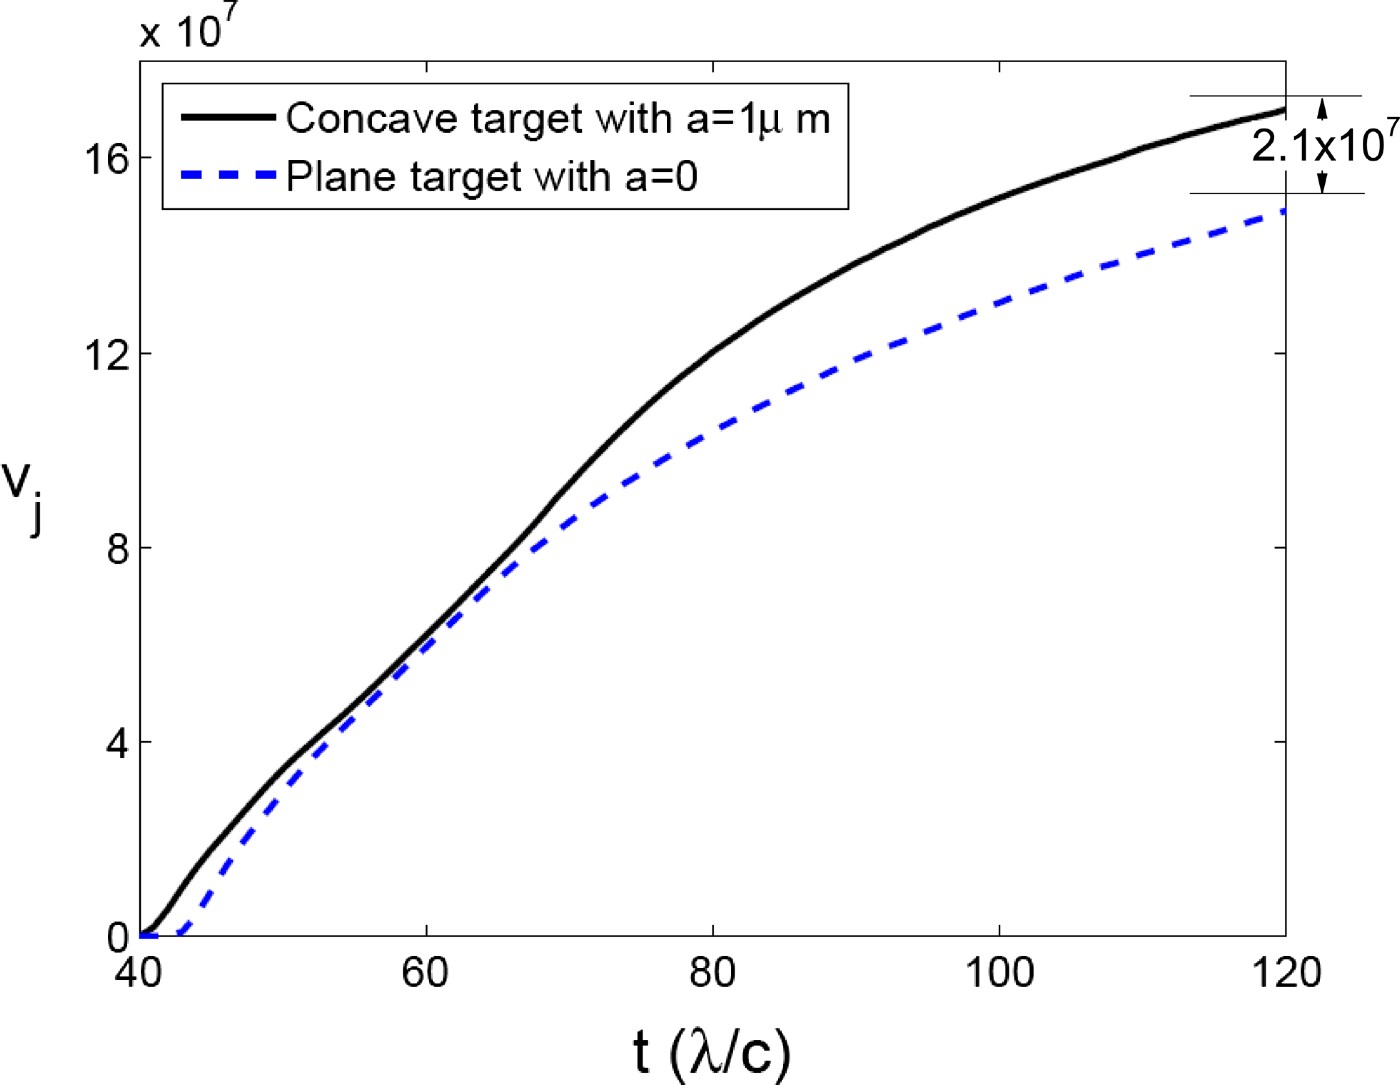
Figure 9 shows the PIC simulation results of maximum ion velocity as a function of time both for a concave target with a = 1 µm and planar target with a = 0. There is a clear indication of the post-accelerating at the time interval (60λ/c,80λ/c). Note that according to our model, when ![]() , the post-accelerated ions form an ion jet. Our model predicts that the velocity difference between the concave and the planar target is about 1.7 × 10⁷ m/s, close to the simulation results 2.1 × 10⁷ m/s.
, the post-accelerated ions form an ion jet. Our model predicts that the velocity difference between the concave and the planar target is about 1.7 × 10⁷ m/s, close to the simulation results 2.1 × 10⁷ m/s.

Fig. 9. The maximum velocity as a function of time for a = 1 µm.
Now we simulate the ion jet generation for different initial perturbation amplitudes a. Figure 10 shows the simulation results of the critical time for different a after irradiation by a plane-wave laser initially located at x = 0. With a increasing, the critical time decreases to t 0. In our simulation, the critical time is marked by the time when n i/n ip exceeds 10. The factor 10 is motivated by the analysis of the results described in Figure 8. Eq. (17) is solved by numerical method and the electrostatic field ![]() is determined by Eq. (1) as an approximation. The results of the simulation and the predicted curve according to Eq. (17) agree very well.
is determined by Eq. (1) as an approximation. The results of the simulation and the predicted curve according to Eq. (17) agree very well.

Fig. 10. The critical time for different aafter irradiation by a plane-wave laser initially located at x = 0. In the simulation, the critical time is marked by the time when n i/n ip exceeds 10. The factor 10 is motivated by the analysis of the results described in Figure 8.
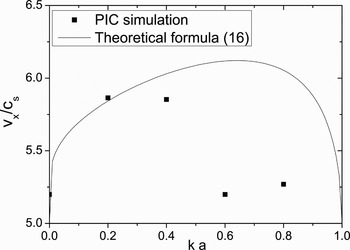
Figure 11 presents the maximum ion velocity for different a. The cut-off acceleration time is assumed to be t = 1.3T L (Fuchs et al., Reference Fuchs, Antici, D'humières, Lefebvre, Borghesi, Brambrink, Cecchetti, Kaluza, Malka, Manclossi, Meyroneinc, Mora, Schreiber, Toncian, Pépin and Audebert2006) with pulse width L = cT L = 100 µm. There is a big difference between our prediction and simulation results when ka ~ 1. The main reason is that, for ka > 0.5, the simulation time is much greater than the jet generation time, and the ion jet will be defocused. This means that, the short-wavelength perturbations have little contribution to the collimated ion jets. Then we can conclude that, ka = 0.5 is the optimal parameter to generate the high collimated ion jet.

Fig. 11. The maximum velocity for different shapes. The effective acceleration time in the calculation is selected as 1.3T L with pulse width L = cT L = 100 μm.
4. CONCLUSION
In this paper, we investigated the interaction of an ultraintense laser pulse and a rear-side concave target using both a theoretical model and PIC simulations. It is shown that the emergence of an on-axis ion jet at the rear-side of the target is accompanied by a distorted, expanding ion surface. This distortion is caused by the strong charge-separation field. We presented a critical time, at which the distortion becomes dramatic with a singular cusp shown on the central axis. Meanwhile, the variation of the transverse ion velocity and the relative ion density diverge on the cusp, signaling the emergence of an on-axis ion jet. We obtained analytical expressions for the critical time and the maximum velocity of the ion jet, and suggested an optimum shape for generating a collimated energetic ion jet. Our PIC simulations support the theoretical analysis. Our results are useful in the design of target used in producing highly collimated energetic ions in high-energy-density physics.
ACKNOWLEDGMENTS
This work is supported by the National Fundamental Research Programme of China (Contact Nos.2007CB815103, 2007CB814800), the National Natural Science Foundation of China (Contact Nos. 10725521, 10875015, 10834008), and the Foundation of CAEP (Contact No. 2006Z0202).