Introduction
Nonlinear optics has become an essential element of modern technologies invoking extensive research in the field (Armani et al., Reference Armani, Shen, Choi, He, Dlep and Soltani2018; Carvalho et al., Reference Carvalho, Kassab, Del Cacho, Da Silva and Alayo2018; Khulbe et al., Reference Khulbe, Parthasarathy and Tripathy2018; Xu et al., Reference Xu, Switkowski, Chen, Liu, Koynov, Yu, Zhang, Wang, Sheng and Krolikowski2018). Optical nonlinearity arises from intense light-induced modifications in optical properties of a material. Response of the material therefore, depends nonlinearly on the strength of applied field. Experimental demonstration of this phenomenon turned out to be possible after the advent of first laser in 1960 when intense light, capable of producing such nonlinearity became a reality. Vast range of potential applications has inspired researchers to further investigate and analyze the outcomes in this field of research. Optical limiting, optical data storage, nonlinear spectroscopy, all optical switching are few of such applications (Sutherland Reference Sutherland2003; Hainfeld et al., Reference Hainfeld, Slatkin and Smilowitz2004; Huang et al., Reference Huang, El-Sayed, Qian and El-Sayed2006; Kim et al., Reference Kim, Jeong and Jon2010; Rumi and Perry, Reference Rumi and Perry2010; Razvi et al., Reference Razvi, Bakry, Afzal, Khan and Asiri2015; Abed et al., Reference Abed, Mostaghni and Shafikhani2016 )
Several physical mechanisms are originated from an intense light–matter interaction (Fang et al., Reference Trtica, Batani, Redaelli, Limpouch, Kmetik, Ciganovic, Stasic, Gakovic and Momcilovic2010; Shaheen and Fryer Reference Shaheen and Fryer2012; Trtica et al., Reference Trtica, Batani, Redaelli, Limpouch, Kmetik, Ciganovic, Stasic, Gakovic and Momcilovic2013) which result in nonlinear behavior of the medium (Kanapathipillai, Reference Kanapathipillai2006; Kumar and Verma, Reference Kumar and Verma2011). Two-photon absorption (TPA) is one of these processes in which two photons are simultaneously absorbed by the medium. In this transition from the ground state to an excited state, an intermediate virtual (not real) state is involved. Nonexistence of a real intermediate state requires a simultaneous absorption of both photons. Nonlinear absorption (NLA) is proportional to square of incident intensity if both photons have the same frequency (belong to a single beam) (Sutherland, Reference Sutherland2003; Rumi and Perry, Reference Rumi and Perry2010). This allows spatial control of excitation within the medium in three dimensions (Rumi and Perry, Reference Rumi and Perry2010). TPA applications include, micro-structuring by TPA polymerization, 3D optical data storage, two-photon photodynamic therapy (Ajami et al., Reference Ajami, Gruber, Tromayer, Husinsky, Stampfl, Liska and Ovsianikov2015).
Ability of a material to allow nonlinearity upon intense light irradiation is suggested by its properties. Measurement of NLA coefficient of a material is essential for realization of TPA applications. Measuring technique which has been employed in this research work is the single beam, open-aperture Z scan technique (Ajami et al., Reference Ajami, Husinsky, Tromayer, Gruber, Liska and Ovsianikov2017). Z scan technique was first introduced by Sheikh-Bahae in 1989 for measurement of nonlinear refraction (NLR) and NLA (Sheik-Bahae et al., Reference Sheik-Bahae, Said and Van Stryland1989, Reference Sheik-Bahae, Said, Wei, Hagan and Van Stryland1990). In open-aperture Z scan technique, a nonlinear medium is scanned along the direction of propagation of laser beam through the focus of the beam. Transmittance is recorded as a function of sample position. Scan starts far away from focus where irradiance is low and absorption is constant. At focus however, sudden increase in absorption (positive nonlinearity) occurs which is shown as a valley in the transmittance curve. Z scan trace can be analyzed to find the type of nonlinearity by employing a theoretical fit. Significance of this technique is its simplicity, cost effectiveness, and sensitivity (Menard et al., Reference Menard, Betz, Sigal and Van Driel2007; Quarterman et al., Reference Quarterman, Tyrk and Wilcox2015; Razvi et al., Reference Razvi, Bakry, Afzal, Khan and Asiri2015; Samuel et al., Reference Samuel, Ensley, Hu, Hagan, Van Stryland and Gaume2015).
This research work focuses on analyzing TPA in the femtosecond regime, in Au-ion irradiated glasses namely, GIL49, BK7, and Glass B. Introduction of metallic ions enhances nonlinear properties in transparent media (Stepanov, Reference Stepanov2011).
Experimental
Three types of glasses namely, GIL49, BK7, and Glass B were used in the current work. All three glasses are of different chemical compositions which have been presented in Table 1. Chemical composition of the glasses differs in terms of concentration variation of monovalent modifiers which affects the extent of crosslinking in the matrix.
Table 1. Glass composition in at%

Samples were cleaned and then implanted with 1700 keV Au+ ions by using a Tandetron 4130 MC accelerator at the Nuclear Physics Institute in Prague, Czech Republic. Ion fluence for all samples was ~1016 ions/cm2. Samples were post annealed at 600°C for 5 h. Purpose of annealing is to initiate reformation and crosslinking within the glasses.
A well-established and accredited open-aperture Z scan technique is used to measure TPA coefficients. A femto-second laser (FEMTOPOWER Compact PRO) has been utilized in the Z scan setup. Pulse duration is measured by using an autocorrelator from “Femto Lasers.” The laser carries average power maxima at 800 mW, a repetition rate of 1 kHz, and 25 fs pulse duration with a Gaussian profile. The wavelength spectrum is centered at 800 nm. A digital power meter is used to measure laser power before each scan. The scans were performed at 30 nJ pulse energy. Laser beam waist radius and Rayleigh range (Z R = kw 02/2) were found to be 11 µm and 0.28 nm, respectively.
Figure 1 shows the experimental scheme of the setup. Laser beam was split in two by using a beam splitter; one part was taken as the reference beam. Other part, with a beam diameter of 15 mm, was focused on the sample by a plano-convex lens with a focal length of 175 mm. Samples were placed on a linear translational stage (Newport) and were scanned for a distance of ±3 mm from the focal point.

Fig. 1. Experimental scheme of Z scan setup.
Reference and transmitted beams were detected using Si diodes (Photodiode 1 and 2 in Fig. 1). A neutral density filter was used to adjust absolute intensity at the diodes. A low-pass filter blocked all unwanted emissions (at Photodiode 2). Data were recorded using a Picoscope from “Picotech.” Data acquisition and sample movement were performed by utilizing National Instruments’ Labview software. This software allowed averaging over several laser shots at each position. Resultant data comprised of normalized transmittance at known sample positions.
We have developed C# based software to perform fitting of experimental data for open-aperture Z scans. This Z scan software generates the theoretical curves by considering experimental specifications for each sample. The software can further be modified to include other nonlinear phenomena such as NLR (for closed aperture Z scan), multiphoton absorption, etc.
Results and discussion
Ion irradiation onto a material initiates a process of energy transfers from ion to the substrate which is strongly influenced by energy of ions and structural density of the medium. Energetic ions collide with target atoms (nuclear stopping) or electrons (electronic stopping). Ion energy transferred to the target by these two processes, results in rapid local temperature rise followed by rapid cooling (Ahmad et al., Reference Ahmad, Rafique, Tahir and Malik2014). Complete stopping of ions involves several other phenomena such as initiation of collision cascades, ionizations of target atoms, evolution of thermal spike defects generation, damage accumulation, melting, shrinkage due to rapid cooling, sputtering at the surface, and structural alterations of the target (replaced and displaced atoms) (Correa et al., Reference Correa, Kohanoff, Artacho, Portal and Caro2012). Stopping and range of ions in matter (SRIM)/Transport of ions in matter (TRIM) simulations have been employed to establish ion range and depth profile within the medium.
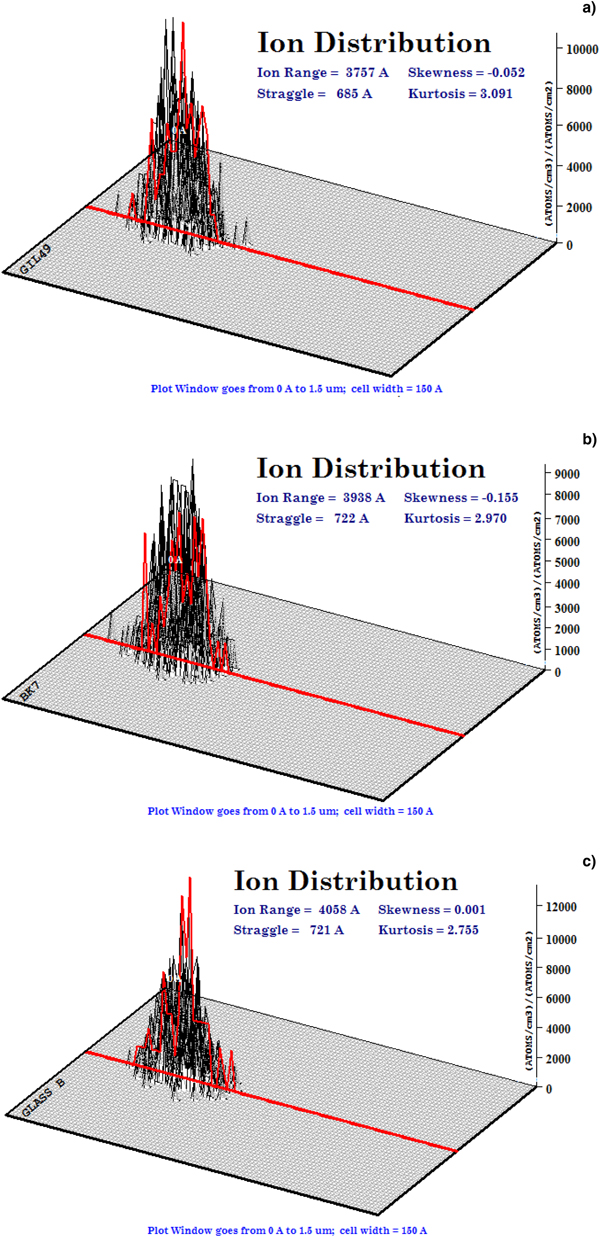
Ion penetration within the substrates is expected after irradiation employing a high-energy ion accelerator. Penetration depth and distribution of Au+ ions having 1700 keV energy within glass substrates were estimated by TRIM simulations. Detailed calculations with full-damage cascades were performed for each sample, taking into account the chemical composition of glass substrates. Figure 2 shows the Au+-ion distributions within (a) GIL49, (b) BK7, and (c) Glass B. Each simulation was performed for 500 ions for a detailed analysis. Ion distributions show the subsurface implantation of metallic ions. Ion straggling is also evident from ion distributions in each sample.

Fig. 2. 3D ion distribution in Au-ion embedded (a) GIL49, (b) BK7, and (c) Glass B obtained by TRIM simulations.
Ions penetrating in a medium cover a specific distance depending upon ion density, medium density, and ion energy. This distance is referred to as stopping range or ion penetration depth. Ion energy (1700 keV in our case) will cause electronic stopping which does not cause deflection. Near stopping range, however, they lose enough energy to start nuclear stopping. Ion trajectory will then involve straggling within the medium. Hence the angular distribution affects the ion penetration depth within medium until complete stopping. Nuclear stopping not only causes deflection in ion path but also initiates target damaging phenomena. These include phonons generation, ionizations, vacancies, and replacement collisions. Values for all these parameters are not reported here as an obvious difference was not observed for all three glasses.
Table 2 shows ion ranges and straggling values acquired from TRIM simulations for each sample. It also accounts for total phonons and total target damage. There is not a big difference in these parameters for all three glasses. It can be concluded from TRIM results that ion penetration parameters are almost the same for the glasses used in this work.
Table 2. Ion range, straggling, total phonons, and total target damage in each sample acquired by TRIM simulation

UV-VIS spectra of all three glasses before and after ion irradiation and annealing did not show one-photon absorption at or around 800 nm. Furthermore, as irradiated samples did not show a recognizable nonlinear response either. Samples were then annealed at 600°C for 5 h, as it was expected to enhance NLA due to reformation and crosslinking within the samples.
TPA measurements of Au-ion irradiated glasses, post annealing, were performed by employing the open-aperture Z scan technique. Normalized transmittance as a function of sample position was recorded. These experimental data were then fitted using Eq. (1) (Ajami et al., Reference Ajami, Husinsky, Liska and Pucher2010):
 $$T(z) = \mathop \sum \limits_{n = 0}^\infty \displaystyle{{{(-q_0)}^n} \over {{(n + 1)}^{3/2}{(1 + x^2)}^n}}$$
where
 $$x = z/z_{\rm R},\;q_{\rm o} = {\beta} L_{{\rm eff}}I_{\rm o},\;L_{{\rm eff}} = (1-{\rm exp}(-{\rm \alpha} _{\rm o}L))/{\alpha} _{\rm o}$$
Here, I o is the maximum on-axis intensity, Z is the sample position, Z R is the Rayleigh length, L eff is the effective sample length, α o is linear-absorption coefficient, and β is the TPA coefficient.
We have developed C# based software which calculates all these parameters to generate T(z) values corresponding to each position (z) . An output excel file is generated containing the position values (experimental) and the normalized transmittance values (calculated). These output files were then used to plot the theoretical curves along with the experimental traces (shown in Fig. 2). Plots of theoretical curves along with the experimental traces for each sample are shown in Figure 3. The best fit data were utilized to extract the TPA coefficient (β).

Fig. 3. (a) Open-aperture Z scan trace of Au ion embedded (a) GIL49, (b) BK7, and (c) Glass B.
The Z scan traces shown in Figure 3 (a) Au ions in GIL49, (b) Au ions in BK7, and (c) Au ions in Glass B are typical TPA curves and they have been perfectly fitted using Eq. (1). This equation represents pure TPA. Modeling of this equation assumes negligible excited state absorption, three photon and higher order absorption. A perfect fit confirms the occurrence of TPA. At intensity maxima, there will be maximum absorption and as we move away from focus, it rapidly reduces on both sides of the scan. Au ions embedded BK7 have lowest normalized transmittance value of 0.928 at intensity maxima (Z = 0). In cases of GIL49 and Glass B, lowest normalized transmittance values are 0.96119 and 0.97885, respectively. TPA coefficients extracted using Z scan software for these samples are as follows: for Au ions in GIL49 it is 7.72 cm/GW, Au ions in BK7 has the largest value of 16.3 cm/GW, and Au ions in Glass B it is 5.25 cm/GW.
Figure 4 is a chart showing ion ranges and TPA coefficients for three glasses. Minor change in ion ranges can be observed. Largest TPA absorption coefficient was found in BK7.

Fig. 4. Chart showing comparison of ion ranges and TPA coefficients for Au ion embedded, GIL 49, BK7, and Glass B.
In the femtosecond regime, nonlinear optical absorption is enabled by TPA-induced surface plasmon resonance (SPR). SPR are the collective electromagnetic modes. Photon energy is absorbed by electrons inducing thermally nonequilibrium distribution. Electron–electron interactions then lead to thermalization of electronic distribution in a time frame of a few hundred femtoseconds. These heated electrons then transfer their energy to lattice by means of electron–phonon interaction in the time frame of a few picoseconds. Energy thermalization continues by phonon–phonon interactions. Thermal expansion of surrounding medium is then released causing complete recovery of the system (Link and El-Sayed, Reference Link and El-Sayed2000; Stepanov, Reference Stepanov2011; Almeida et al., Reference Almeida, Almeida, Boni and Mendonça2015). Annealing the samples initiates a reformation and crosslinking of the glass matrix.
Chemical composition of the host glass is an important parameter in crosslinking of embedded ions. Glass transition temperature (T g) for these glasses are in the following order: BK7 < GIL49 < Glass B (Svecova et al., Reference Svecova, Nekvindova, Stanek, Vytykacocva, Mackova, Malinsky, Miksova, Janecek, Pesicka and Spirkova2017). T g for BK7 (560°C) is lower than annealing temperature. It can be expected to go through melting and rearrangement with highest crosslinking and new bond formation. This can be the reason for the highest TPA coefficient in BK7 as nonlinear properties of SPR are known to be enhanced by increasing the filling factor of embedded medium.
Conclusion
TPA coefficients were extracted for Au embedded glasses from Z-scan traces. Highest TPA coefficient (16.3 cm/GW) corresponds to Au-embedded BK7. There is no significant change in ion range, straggling, and total target damage with the change in the substrate composition. Difference in TPA coefficient is only caused by extent of crosslinking (attributed to post annealing) which strongly depends on chemical composition and structure of the glass substrate.