


Introduction
Laser-driven ion acceleration is an active and developing field that promises high-flux and high energy ion sources for basic plasma physics and other applications (Fuchs et al., Reference Fuchs, Antici, d'Humières, Lefebvre, Borghesi, Brambrink, Cecchetti, Kaluza, Malka, Manclossi, Meyroneinc, Mora, Schreiber, Toncian, Pépin and Audebert2006; Daido et al., Reference Daido, Nishiuchi and Pirozhkov2012; Macchi et al., Reference Macchi, Borghesi and Passoni2013). Research focuses on the development of different acceleration mechanisms, such as target normal sheath acceleration (TNSA), radiation pressure acceleration, and breakout afterburner (or transparency-enhanced acceleration) to achieve high energies. These mechanisms have resulted in the acceleration of protons to energies of the order of 100 MeV, especially in ultrathin foils (Kim et al., Reference Kim, Pae, Choi, Lee, Kim, Singhal, Sung, Lee, Lee, Nickles, Jeong, Kim and Nam2016; Higginson et al., Reference Higginson, Gray, King, Dance, Williamson, Butler, Wilson, Capdessus, Armstrong, Green, Hawkes, Martin, Wei, Mirfayzi, Yuan, Kar, Borghesi, Clarke, Neely and McKenna2018). Nevertheless, TNSA from micron-thick targets remains interesting due to advantages such as ease of implementation for high repetition rate operation.
There are two main methods to increase the maximum proton energy (the “cut-off” energy), which are related to each other. The first focuses on enhancing the laser-to-plasma energy coupling by using micro- and nano-structures on the front surface of the target. Klimo et al. (Reference Klimo, Psikal, Limpouch, Proska, Novotny, Ceccotti, Floquet and Kawata2011) and Andreev et al. (Reference Andreev, Platonov, Braenzel, Lübcke, Das, Messaoudi, Grunwald, Gray, McGlynn and Schnürer2016) showed that structures with a periodicity of the order of the laser wavelength are necessary for effective absorption. Surface structures, such as micro-particles (Floquet et al., Reference Floquet, Klimo, Psikal, Velyhan, Limpouch, Proska, Novotny, Stolcova, Macchi, Sgattoni, Vassura, Labate, Baffigi, Gizzi, Martin and Ceccotti2013; Zigler et al., Reference Zigler, Eisenman, Botton, Nahum, Schleifer, Baspaly, Pomerantz, Abicht, Branzel, Priebe, Steinke, Andreev, Schnuerer, Sandner, Gordon, Sprangle and Ledingham2013), nano-particles (Margarone et al., Reference Margarone, Klimo, Kim, Prokůpek, Limpouch, Jeong, Mocek, Pšikal, Kim, Proška, Nam, Štolcová, Choi, Lee, Sung, Yu and Korn2012; Bin et al., Reference Bin, Ma, Wang, Streeter, Kreuzer, Kiefer, Yeung, Cousens, Foster, Dromey, Yan, Ramis, Meyer-ter-Vehn, Zepf and Schreiber2015), bacteria (Dalui et al., Reference Dalui, Kundu, Trivikram, Rajeev, Ray and Krishnamurthy2014), foam (Prencipe et al., Reference Prencipe, Sgattoni, Dellasega, Fedeli, Cialfi, Choi, Kim, Janulewicz, Kakolee and Lee2016), and surface patterning (Ceccotti et al., Reference Ceccotti, Floquet, Sgattoni, Bigongiari, Klimo, Raynaud, Riconda, Heron, Baffigi, Labate, Gizzi, Vassura, Passoni, Kveton, Novotny, Possolt, Prokupek, Proska, Psikal and Stolcova2013) have been used as methods to increase ion energy and flux in laser-driven ion acceleration. This approach benefits from developments in target engineering and surface machining techniques. For example, the use of chemical etching, controlled direct laser writing, and 3D printing allows the formation of highly repeatable large area samples with different types of structures (Kulcsar et al., Reference Kulcsar, AlMawlawi, Budnik, Herman, Moskovits, Zhao and Marjoribanks2000; Golosov et al., Reference Golosov, Ionin, Kolobov, Kudryashov, Ligachev, Makarov, Novoselov, Seleznev, Sinitsyn and Sharipov2011; Mondal et al., Reference Mondal, Chakraborty, Ahmad, Carvalho, Singh, Lad, Narayanan, Ayyub, Kumar, Zheng and Sheng2011; Georgobiani et al., Reference Georgobiani, Gonchar, Osminkina and Timoshenko2015; Ebert et al., Reference Ebert, Neumann, Abel, Schaumann and Roth2017; Ionin et al., Reference Ionin, Kudryashov and Samokhin2017).
The second approach is to increase the laser pulse intensity. Numerous particle-in-cell (PIC) simulations of laser pulse interaction in the relativistic regime (when the peak laser intensity exceeds 1018 W/cm2, for laser light with wavelength close to 1 µm) suggest that the laser absorption and particle acceleration can be enhanced by using sub-wavelength gratings, cones, nanowires, and nanotubes (Purvis et al., Reference Purvis, Shlyaptsev, Hollinger, Bargsten, Pukhov, Prieto, Wang, Luther, Yin, Wang and Rocca2013; Ji et al., Reference Ji, Snyder, Pukhov, Freeman and Akli2015; Andreev et al., Reference Andreev, Platonov, Braenzel, Lübcke, Das, Messaoudi, Grunwald, Gray, McGlynn and Schnürer2016; Jiang et al., Reference Jiang, Ji, Audesirk, George, Snyder, Krygier, Poole, Willis, Daskalova, Chowdhury, Lewis, Schumacher, Pukhov, Freeman and Akli2016).
Merging these two methods in experiments for optimizing the particle source is challenging due to the need for high laser pulse temporal-intensity contrast. If the pulse is sufficiently intense, the pedestal and any pre-pulses ahead of the main laser pulse can destroy the target surface structures, leading to pre-plasma formation. This in turn modifies, and potentially nullifies, the effect of the structure during the intense laser–solid interactions. This pre-plasma formation can be suppressed by using a contrast enhancement technique, such as a cross-polarized wave or plasma mirror (Purvis et al., Reference Purvis, Shlyaptsev, Hollinger, Bargsten, Pukhov, Prieto, Wang, Luther, Yin, Wang and Rocca2013; Andreev et al., Reference Andreev, Platonov, Braenzel, Lübcke, Das, Messaoudi, Grunwald, Gray, McGlynn and Schnürer2016). This can improve the contrast ratio (the ratio of the normalized peak intensity of the main to the amplitude of the pre-pulse/pedestal) to up to 1010 and higher. This has been demonstrated on experiments with very short pulse (tens of femtoseconds) lasers, utilizing nanograss/nanorods (Golosov et al., Reference Golosov, Ionin, Kolobov, Kudryashov, Ligachev, Makarov, Novoselov, Seleznev, Sinitsyn and Sharipov2011; Georgobiani et al., Reference Georgobiani, Gonchar, Osminkina and Timoshenko2015), gratings (Ji et al., Reference Ji, Snyder, Pukhov, Freeman and Akli2015), and carbon nanotubes (Jiang et al., Reference Jiang, Ji, Audesirk, George, Snyder, Krygier, Poole, Willis, Daskalova, Chowdhury, Lewis, Schumacher, Pukhov, Freeman and Akli2016).
Here, we present an experimental investigation of particle acceleration driven by relativistically intense, high-contrast, picosecond laser pulse interaction with targets with a Si micron-scale surface structure. The underpinning physics is interpreted using a modified 2D PIC code (Germaschewski et al., Reference Germaschewski, Fox, Abbott, Ahmadi, Maynard, Wang, Ruhl and Bhattacharjee2016).
Experimental set up and the results
The experiment was performed at the Vulcan Petawatt (PW) laser facility at the Rutherford Appleton Laboratory, UK (Danson et al., Reference Danson, Brummitt, Clarke, Collier, Fell, Frackiewicz, Hawkes, Hernandez-Gomez, Holligan, Hutchinson, Kidd, Lester, Musgrave, Neely, Neville, Norreys, Pepler, Reason, Shaikh, Winstone, Wyatt and Wyborn2005). The Vulcan PW laser uses optical parametric, chirped pulse amplification (OPCPA) technology to generate a beam of laser light at a central wavelength of 1054 nm and in a pulse with full-width-half-maximum equal to ~1.0 ps. The OPCPA technology enables a peak-to-pedestal intensity contrast ratio exceeding 109. To ensure that the main pulse interacted with an initially undisturbed, cold target, a plasma mirror was used to increase the contrast ratio to 1011 (Dover et al., Reference Dover, Palmer, Streeter, Ahmed, Albertazzi, Borghesi, Carroll, Fuchs, Heathcot, Hilz, Kakolee, Kar, Kodama, Kon, MacLellan, McKenna, Nagel, Neely, Notley, Nakatsutsumi and Najmudin2016).
The typical laser pulse energy measured before the compressor was 600 ± 30 J. The efficiency of the beam energy delivery after the laser compressor, f/3 off-axis parabolic mirror and plasma mirror was 50%, resulting in 300 ± 30 J of energy on target. The p-polarized laser was focused on a 7 µm focal spot at 45° incidence to the target normal, as shown in Figure 1. The central focal spot was evaluated to contain 30% of the laser energy, resulting in a calculated intensity of (2.3 ± 0.2) × 1020 W/cm2.

Fig. 1. Schematic of the experiment. The laser pulse is reflected by the plasma mirror onto the target. The X-ray flux is measured using the FSSRs at the target front (irradiated) side and the accelerated particles are measured at the target rear side using an RCF stack.
Two types of targets were used: solid Si foils with thickness between 0.5 and 20 µm, and Si targets with micron-scale surface structures composed of Si “wires” with diameters of about 3 µm and periodic separation of 2 µm. This target is illustrated in Figure 2c. These micro-structured targets were fabricated using a Si semiconductor-based technique (Spindloe et al., Reference Spindloe, Arthur, Hall, Tomlinson, Potter, Kar, Green, Higginbotham, Booth and Tolley2016). The micro-structured targets consist of two Si layers separated by an oxide layer. This enables separate etching of each surface. The “wires” are etched into the front surface and the back surface is etched away to form a 500 µm diameter cavity. The exposed oxide layer is then removed.

Fig. 2. (a) White light interferometric image of the structures projected in 3D, (b) scanning electron microscopy image (50° from the top) of part of the nanowire target; and (c) sketch of the target microstructure with dimensions.
The beam of TNSA-protons was measured using a multilayer stack of HDV2 and EBT3 radiochromic film (RCF). The RCF layers were interspersed by 1 mm-thick Al and 0.1–0.9 mm-thick Mylar (C10H8O4) sheets. The stack was installed 50 mm from the target and aligned along the target normal. Proton spectra were obtained from the scanned RCF using the algorithm described in Schollmeier et al. (Reference Schollmeier, Geissel, Sefkow and Flippo2014). The analysis accounts for effects that cause the reduced RCF response near the Bragg peak. SRIM (The Stopping and Range of Ions in Matter) (Zigler et al., Reference Zigler, Eisenman, Botton, Nahum, Schleifer, Baspaly, Pomerantz, Abicht, Branzel, Priebe, Steinke, Andreev, Schnuerer, Sandner, Gordon, Sprangle and Ledingham2013) data tables and a ray-tracing code were used to follow the one-dimensional propagation of a single proton through the stack until all energy is deposited. RCF scans are loaded into the code one sheet at a time. The code uses linear interpolation between RCF layers to unfold the spectrum in an iterative process, starting at the back sheet. The calibration error is ~15% (Millington et al., Reference Millington, Carroll and Green2015). The extracted proton spectra from flat-surfaced and micron-scale structured surface targets are shown in Figure 3. The proton cut-off energies are shown in Figure 4.
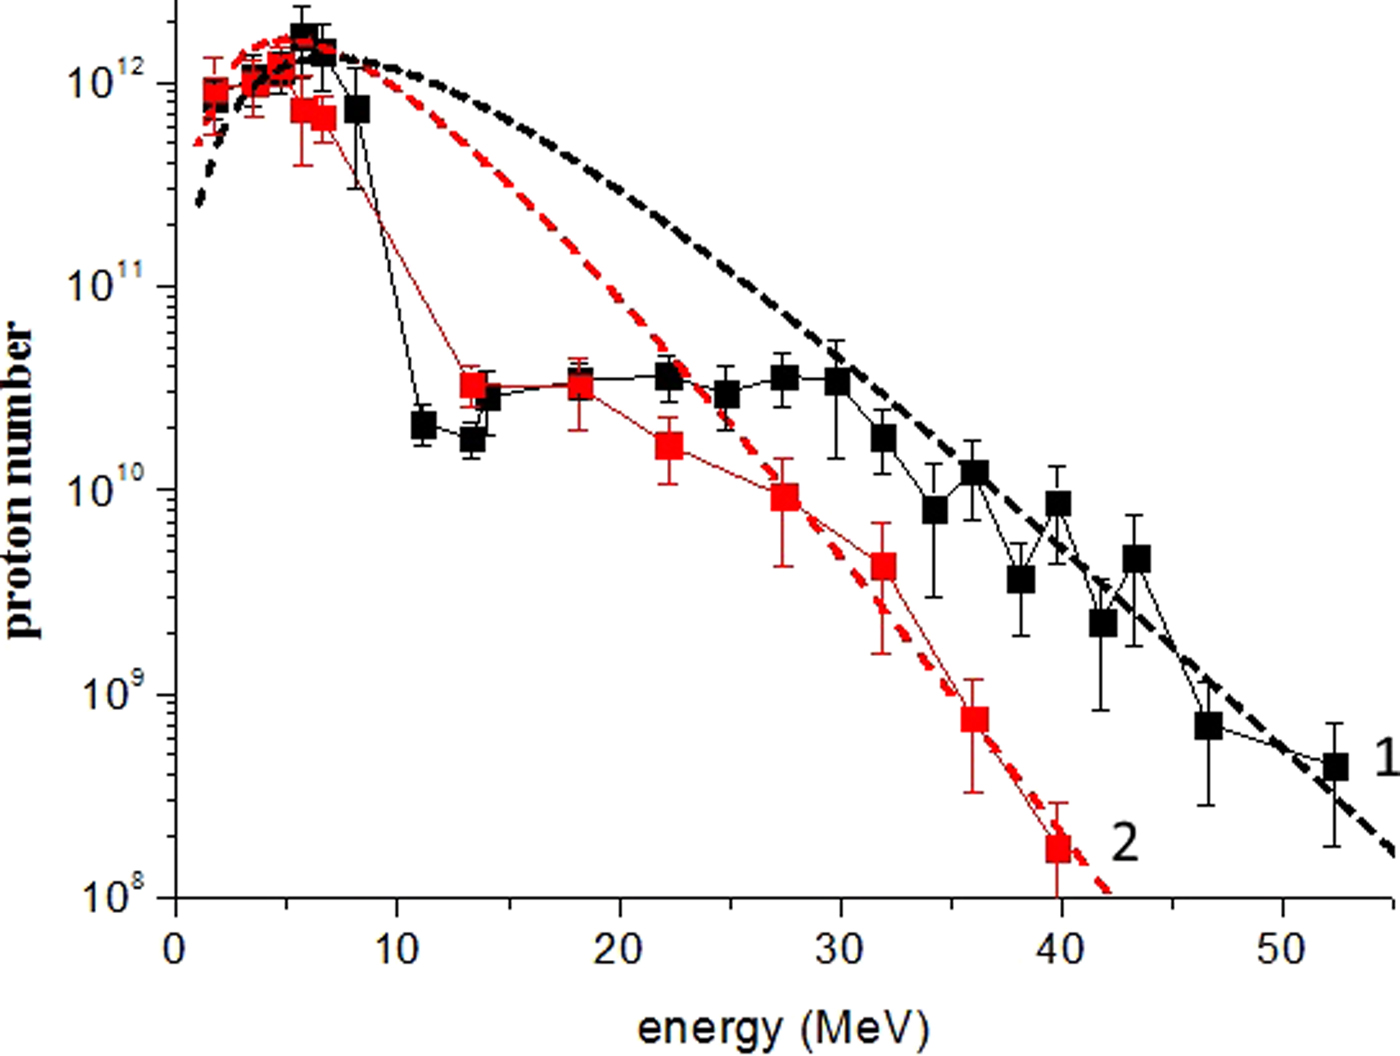
Fig. 3. Si proton spectra measured using Vulcan laser pulses with intensity (2.3 ± 0.2) × 1020 W/cm2. Black squares correspond to the flat target; red circles correspond to the structured target. Lines 1 (black) and 2 (red) correspond to a Boltzmann distribution approximation with T = 4 MeV, N = 6 × 10¹⁵ for the black line and T = 3.2 MeV, N = 2 × 10¹⁵ for the red line.

Fig. 4. (a) X-ray yield integrated over the energy range 1.7–2.7 keV (4.75–7.4 Å) and (b) proton cutoff energy as a function of the thickness of Si flat (black squares) and micro-structured (red circle) targets. The blue line corresponds to an analytical estimate of the proton cut-off energy as a function of the laser pulse and target parameters.
We averaged over three measurements for the case of the structured-surface targets. For the flat targets, we found that the target thickness only affects the proton cut-off energy. All flat target shots resulted in similar spectra. An average of 14 measurements of the flat targets is shown in Figure 3. The errors are the result of uncertainties in the RCF calibration and statistical variations across the averaged measurements. We assume the experimental data can be represented by a Boltzmann distribution f(E) = (N/E)·exp(−E/T), where N and T are the proton number and temperature, respectively. The best fit results in T = 4 MeV and N = 6 × 10¹⁵ for the flat targets and T = 3.2 MeV, N = 2 × 10¹⁵ for the structured surface targets. At the experimental intensities (2.3 × 10²⁰ W/cm2 and 1 µm wavelength) the Wilks' formula T hW ≈ 511 × ((1 + 0.73·I 18λ2)1/2−1) gives the electron temperature of 4.6 MeV. This is comparable to our fitting curve of T for the flat target.
Figure 3 shows differences in the spectra between the two targets. There is a reduction in both the total dose and cut-off energy for the structured surface target in comparison with the flat one. PIC simulations, discussed later, indicate that is because the structured surface is not optimized for proton acceleration. We find that the most energetic protons originate from the surface “wires” and move along the wire surface normal and parallel to the target surface. Also, we could see that the Boltzmann distribution is comparable with the experimental results in the low (below 10 MeV) and high (above 30 MeV) energy ranges. Between these two ranges, noticeable dips in the proton spectra are observed. A possible explanation for these dips will be given in the next section.
X-ray emission from the target was recorded using a focusing spectrometer with spatial resolution (FSSR) in the directions close to the target surface normal at the front side of the target. In order to obtain the spectra with high spectral resolution (λ/δλ ~ 5000) and in a broad spectral range, three FSSRs equipped with spherically-curved quartz crystals were installed to view each side of the target and aligned to ensure continuous wavelength coverage from 4.75 to 7.4 Å. Spherically bent quartz crystals of 1010 and 1011 crystallographic orientation (2d = 8.512 and 6.666 Å, respectively) were used. The spectrometers were cross-calibrated to ensure that the spectral intensities were directly comparable.
The spectra were recorded using Fujifilm TR Image Plate detectors and an Andor DX434 CCD camera. These detectors were protected against exposure to visible light and soft X rays by two layers of 1 µm thick polypropylene (C3H6)n with 0.2 µm Al coating, or 25 µm thick beryllium window. Additionally, to reduce the saturation of the detectors, Mylar filters of thickness between 1 and 20 µm were needed. The choice of thickness depended on the laser energy and target thickness of each experimental shot. Background fogging and crystal fluorescence due to intense fast electrons was limited using a pair of 0.5 T neodymium-iron-boron permanent magnets with a 10 mm-wide slit in front of each crystal.
The main difference between the spectra recorded from flat and structured surface targets is in the intensity; the spectra shapes are similar. The integrated X-ray intensity between 4.75 and 7.4 Å as a function of the target thickness is shown in Figure 4a for shots with energy equal to ~580 J. Each data point is an average of a number of shots, with the error bars indicative of the analysis uncertainties and shot-to-shot variations. Detailed analysis and interpretation of the spectra will be given in a separate article. Data from the flat targets are shown as black squares and compared with a single point from the structured surface targets, red circle. The structured target is matched to a 9 µm thick flat target. Figure 4b shows the proton cutoff energy as a function of target thickness.
The flat-surfaced Si targets integrated X-ray yield increases linearly with target thickness. The structured surface targets result in a near threefold increase in X-ray yield compared with a flat target with the same effective thickness, while the proton cut-off energy is similar. The data in Figure 4b are compared with an analytical model of proton cut-off energy developed by Andreev and Platonov (Reference Andreev and Platonov2011). This model shows the hot electron concentration is inversely proportional to the target thickness: n eh ~ d −1. The model shows a weak dependence of proton cut-off energy as a function of the target thickness, which broadly agrees with measurement.
Interpretation of the experimental results
We use 2D PIC simulations using the modified code Plasma Simulation Code (PSC) (Germaschewski et al., Reference Germaschewski, Fox, Abbott, Ahmadi, Maynard, Wang, Ruhl and Bhattacharjee2016) to aid the interpretation of the experimental results. PIC calculations for Si11+ structured and flat targets were performed. The structured targets consisted of a 3 µm-thick substrate, 10 µm high, and 2 µm wide wires, with 4 µm center-to-center separation. As experimental measurements and one-dimensional PIC calculations show that there is no significant difference in the proton spectra for flat targets with thickness between 2 and 20 µm, the 2D simulations for flat targets used a 3 µm-thick target. The rear surface of the target was covered with a 40 nm layer of hydrogen with a density equal to 1 g/cm3. The laser focal spot was 14 µm diameter and 660 fs full width at half maximum duration, and intensity was 2 × 10²⁰ W/cm2. The pulse had a rectangular profile in both spatial and temporal directions. The spatial cell size was 2 nm and the initial plasma temperature was 20 eV. Each grid cell contained 30 macro-particles of each species. The PSC code automatically weighs the charge of the macro-particles to achieve quasi-neutrality. The laser was incident at an angle of 45° to target normal. Numerical heating was minimal and monitored by recording the energy of particles far from the laser spot (near the box boundaries). We performed PIC simulations up to 300 fs in a 50 × 50 µm sized simulation box with periodic boundary conditions. Beyond this timescale, the PIC simulations become inconsistent. These simulations show qualitative differences between the flat and structured targets. At late times electrons at the boundaries return to the interaction region, leading to an additional and unrealistic target heating. Increasing the box size, while maintaining a small cell size (to limit numerical heating), was not possible with the available computational resources.
Figure 5 shows Si (black) and H (blue) ion-density distributions for the structured surface (a) and flat (b) targets at the end of the simulation (after 300 fs). The proton distribution in the flat target appears to be more inhomogeneous.
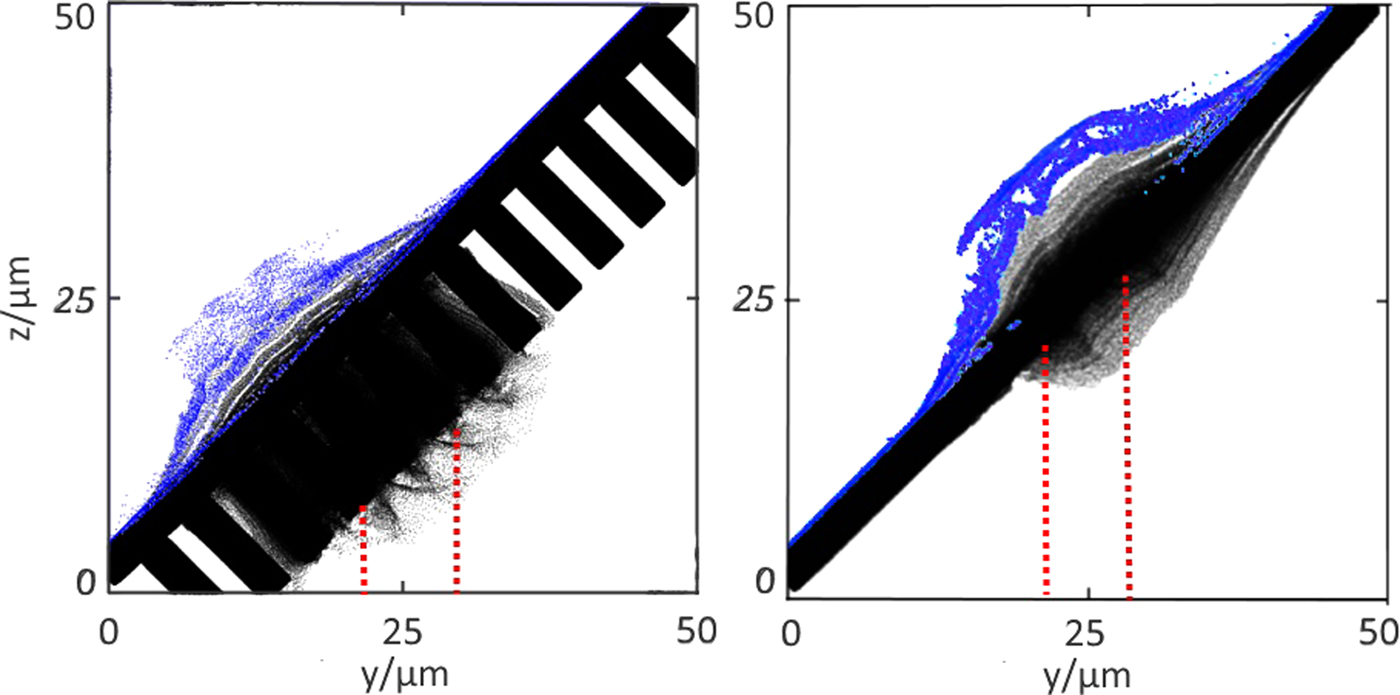
Fig. 5. Si (black) and H (blue) ion-density distribution in the relief (a) and flat (b) targets at a fixed time of 300 fs. Red dotted lines schematically show the trajectory of the laser pulse.
The characteristic energy distribution functions of the electrons and protons in the PIC simulations for the plane (black curve) and structured surface (red curve) targets are shown in Figure 6a, 2b, respectively.

Fig. 6. Electron (a) and proton (b) spectra of a flat (black dots) and a relief (red dots) target flying into the detector angle (±5° from target normal). For comparison, the experimental data of the proton distribution are plotted by the red circles and black squares.
In Figure 6a we fit a two-temperature Maxwell distribution f(E) = N c·2·E 0.5·(π·T c3)−0.5·exp(−E/T c) + N h·2·E 0.5·(π·T h3)−0.5·exp(−E/T h), where T h,c and N h,c, are the temperature and number of the hot and cold electrons, respectively, to the high energy part of the electron spectra. For the flat target this yields T h = 7 ± 0.5 MeV, T c = 0.5 ± 0.1 MeV (T h/T c = 14), N h = 2.2 ± 0.2 × 10¹², N c ≈ 5.0 ± 0.2 × 10¹³, and for the structured target T h = 8 ± 0.5 MeV, T c = 0.7 ± 0.1 MeV (T h/T c = 11), N h = 3 ± 0.4 × 10¹², N c ≈ 5.0 ± 0.2 × 10¹³. The proton energy distributions in Figure 6b are comparable with the experimental spectra.
The PIC simulations show that the differences between proton emission from the flat and structured surface targets result from the fast electron propagation. Figure 7 shows the angular distribution of electrons with energy ≥0.5 MeV from flat and surface-structured targets at the time of 100 fs in the PIC simulations. Zero degree corresponds to the direction along laser axis. In a flat target, with increasing laser intensity electrons tend to move in the direction of laser beam axis (the z-axis in Fig. 5), deviating from the target normal in the corresponding direction. With the surface structured target, the majority of electrons propagate along the wires and, as a result, along the surface normal to the target. As we can see from Figures 6a and 7a, compared with the flat target, the structured-surface target generates more hot electrons, with a more uniform angular distribution. We can estimate the intensity of the ambipolar (sheath) field E am that accelerated ions as the ratio of the energy of hot electrons T h to its Debye radius r Dh = (T h/4·π·n eh·e 2)0.5. Therefore the E am estimation is written as E am ~ (T h·n eh)0.5 , where n eh is the density of the hot electrons. The relief target has a higher electron temperature T h, but also a larger volume (surface area of localization of the fast electrons). As a result, the density of hot electrons for the relief target turns out to be lower and the product of the ambipolar field, T h·n eh, also turns out to be lower. Thus, a decrease in the proton cut-off energy in the relief target at higher electron temperature is due to the large volume of the hot electron localization on which the absorbed energy is distributed.

Fig. 7. Angle distribution in the surface structured (red) and flat (black) targets for the (a) electrons above 0.51 MeV at the time moment 100 fs. (b) Protons above 0.5 MeV at the time moment 300 fs. Emissivity angle is counted from the axis of the laser pulse. The points above the X axis correspond to particles with positive momentum, the points lying below the X axis accordingly correspond to particles with negative momentum.
Note that Figure 6a exhibits a two-temperature distribution of electrons with a cold temperature T c ~ 0.5–0.7 MeV, and temperature ratio T h/T c ≈ 11. According to Bezzerides et al. (Reference Bezzerides, Forslund and Lindman1978), this temperature ratio (T h/T c > 10) leads a violation of the monotonicity of the proton spectrum and the formation of dips visible in Figure 3. Kemp and Ruhl (Reference Kemp and Ruhl2005) also found that the influence of the front of the accelerated Si ions also lead to a dips in the proton spectrum. Also note, that non-monotonicity is observed both in numerical calculation and experiment.
As observed in Figure 7b, the simulations indicate that there is an angular difference in the maxima of the proton angular distribution from the rear side of the surface structured and flat targets. This difference is due to the different direction of the electron flow in the surface-structured (along the rear surface normal) and flat (along the laser axis) targets in Figure 7a. The flat target has a higher anisotropy in the electron distribution, and a distribution maximum close to the direction of the laser beam axis. The angular distribution from the flat target has at least two peaks, while the structured surface targets show a narrower single peak in the angular distribution. The appearance of such peaks in the proton angular distribution was noted in Zepf et al. (Reference Zepf, Clark, Beg, Clarke, Dangor, Gopal, Krushelnick, Norreys, Tatarakis, Wagner and Wei2003). Brambrink et al. (Reference Brambrink, Schreiber, Schlege, Audebert, Cobble, Fuchs, Hegelich and Roth2006) showed that the increase in the width (spreading) of the angular distribution occurs due to the curvature of the back surface of the target during its expansion. There is evidence for this in Figure 5b, where it is seen that the flat target is more strongly distorted compared with the structured surface target (Fig. 7a). The use of surface structures provides some control of the angular distribution of accelerated protons.
Figures 8 and 9 show indicative experimental images of the ion distributions from flat (a) and structured-surface (b) targets. These images are from the second (Fig. 8) and 10th (Fig. 9) layer of the RCF stack and result from protons with energy above 3.5 and 30 MeV, respectively.

Fig. 8. Indicative RCF images from (a) flat and (b) structured targets from the second layer of the RCF stack. These measurements are sensitive to protons with energies above 3.5 MeV.

Fig. 9. As in Figure 8 and the 10th layer in the RCF stack. These measurements are sensitive to protons with energies above 30 MeV.
The images in Figure 8 suggest a near uniform angular distribution with a wider angular ion emission from the flat foils. This agrees with simulations, e.g., Figure 7b, but there is no evidence for the presence of separate peaks in the angular distribution. This may be due to the fact that the RCF stack is a time-integrated diagnostic, while in Figure 7 we show a temporal snapshot at 300 fs. Using the data in Figure 8, we estimate the spot radius for the flat targets to be 14 ± 3 mm and the half-width angular divergence to be 16 ± 3°, and for the structured surface target these parameters are 9 ± 2 mm and 11 ± 2°, respectively. The simulated angular divergence can be estimated from Figure 7b and the full half-width is equal to 13° and 9° for the flat target and structured-surface target, respectively. Performing the same calculations for the protons with energies above 30 MeV, we obtain from Figure 9 the half-width angular divergence of 9 ± 2° for the flat target and 4.5 ± 1° for the structured-surface target. From the PIC calculations, in this case, we estimate the full half-width to be ≈8° and 4° for the flat target and structured-surface targets, respectively. It is interesting to note that the divergence measurements almost match and that the PIC simulation ran to 300 fs, while the laser pulse had a picosecond duration. This could be explained as follows. First, the proton angular divergence is associated with the shape (density profile) of the target rear surface during the acceleration process. The maximum acceleration rate occurs at a sharp target-vacuum boundary. Due to the action of the sheath field, the target rear side begins to blur and distort. This leads to a decrease in the efficiency of proton acceleration. Comparison of the angular distribution of protons with energies above 30.2 MeV (in Fig. 9) and above 3.5 MeV (in Fig. 8) confirms this. Proton spots with energies above 30.2 MeV for a structured and flat target are much smaller (spot radius is about 8 mm for the flat target and 4 mm for the micro-structured target) than the same proton spots with the energy above 3.5 MeV. The comparison between Figures 8 and 9 also shows that the micro-relief has a stronger focusing effect on high-energy protons. The relative size of the spots in Figure 9 (0.5) is substantially smaller than in Figure 8 (0.78). Thus, the angular divergence of the proton beam depends on several factors: the laser pulse intensity and incident angle, ion mass, target, and hydrogen layer thicknesses. Accurate consideration the influence of these factors and choice of adequate time for the PIC-simulation in order to combine the calculated and experimental data requires an additional study.
Thus, both PIC simulation and experiment show that a target with a micro-relief has a high absorption coefficient and higher energy of hot electrons even for picosecond pulses, leading to degradation of the relief at the end of the laser pulse. Experimentally, this is expressed in higher X-ray yield (~2.5 times) of a relief target compared with a flat target of the same mass. At the same time, an increase in absorption does not lead to an increase in proton energy, since the absorbed energy is distributed over a larger phase volume, which reduces the proton accelerating ambipolar field.
Conclusion
We investigated the influence of micro-structuring of the target irradiated surface on the maximum energy of protons accelerated by a picosecond duration laser pulse. In this case, nanostructures are not applicable due to its rapid degradation (Andreev et al., Reference Andreev, Kumar, Platonov and Pukhov2011). The micro-relief has longer lifetime and is maintained for most of the laser pulse, which justifies its use for picosecond pulses. As a result, it was found that the absorption and X-ray emission of the relief target is higher, compared to the flat target, but the proton cut-off energy does not increase. The maximum registered proton cut-off energy for a structured target is 40 MeV, and for a flat target, 5 µm thick (the same mass for a relief target per unit area) is 53 MeV. This is due to the fact that laser absorption occurs in microfilaments, electrons propagate along the normal to the filaments, and, accordingly, parallel to the target surface. Thus, for the case of a relief target, the cloud of hot electrons is distributed over a larger surface compared with the case of a flat target. Although the energy of the hot electrons for the relief target is higher, their density turns out to be lower than that observed with the flat target. As a result, the ambipolar field accelerating the protons is weaker and there was no gain in proton energy. Therefore, the micro-relief can be recommended to increase the X-ray yield of targets irradiated by picosecond pulses, but it does not increase the proton energy. In addition to the energy distribution, the micro-relief changes the angular distribution of the beam of accelerated protons. It becomes narrower and directed along the normal to the rear side of the target, while the angular distribution of the beam of protons accelerated from the flat target at high intensities is shifted toward the axis of the laser beam. Thus, the addition of micro-relief to the front side of a target alters the angular distribution of accelerated protons. In future work, we plan to optimize the relief parameters (such as the height, diameter, and separation period of the micro-wires) in order to optimize the proton cut-off energy and angular divergence.
Author ORCIDs
M.V. Sedov, 0000-0001-5920-6917
Acknowledgments
The authors appreciate the extensive support provided by the Central Laser Facility during planning, execution, and analysis of the experimental campaign. This project received support from UK research councils and in particular EPSRC grants EP/L000644/1 and EP/L01663X/1. X-ray measurements were carried out by JIHT RAS team under financial support of Russian Science Foundation grant # 17-72-20272. The work is the part of the framework of the Excellence Initiative, Darmstadt Graduate School of Excellence Energy Science and Engineering supported by DFG fund (GSC 1070). This article is dedicated to the memory of our wonderful colleague Prof. Anatoly Faenov, whom we will remember as brilliant scientist and exceptional person.


