1. INTRODUCTION
The X-pinch is made from two (or more) fine wires that cross and touch at a single point forming an “X” shape. When a fast-rising high current (dI/dt > 1 kA/ns) (Shelkovenko et al., Reference Shelkovenko, Pikuz, Douglass, Mcbride, Breenly and Hammer2006) passes through the wires, a localized bright X-ray source is produced with an X-ray pulse duration of about 1 ns and a spot size of about 10 µm in the 3–5 keV X-ray energy range around the crossing region. Various studies on the X-pinch mass scaling (Shelkovenko et al., Reference Shelkovenko, Pikuz, Sinars, Chandler and Hammer2002; Sinars et al., Reference Sinars, Pikuz and Douglass2008; Wu et al., Reference Wu, Qiu, Wu, Lv, Wang, Lei, Guo, Han, Zhang, Yang, Cong and Qiu2010), X-pinch evolution (Shelkovenko et al., Reference Shelkovenko, Pikuz, Hammer, Dimant and Mingaleev1999a), and X-ray spectroscopy (Sinars et al., Reference Sinars, Pikuz, Shelkovenko, Chandler, Hammer and Apruzese2003; Shlyaptseva et al., Reference Shlyaptseva, Hansen, Kantsyrev, Fedin and Ouart2003) at the 0.2–6.0-MA current level have been reported. In the applications, the X-pinch is an excellent source for the point-projection X-ray imaging of soft biological objects (Song et al., Reference Song, Byung, Pikuz, Shelkovenko and Hammer2002), inertial confinement fusion capsules (Beg et al., Reference Beg, Stephens, Xu, Haas, Eddinger, Tynan, Shipton, Debono and Wagsha2006), single-wire explosions (Hammer & Sinars, Reference Hammer and Sinars2001), and Z-pinch plasma.
The X-pinch based X-ray backlighting diagnostics of the wire-array Z-pinch plasma have been established on XP (0.45-MA, 100-ns, Cornell University, Ithaca, New York) (Shelkovenko et al., Reference Shelkovenko, Pikuz, Mingaleev and Hammer1999b), MAGPIE (1.4-MA, 240-ns, Imperial College London, UK) (Lebedev et al., Reference Lebedev, Beg, Bland, Chittenden, Dangor, Haines, Pikuz and Shelkovenko2001), Angara-5-1 (3-MA, 100-ns, Troitsk Institute for Innovation and Thermonuclear Researches, Russia) (Volkov et al., Reference Volkov, Grabovskii, Zurin, Mitrofanov, Oleinik and Porofeev2004), COBRA (1-MA, 100-ns, Cornell University, Ithaca, New York) (Douglass & Hammer, Reference Douglass and Hammer2008), and PPG-1 (0.2-MA, 110-ns, Tsinghua University, China) (Liu et al., Reference Liu, Zou, Wang, Zeng and He2008). The wire-array Z-pinch load is commonly placed in the center of the diode, and X-pinches in some of the return current rods as X-ray backlighters. The current that flows through the Z-pinch load first would be divided between the return current rods and the X-pinch loads. An intense X-ray burst emits from the X-pinch and this point X-ray source acts as a backlighter source for the Z-pinch plasma X-ray shadowgraphy. These backlighting images are very helpful in understanding the basic Z-pinch plasma process at the early stage, such as the dense wire core expansion and ablation, the interwire plasma merging, and the effect of core-corona plasma structure on seeding of the Rayleigh-Taylor (R-T) instabilities.
Despite the studies mentioned above, the wire-array Z-pinch evolutions depend greatly on the facility where the experiments are fielded and the load configurations tested. The X-pinch characteristics are determined by the magnetic field formed from the self-current and affected by the Z-pinch main load current. In order to establish the X-pinch-based X-ray, shadowgraphy diagnostics for the wire-array Z-pinches at the 1-MA “QiangGuang-1” generator at the Northwest Institute of Nuclear Technology, experiments were fielded with the primary purpose of understanding the X-pinch backlighters' performances when installed at the place of the return current posts. The first X-ray burst time of X-pinches, the X-pinch source size, and X-ray shadow images of exploding wire arrays have been studied. The experimental description, example data, and discussions are presented in this paper.
2. EXPERIMENTAL SETUP
“QiangGuang-1” is a linear-transformer-driver (LTD)-based water-dielectric low-impedance transmission line pulsed power machine. The LTD consists of 120 4-μF/50kV capacitors, 120 gas spark switches, 30 magnetic cores, and 4 parallel discharging circuits. The water-dielectric lines are composed of a 1.4-Ω intermediate line, a 0.75-Ω pulse-forming line, a 0.75-Ω transmission line, and a 0.75-Ω output line (Zeng et al., Reference Zeng, Qiu, Cong, Wang, Kuai, Sheng, Wu, Guo, Li and Qiu2008). During the experiments, “QiangGuang-1” provides a current with the peak value of 1.0–1.4 MA and the 10%–90% rise time of about 60 ns.
The backlighting configuration is shown in Figure 1. The wire-array Z-pinch load, a cylindrical-wire-array or a planar-wire-array was placed in the center of the diode with the anode-cathode gap of 22 mm. Over-mass wire array loads were used to obtain better image contrast. Two stainless steel current return rods were used to support the anode electrode. The rod, with the diameter of 8-mm, was strong enough to sustain the mechanical shock of the shot. The X-pinch was placed at the same distance as the return-current conductors from the pinch axis, about 38 mm, to produce a micron scale X-ray source. The X-pinch load was made of two 30 µm Mo wires that crossed to form an “X.” The total height of the X-pinch assembly was 15 mm and the cross angle was about 50°. Since the Z-pinch radiation energy could be hundreds of that from X-pinches, the exposure of the X-ray films would be completely saturated under the Z-pinch background radiation. Therefore, a nylon rod about 2 mm in diameter was placed at the array axis to prevent the imploding Z-pinch plasma from stagnation on the axis and suppress the X-ray radiation with the energy in keV range. Loads with backlighting X-pinches tested are listed in Table 1.

Fig. 1. Photo of the one frame X-pinch-based X-ray backlighting configuration.
Table 1. Summary of the X-pinch backlighters with the main-loads tested in the experiments

A diamond photoconducting detector (PCD) as a standard product from Alameda Applied Sciences Corporation (San Leandro, California) was used to monitor the X-ray bursts from X-pinches. The PCD was covered by a 10 µm Ti filter for measuring X-rays with energy of 3–5 keV. The X-ray vacuum diode (XRD) with a 2.5 µm terephthalate (Mylar) filter was placed 1.67 m from the load and X-ray emissions with the photon energy >100 eV from the main wire-array loads were recorded in some shots. The Lecroy oscilloscopes, 6100A of 1 GHz bandwidth, and 5-GS/s sampling rate were placed outside the experimental hall and recorded PCD waveforms, with about 50-m cables.
The size of the X-pinch bright spot was measured by a slit array camera with a magnification of 2.28. The width of the slit was about 120 µm and the membrane material was 40 µm SUS304 steel. The slit array camera and the wire-array shadowgraphs were covered by a 25 µm Ti filter with the X-ray pass band in the 3–5 keV (see Fig. 2a). The X-ray images were recorded by Kodak Biomax-MS X-ray films and were scanned into a computer for further analysis with a 3000 dpi Agfa Duoscan scanner. The dependence of the Kodak biomax-MS X-ray film's optical density on photon exposure for different energies, calculated from the model (Knauer et al., Reference Knauer, Marshall, Yaakobi, Anderson, Schmitt, Chandler, Pikuz, Shelkovenko, Mitchell and Hammer2006), is shown in Figure 2b. The film sensitivity peaks at about 5 keV. The Mo X-pinch X-ray spectroscopy is mainly composed of the F-like, Ne-like, and Na-like Mo L-shell line radiation in 2–3 keV with continuum radiation. So the backlighting imaging system, composed of the filter, the biomax-MS film, and the Mo X-pinches, was mainly in response to the Mo X-pinch continuum radiation, which is earlier in X-ray burst time and smaller in source size compared to the line radiations (Sinars et al., Reference Sinars, Pikuz, Shelkovenko, Chandler, Hammer and Apruzese2003).

Fig. 2. (Color online) (a) Transmission of the filters and wires. The Mo L-shell line radiation is in 2–3 keV X-ray energy range. (b) The dependence of the Kodak biomax-MS X-ray film's optical density on photon exposure for different energies.
3. EXPERIMENTAL RESULTS
3.1. X-Ray Burst Timing
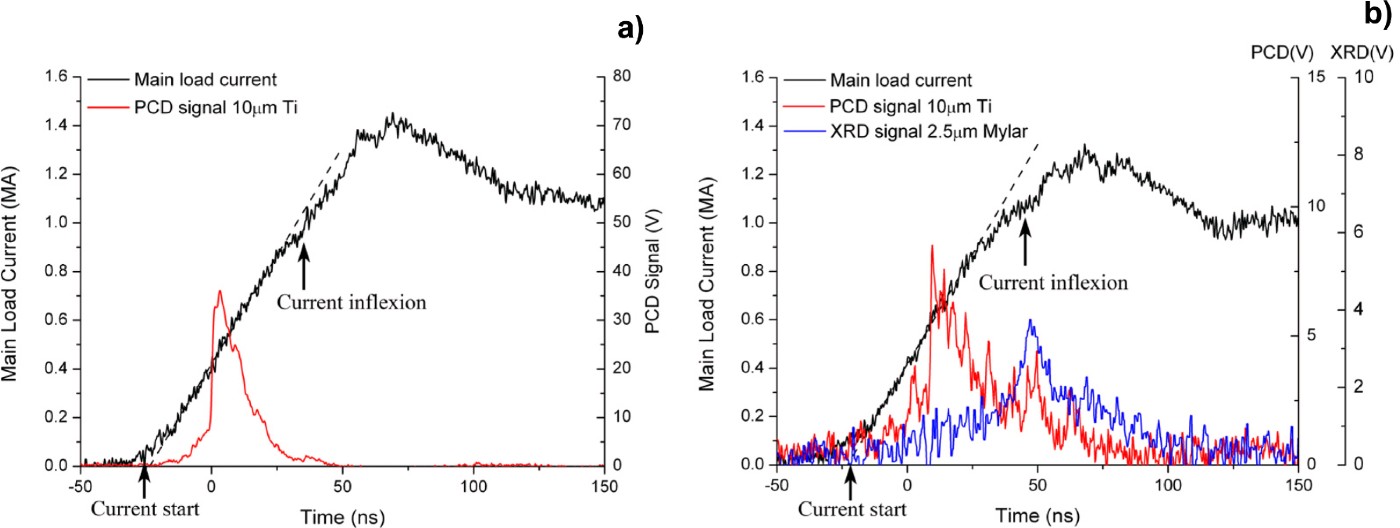
The main load current and the detector signals from shot 10095 and shot 10100 are shown in Figure 3. The X-pinch currents, which were determined by the specific backlighting geometries, were not monitored during the experiments. X-ray bursts from X-pinches had a rise time of about 1 ns, which was comparable to the results when X-pinches were installed as the main current load under the generators at the 0.2–1.0 MA current level. But the fall time was much slower (~20 ns). This long lasting X-ray radiation could come from the hard X-rays when the X-pinch mini-diode broke up (Kantsyrev et al., Reference Kantsyrev, Fedin, Shlyaptseva, Hansen, Chamberlain and Ouart2003). Another reason for the long fall time is that the failling edge was composed of multipulses from multispots formed under the following current. Each pulse may be a subnanosecond signal and could not be distinguished by the recording system.

Fig. 3. (Color online) The main load current and the detector signals from shot 10095 (8 × 50 µm W CWA with 2 × 30 µm Mo X-pinch) (a) and shot 10100 (8 × 20 µm Al PWA with 2 × 30 µm Mo X-pinch) (b). X-pinch radiations were recorded by the PCD and the wire-array load by the XRD.
The first X-ray burst timing of the return current-post based X-pinches is shown in Figure 4. The current start was derived from the linear extrapolation from current linear rise segment. The first significant X-ray emitted at about 27 ns from the current start and the time variation was within ± 4 ns. And this time seemed to be independent of the main load configurations. The stagnation time of the wire-array Z-pinch plasma, when it collided with the nylon rod, was characterized by an inflexion on the main load current caused by the sudden change of the load impedance. At the same time, X-ray radiations from the main load were recorded by the 2.5 µm Mylar filtered XRD in some shots (Fig. 3b). The time varied with the wire-array schemes and the load linear mass.

Fig. 4. The first X-ray burst timing of the return current-post based X-pinches. X-ray signals from shot 10092 and 10097 were missed.
3.2. The Bright Spot Size
Fig. 5a shows the X-ray backlighting image of the slit-array camera from shot 10095 with the 2 × 30 µm Mo X-pinch as a backlighter. Since the direction of the slits was parallel to the axis of X-pinches, it could not resolve the bright spots located along this direction. There was only one significant shadow pattern for each slit under the backlighting system resolution of about 120 µm in Figure 5. A lineout through the center of the backlighting image and the expanded view of the left slit image are shown in Figure 5b and 5c. Supposed that the source intensity had a Gaussian distribution, the full-width at half-maximum of the source equaled to the distance between the 12.5% and 87.5% peak intensity points, about 30 µm (Sinars et al., Reference Sinars, Pikuz and Douglass2008).

Fig. 5. (a) The X-ray backlighting image of the slit array from shot 10095 (8 × 50 µm W CWA with 2 × 30 µm Mo X-pinch). (b) A lineout through the center of the backlighting image. (c) An expanded plot of the left slit image from (b). Vertical bars indicates the distance between the 12.5% and 87.5% peak intensity points.
3.3. Backlighting Images of Multiwire Arrays
Shadowgraphs of multiwire arrays from X-pinch X-ray sources were obtained with the schematic in Figure 1. The magnification of the system was about 14. Figure 6a shows the X-pinch backlighting (2 × 30 µm Mo X-pinch) arrangement for the 8-wire-50 µm W CWA Z-pinch from shot 10097. Only two wires were recorded in the film. Wire-2 (W-2) had a larger magnification factor compared to W-1 due to a smaller distance to the X-pinch location. The tungsten wire expanded from the initial diameter of 50 µm to 255 µm at the time of about 30 ns after the current start (about 80 kA per wire), which indicated a radial expanding speed of about 2–3 µm/ns. The wire core edge was sharp and uniform and little coronal plasma was observed.

Fig. 6. (a) X-pinch backlighting (2 × 30 µm Mo X-pinch) arrangement for the 8-wire-50 µm W CWA Z-pinch from shot 10097. (b) Backlighting images from shot 10097.
The X-pinch backlighting image for the 12-wire-50 µm Al CWA Z-pinch from shot 10098 is shown in Figure 7b. The load linear mass density is 0.64 mg/cm and the K-shell radiation energy optimized Al CWA load is 12-wire-20 µm on “QiangGuang-1” generator. The nylon rod placed at the array axis has a screw thread on it. A ring made from the same 50 µm Al wire was twisted in the wire array and leaned against wire-5 (W-5) as a spatial mark. At the X-pinch burst time, about 24 ns after the current start, the diameter of the wire core was about 690 µm. The transmission ratio of the wire core was greater than the reference wire, which indicated that only a part of the initial mass remained in the wire core. The edge of the wire core in the outward radial direction of the array was sharper than the inward. Due to the phase contrast effects from X-ray refraction and interference, the edges were artificially sharp (Song et al., Reference Song, Byung, Pikuz, Shelkovenko and Hammer2005). For the W-5, which was disturbed by the reference wire, the striation structure with the wavelength of about 30 µm was observed (Fig. 7c).

Fig. 7. (a) X-pinch backlighting (2 × 30 µm Mo X-pinch) arrangement for the 12-wire-50 µm Al CWA Z-pinch from shot 10098. (b) Backlighting images from shot 10098. (c) An expanded region of the W-5 in (b).
4. CONCLUSION AND DISCUSSION
The X-pinch backlighters were tested and the one-frame X-pinch based X-ray backlighting diagnostics of the wire-array Z-pinch were established on the 1-MA “QiangGuang-1” facility. The first X-ray burst time variation of ± 4 ns and the bright spot size of about 30 µm were obtained from the 2-wire 30 µm Mo X-pinch backlighters. X-ray backlighting shadowgraphy images of the over-mass and radiation suppressed Z-pinch wire array loads exhibited a uniform expansion with a factor of 5–12 at the time of about 27 ns from the current start and the striation structure was observed only at the place where disturbed. The Al wire array backlighting images showed a significant edge enhancement due to the phase contrast effects from X-ray refraction and interference.
A three-frame X-pinch based X-ray backlighting system is under-designed at present. The backlighter X-ray burst time could be controlled by varying the X-pinch load linear mass and X-ray backlighting shadowgraphy images from one shot at different time would be obtained.
ACKNOWLEDGMENTS
This work was supported by National Natural Science Foundation of China under contracts 10905047. The authors would like to thank the “Qiangguang-1” operation team for the technical support and also Song J. at Northwest Institute of Nuclear Technology for providing the Agfa Duoscan scanner for our experiments.