


1. INTRODUCTION
Laser produced plasmas has been of great interest as bright sources of X-ray radiation for many years (Son et al., Reference Son, Cho, Kim, Ahn and Kim2007; Chakera et al., Reference Chakera, Kumbhare, Naik and Gupta2007; Andriyash et al., Reference Andriyash, Vikhlyaev, Gavrilov, Dmitrov, Zapysov, Kakshin, Loboda, Lykov, Magda, Politov, Potapov, Pronin, Rykovanov, Sukhanov, Tischenkov, Ugodenko and Chefonov2006; Kuba et al., Reference Kuba, Foord, Izumi, Key, Koch, Moon, Park, Phillips, Remington, Snavely, Wilks, Zhang, Akli, King, Theobald, Stoeckl, Heathcote and Neely2005; Jin et al., Reference Jin, Zeng and Yuan2004, Reference Jin, Zeng and Yuan2008; Yang et al., Reference Yang, Zhang, Ding, Peng, Li, Zheng, Yang, Zhang and Li2003; Chung et al., Reference Chung, Chen, Morgan, Ralchenko and Lee2005; Ciobanu et al., Reference Ciobanu, Negutu, Stafe, Vladoiu, Pais, Stancalie and Puscas2008; Moscicki et al., Reference Moscicki, Hoffman and Szymanski2008; Benredjem et al., Reference Benredjem, Moller, Dubau and Ball2006; Demir et al., Reference Demir, Kenar, Goktas and Tallents2004; Andreev et al., Reference Andreev, Limpouch, Iskakov and Nakano2002; Belyaev et al., Reference Belyaev, Vinogradov, Kurilov, Magunov, Matafonov, Pikuz, Skobelev and Faenov2003; Hatanaka et al., Reference Hatanaka, Ono and Fukumura2008; Kulcsar et al., Reference Kulcsar, Almawlawi, Budnik, Herman, Moskovits, Zhao and Marjoribanks2000; Rajeev et al., Reference Rajeev, Taneja, Ayyub, Sandhu and Kumar2003, Reference Rajeev, Ayyub, Bagchi and Kumar2004; Murnane et al., Reference Murnane, Kapteyn, Gordon, Bokor, Glytsis and Falcone1993; Nishikawa et al., Reference Nishikawa, Nakano, Uesugi and Serikawa1998, Reference Nishikawa, Nakano, Oguri, Uesugi, Nakano, Nishio and Masuda2001, Reference Nishikawa, Nakano, Oguri, Uesugi, Nishio and Masuda2004; Nakano et al., Reference Nakano, Andreev and Limpouch2004). X-rays from such sources have important applications in science and technology including material science, X-ray microscopy, inertial confinement fusion research, microlithography, and particle acceleration (Loupias et al., Reference Loupias, Perez, Benuzzi-Mounaix, Ozaki, Rabec, Gloahec, Pikuz, Faenov, Aglitskiy and Koenig2009; Lindl, Reference Lindl1995; Daido, Reference Daido2002; Ganeev et al., Reference Ganeev, Chakera, Raghuramaiah, Sharma, Naik and Gupta2001; Chaker et al., Reference Chaker, La Fontaine, Cote, Kieffer, Pepin, Talon, Enright and Villeneuve1992; Chakera et al., Reference Chakera, Kumbhare and Gupta1998; Tomie et al., Reference Tomie, Kondo, Shimizu and Lu1997; Schriever et al., Reference Schriever, Mager, Naweed, Engel, Bergmann and Lebert1998). The enhancement of laser plasma X-ray sources for applications is consequently topical and various methods have been proposed for increasing X-ray yield efficiency. X-ray enhancement using laser pre-pulses (Andreev et al., Reference Andreev, Limpouch, Iskakov and Nakano2002; Belyaev et al., Reference Belyaev, Vinogradov, Kurilov, Magunov, Matafonov, Pikuz, Skobelev and Faenov2003; Nishikawa et al., Reference Nishikawa, Nakano, Uesugi and Serikawa1998; Hatanaka et al., Reference Hatanaka, Ono and Fukumura2008; Fazeli et al., Reference Fazeli, Mahdieh and Tallents2010), structured surfaces (Kulcsar et al., Reference Kulcsar, Almawlawi, Budnik, Herman, Moskovits, Zhao and Marjoribanks2000; Rajeev et al., Reference Rajeev, Taneja, Ayyub, Sandhu and Kumar2003, Reference Rajeev, Ayyub, Bagchi and Kumar2004; Murnane et al., Reference Murnane, Kapteyn, Gordon, Bokor, Glytsis and Falcone1993; Nishikawa et al., Reference Nishikawa, Nakano, Oguri, Uesugi, Nakano, Nishio and Masuda2001, Reference Nishikawa, Nakano, Oguri, Uesugi, Nishio and Masuda2004), mixed-Z (Chakera et al., Reference Chakera, Kumbhare, Naik and Gupta2007), porous (Nishikawa et al., Reference Nishikawa, Nakano, Uesugi and Serikawa1998; Borisenko et al., Reference Borisenko, Bugrov, Burdonskiy, Fasakhov, Gavrilov, Goltsov, Gromov, Khalenkov, Kovalskii, Merkuliev, Petryakov, Putilin, Yankovskii and Zhuzhukalo2008; Mahdieh et al., Reference Mahdieh, Fazeli and Tallents2009), and multilayer targets (Nakano et al., Reference Nakano, Andreev and Limpouch2004) have been reported. X-ray emission enhancement is improved by either improving the laser plasma coupling during the irradiation or enhancing the local field associated with the laser beam at the target surface. In our previous works, we have shown that for nanosecond and sub-nanosecond laser pulse regime, the volume effect plays a major role in laser plasma energy coupling (Mahdieh et al., Reference Mahdieh, Fazeli and Tallents2009; Fazeli et al., Reference Fazeli, Mahdieh and Tallents2010). Using porous metal targets, free-bound and free-free (Bremsstrahlung) X-ray emission was calculated. For simulating the plasma hydrodynamics, a two layer metal target (a thin layer porous metal pasted over a thicker substrate of the same metal) was assumed to be irradiated by a pulsed laser beam. The target porosity was controlled in the calculations by changing the density of the thin layer. It was shown that free-bound and free-free X-ray emission from such targets can be enhanced significantly at an optimum density ratio of the porous layer to the substrate (Mahdieh et al., Reference Mahdieh, Fazeli and Tallents2009). Using the same targets and assuming double pulse irradiation, the free-bound and free-free X-ray emission was also calculated (Fazeli et al., Reference Fazeli, Mahdieh and Tallents2010). It was shown that if porous targets were irradiated by double pulses with appropriate intensities and delays, the free-bound and free-free X-ray emission in such conditions can be enhanced further.
In this paper, we present the results of simulating line X-ray emission from both porous and solid iron targets irradiated by picosecond laser pulses. Spectral line intensities are calculated for selected lines within the wavelength range 13.3–13.7 nm likely to be useful in extreme ultraviolet (EUV) lithography. Wavelengths around 13.5 nm have been selected in the semiconductor industry roadmap as the optimum for the future production of integrated circuits using EUV lithography due to the high reflectivity possible with Si-Mo multilayer mirrors (Attwood, Reference Attwood2007; Yulin et al., Reference Yulin, Benoit, Feigl and Kaiser2006; Watanabe et al., Reference Watanabe, Kinoshita, Sakaya, Shoki and Lee2005).
Different X-ray sources can be used to generate EUV radiation such as synchrotron radiation (Neureuther, Reference Neureuther, Winick and Doniach1980; Grobman, Reference Grobman1983), X-ray tubes (Warlaumont & Maldonado, Reference Warlaumont and Maldonado1981), and plasma sources (Nagel et al., Reference Nagel, Whitlock, Greig, Pechacek and Peckerar1978; Chaker et al., Reference Chaker, Pepin, Bareau, Lafontaine, Toubhans, Fabbro and Faral1988). Although conventional synchrotron sources can produce highly collimated radiations and are very bright but are too expensive for small and moderate size production facilities. X-ray tubes are quite inexpensive but have an important disadvantage that is the blurring effect. This effect occurs due to the large size and the low brightness of these sources. In comparison with such conventional sources, laser produced plasmas offer some specific advantages such as compactness, easy access, relatively low cost, short pulse length, and small X-ray source size. These sources have a high efficiency however; the produced X-ray yield can be enhanced using the methods mentioned above. Such advantages make the laser plasmas as the best candidate for EUV lithography.
2. THEORY AND SIMULATION
The laser interaction with solid target and subsequent plasma expansion are simulated with the atomic physics code EHYBRID (Pert, Reference Pert1983; Healy et al., Reference Healy, Cairns, Lewis, Pert and Plowes1995a, Reference Healy, Djaoui, Holden, Pert and Rose1995b; Holden et al., Reference Holden, Healy, Lightbody, Pert, Plowes, Kingston, Robertson, Lewis and Neely1994). This program can simulate two-layer targets using 98 Lagrangian cells along the incident laser axis. Inverse Bremsstrahlung absorption is included for the laser energy absorption in the under dense plasma. A specified portion of the laser energy (70%) is considered to be reflected at the critical density and 30% of the energy reaching the critical density is dumped in the cells near the critical density. The code calculates plasma parameters (such as temperature, density, etc.) in each cell at each time step. The time dependent excitation and ionization are calculated using average-atom approximation self-consistently with the hydrodynamics. In addition, a flux limiter of 0.1 is included for the reduction of energy transport from the free streaming limit.
In the simulations, the porous target is modeled as a two-layer target consisting an 8 µm thick iron substrate with solid density (N s) and a 2 µm iron layer with lower density (N p) on the top as is illustrated in Figure 1.

Fig. 1. Schematic of the porous target used in the simulations of laser irradiation.
In such conditions, the effect of target porosity on the line X-ray emission can be controlled in the calculations by changing the thin layer density. For simplicity, a parameter α is introduced for the density ratio of the porous layer to the substrate:
The spectral line intensities were calculated only for selected bound-bound transitions within the wavelength range 13.3–13.7 nm, likely to be useful in EUV lithography. Three relevant lines of iron plasma were considered in the calculations: (1) N-like iron transition: 2s22p3-2s2p4, (2) B-like iron transition: 2s22p-2s2p2, and (3) Be-like iron transition: 1s22s2p-1s22p2. Some important properties of these transitions are summarized in Table 1. The three lines considered dominate emission in the selected wavelength range in iron plasmas (Sugar & Rowan, Reference Sugar and Rowan1995; Lawson & Peakock, Reference Lawson and Peakock1980; Lawson et al., Reference Lawson, Peakock and Stamp1981).
Table 1. Atomic properties of spectral lines of iron considered. Transition probabilities A ul, energies above the ground state of the lower E l and upper E u states and the respective lower and upper degeneracies, g l, g u are shown (Sugar & Rowan, Reference Sugar and Rowan1995; Lawson & Peakock, Reference Lawson and Peakock1980, Lawson et al., Reference Lawson, Peakock and Stamp1981)

Since there are high electron collisional rates at the plasma densities involved in the calculations, local thermodynamic equilibrium(LTE) balance of the excited states with the ground state population of the next higher ionization stage was considered as a good approximation to calculate the populations of the excited levels. In LTE, the population N n, of the level n for a specified ion with degree of ionization Z can be given by (Lang, Reference Lang1999):
where N e is the density of electrons with temperature T e and mass m e, N Z is the density of recombining ions in ionization state Z, h is the Planck's constant, g n is the statistical weight of the nth shell, χn is the ionization energy from level n of the ion and k is Boltzmann constant. The ionization stage abundance was calculated using the EHYBRID average atom approximation.
A post-processor code was developed to calculate the emitted intensity (I λ) of the selected spectral lines using:
where i is the cell number, N u and A ul are the upper state population, and the radiative transition probability for a given transition, respectively, T is the escape factor, c is the vacuum speed of light, λ is the spectral line wavelength, and dV is the volume of each cell. Because of strong oscillator strengths, selected lines can be optically thick and may influence the populations significantly. The effect of opacity on the emitted lines was also included through an approximate escape factor (T) for Doppler broadened lines (Holstein, Reference Holstein1947, Reference Holstein1951). In this study, the developed post-processor code was used to calculate the intensity of the selected lines using relation (3) and Table 1 with Doppler broadening considered for the selected spectral line profiles. The hydrodynamics data for the iron plasma such as T e, N e, N Z, and dV were provided by EHYBRID code and the upper level populations were calculated by using relation (2).
3. RESULTS AND DISCUSSION
3.1. Spectral Line Intensities
Figure 2 shows an example of the simulated time and space-integrated intensities of Fe XX, Fe XXII, and Fe XXIII lines emitted from iron plasma in the selected wavelength range. The iron plasma was assumed to be created by focusing a 532 nm wavelength laser beam normally onto the surface of a one-layer solid iron target with a thickness of 8 µm in a spot radius of 100 µm. Laser pulse durations of 10 and 20 ps and three different intensities i.e., 1015, 5 × 10¹⁵, and 1016 W/cm2 have been simulated (Fig. 2).

Fig. 2. Spectral intensities of the selected lines emitted from iron plasma. A solid iron target with thickness 8 µm is irradiated by 532 nm, (a) 10 ps and (b) 20 ps laser pulses with different intensities.
It can be seen that by increasing the laser intensity, the lines intensities are increased. However, the increase is different for different lines. For example, Figure 2 shows the intensities of lines Fe XXII and Fe XXIII are more increased in comparison with the intensity of the Fe XX line. Such result can be interpreted as follows. In plasma created by specified laser intensity, ions with a variety of ionization degree (Z) are produced. According to the relation (2), the density of ions (N Z) can strongly affect the upper level populations, which are directly related to the intensity of lines through the relation (3). The densities of these ions and their distribution versus ionization degree may be varied if the laser intensity is changed. The densities of ions with lower degrees of ionization are closer to their maximum values that can be produced in the hot plasma. Therefore, by increasing the laser intensity, hotter and denser plasma is created in which the growth of the ions in higher degrees of ionization will be more in comparison with emitting ions in lower ionization states. As a result, the intensity of a selected line originating from ions in a higher ionization state will be more increased.
In addition, Figure 2b shows that for pulse duration of 20 ps the line intensities are approximately two times greater than those of 10 ps laser pulse (Fig. 2a). Clearly, this is because the incident energy is doubled and thus the absorbed laser energy is increased for a longer laser pulse and X-ray emission is also increased. However, it can be seen that again the intensities of lines Fe XXII and Fe XXIII are more increased in comparison with the line Fe XX. Again, by increasing the incident laser energy (this time by increasing the pulse duration), the number of radiant Fe XXII and Fe XXIII ions, which are in higher ionization states (Z = 22 and 23) is more increased in comparison with Fe XX ion (Z = 20).
In order to see the variation of the ionization in the plasma cells by changing the laser intensity, the time averaged ionization Z * (during the laser radiation) is calculated for different laser intensities. At each time step, EHYBRID calculates an average ionization of each Lagrangian cells. The time averaged ionization can be obtained by averaging this value during an irradiation time. Figure 3 shows the spatial variation of the Z * in the iron plasma created by laser intensities of 1015, 5 × 10¹⁵, and 1016 W/cm2. It is clear that Z * values increase with laser intensity. This means that the number of emitting ions with high degrees of ionization (Z = 20, 22, and 23) is increased with a higher laser intensity and so X-ray line emission from such ions is increased.

Fig. 3. Time averaged ionization across the plasma cells. The iron plasma is assumed to be created by irradiating a solid iron target by 10 ps laser pulses of different intensities.
3.2. Single Line Enhancement
We now consider a porous target (as described in Section 2) with various density ratios irradiated by a 10 ps laser pulse of irradiance 1016 W/cm2. Figure 4 shows the simulated emitted spectrum of the selected lines for three different density ratios of the target.

Fig. 4. Spectral intensities of the selected lines emitted from iron plasma at different density ratios of the porous target when irradiated by 10 ps laser pulse of irradiance 1016 W/cm2.
The results in Figure 4 show that the line intensities can be enhanced by decreasing the density ratio α. For example, the intensities of lines Fe XX, Fe XXII, and Fe XXIII can be enhanced about 1.2, 2.1, and 2.5 times if a porous target with density ratio 1/4 is used instead of the solid. In order to see more details of porosity effect on the X-ray yield enhancement, the time-integrated X-ray yield emitted by a single line (Fe XXIII) is evaluated for porous targets with different density ratio. Figure 5 shows the variation of total X-ray yield for Fe XXIII line versus density ratio. In this figure, it was assumed that porous targets (with different porosity) were irradiated with 10 and 20 ps laser pulses of intensity 1016 W/cm2. The total X-ray yield in each figure is compared with the yield of the solid target.
Fig. 5. Time-integrated X-ray energy emitted via the Fe XXIII line at different density ratios of the porous target irradiated by (a) 10 ps and (b) 20 ps laser pulses with intensity 1016 W/cm2.
Figure 5 shows that there is an optimum value for α in which the total X-ray yield of a selected line can be maximized. For example, for the conditions of Figure 5, the optimum values of α for 10 and 20 ps laser pulses are approximately 0.25 and 0.28, respectively. Such enhancement can occur due to two effects. First, as described in our previous works (Mahdieh et al., Reference Mahdieh, Fazeli and Tallents2009; Fazeli et al., Reference Fazeli, Mahdieh and Tallents2010), using the porous targets means a greater volume of the hot plasma can be produced and the light absorption is increased going through a larger interaction volume resulting in the enhancement of the X-ray yield with the porous target.
Second, using a porous target instead of a solid target, the number of emitting ions (correspond to a selected line) in the plasma is increased due to the increased temperature in the plasma cells (see Fig. 8 in Mahdieh et al. (Reference Mahdieh, Fazeli and Tallents2009)). In fact, by reducing the density ratio (increasing the porosity) of the target, the laser beam can ionize more interacting atoms to the degree of ionization of ions emitting the selected line. As a result, X-ray emission via this line can be enhanced.
Figure 6 shows the variation of the average degree of ionization Z * in the iron plasma created by a 10 ps laser pulse of intensity 1016 W/cm2. It can be seen that the Z * values in the plasma cells is increased for density ratio α = 1/4 and more cells have an averaged ionization close to about 23 therefore, line X-ray emission via Fe XXIII line is increased.

Fig. 6. Comparison of the time averaged ionization in the iron plasma cells for porous targets with density ratios of 1 and 1/4. Both targets are irradiated by 10 ps laser pulses of intensity 1016 W/cm2.
On the other hand, it can be seen from Figure 5 that for density ratios lower than the optimum value, the total line energy is decreased. Such a decrease of the line energy can be due to ionization of more atoms to a degree of ionization greater than 23 for a highly porous target. Such behavior is illustrated in Figure 7. It can be seen from this figure that by decreasing the density ratio of the target to 1/6, the number of plasma cells, which have an average degree of ionization close to 23 is decreased and the Z* values for more cells is shifted to upper than that.

Fig. 7. Comparison of the time averaged ionization in the iron plasma cells for porous targets with density ratios of 1/4 and 1/6. Both targets are irradiated by 10 ps laser pulses of intensity 1016 W/cm2.
Changing the target porosity affects the spatial and temporal distribution of plasma density and temperature. As relation (2) shows, upper state populations for a given transition depend on the plasma parameters (N e and T e). Figure 8 shows the time-averaged spatial distribution of plasma density and temperature for targets with α = 1/4 and 1/6. The porous targets are irradiated by 10 and 20 ps laser pulses of intensity 1016 W/cm2.

Fig. 8. Time averaged temperature and density of the iron plasma created by irradiating porous targets with different density ratios by 10 ps laser pulses of intensity 1016 W/cm2.
Figure 8 shows that by increasing the target porosity (or decreasing α), the density N e decreases and temperature T e increases in the plasma cells. According to relation (2), such conditions lead to a depression of the upper state population for a specific degree of ionization.
3.3. The Effect of Laser Intensity
In the previous section, we showed that line X-ray emission can be enhanced by reducing the porosity of the target to an optimum value. Such enhancement may be different for various laser intensities. Figures 9a and 9b show the energy enhancement of Fe XX and Fe XXIII lines respectively for a 10 ps laser pulse of different intensities irradiating porous target with various density ratios.

Fig. 9. Total energy enhancement of the (a) Fe XX line and (b) Fe XXIII line at different density ratios of the porous target when irradiated by 532 nm, 10 ps laser pulses of various intensities.
It is clear from these figures that maximum X-ray yield occurs at different density ratios for different laser intensities. As explained in Section 3.2, reducing the target density ratio leads to the generation of more radiant ions corresponding to a selected line in the plasma. By increasing the laser intensity, plasma with higher density and temperature is created in which the density of radiant ions is closer to its maximum value. Hence, the maximum number of radiant ions can be obtained at a higher density ratio and therefore, the optimum value of α is increased for higher laser intensities.
From Figure 9 it can be seen that the enhancement of X-ray yield has different trends for various laser intensities. Clearly, there is an intensity threshold for the formation of ions with specific degree of ionization in laser-produced plasma. When the laser intensity is higher than a threshold, the most number of radiant ions can be created in the plasma cells by reducing the porous layer density. As the threshold intensity for the formation of Fe XX ions is lower than that of Fe XXIII therefore, the laser intensity for which significant enhancement can be obtained for Fe XX line is lower than that of Fe XXIII line.
3.4. Total Yield Enhancement
According to the calculations, as the yield of each line is enhanced by increasing the target porosity therefore, the total X-ray yield emitted via three selected lines (Fe XX, Fe XXII, and Fe XXIII) in the selected wavelength range is also increased. However, it can be expected that the variation of the total X-ray yield with density ratio α may be different for various laser intensities or pulse durations. The effects of pulse duration are considered in the next section.
Figure 10 shows the enhancement of the total X-ray yield from a porous iron target irradiated by a 10 ps laser pulse of various intensities. It can be seen that the total X-ray yield can be more enhanced for a laser intensity of 8 × 10¹⁵ W/cm2. However, there is not a significant difference between maximum enhancements for laser intensities around 8 × 10¹⁵ W/cm2, e.g., 5 × 10¹⁵ and 1016 W/cm2. In addition, by decreasing the laser intensity, the optimum value of α is shifted to lower values as was explained in Section 3.3.

Fig. 10. Comparison of the total X-ray enhancement from porous iron target irradiated by 10 ps laser pulses of different intensities.
3.5. The Effects of Pulse Duration
Figure 11 shows the dependence of the simulated total X-ray yield to the target density ratio (α) for different pulse durations varying from 10 ps to 50 ps while keeping the laser intensity constant at 5 × 10¹⁵ W/cm2.
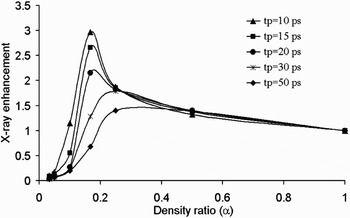
Fig. 11. Enhancement of the total X-ray energy (from three selected lines) for different density ratios of the porous target. The target is irradiated with laser pulses of different durations while the laser intensity is fixed at 5 × 10¹⁵ W/cm2.
It can be seen from this figure that the optimum density ratio is higher for a longer laser pulse. As the total laser energy delivered to the target is greater for a longer laser pulse, the maximum number of ions emitting the selected lines is produced at a higher density ratio (lower porosity). In addition, Figure 11 shows that for specific laser intensity, more enhancements are obtained for shorter laser pulses. A laser pulse irradiating a solid target with a specified intensity creates plasma with certain numbers of ions emitting the selected lines. By decreasing the density ratio of the target to an optimum value, the densities of emitting ions increase to their optimum values and in such conditions, X-ray emission can be enhanced significantly. However, for a longer laser pulse, hotter and denser plasma is created in which, the densities of radiant ions are closer to their optimum values. As a result, the effect of reducing target density ratio on the X-ray enhancement is not as significant as shorter pulses.
It must be noted that the total X-ray emitted from plasma produced by a longer laser pulse is greater. However, the enhancement of X-ray emission from a porous target in comparison with the solid is greater for shorter pulse durations.
4. CONCLUSIONS
Line X-ray emission from solid and porous iron targets irradiated by picosecond laser pulses was investigated numerically. Spectral line intensities were calculated for three selected lines in the wavelength range 13.3–13.7 nm. The results showed that using porous targets can significantly enhance the X-ray yield. It was concluded that there is an optimum density ratio of the porous layer to the solid substrate at which, maximum line energy can be produced. The enhancement had different trends for various laser intensities and pulse durations. By increasing the laser intensity or increasing the pulse duration, maximum X-ray yield occurred at a higher density ratio (lower porosity). Such laser plasma X-ray sources are the best choice for EUV micro- and nano-lithography because of special properties such as high efficiency, compactness, easy access, and small X-ray source size.


