1. INTRODUCTION
Interest in studying the spectral–luminescent properties of low-temperature plasma excited by ionized radiation is because such plasma is an active medium of gas lasers using nuclear or beam pumping (Ulrich et al., Reference Ulrich, Adonin, Jacoby, Turtikov, Fernengel, Fertman, Golubev, Hoffmann, Hug, Krucken, Kulish, Menzel, Morozov, Ni, Nikolaev, Shilkin, Ternovoi, Udrea, Varentsov and Wieser2006; Mel'nikov et al., Reference Mel'nikov, Sizov, Sinyanskii and Miley2015) and spontaneous emission sources (Prelas et al., Reference Prelas, Boody, Miley and Kunze1988; Ulrich, Reference Ulrich2012) and is used in ionizing radiation detectors (Sakasai et al., Reference Sakasai, Kakuta, Yamagishi, Nakazawa, Yamanaka and Iguchi1996). Although the luminescent properties of such plasma have been studied for more than 50 years (Bennet, Reference Bennett1962; De Young & Weawer, Reference De Young and Weaver1980; Mis'kevich, Reference Mis'kevich1991), these studies cannot be considered as complete. Most of the research has been devoted to individual spectrum parts especially the ultraviolet (UV) spectrum. Part of the research was carried out previously when the line intensity could not be determined with sufficient accuracy.
Studies of the absolute line intensities of argon, krypton, and xenon in the range of 400–900 nm subject to excitation using 3He(n,p)3H nuclear reaction products are shown in (Boody & Prelas, Reference Boody and Prelas1993). The emission spectra of mixtures containing of the order of 1.3 kPa of argon, krypton, or xenon and 100–106 kPa 3He have been studied, and such mixtures were concluded to have no obvious atomic lines in the Nd:YAG or Nd:glass absorption bands. The luminescence spectra of rare gases and their binary mixtures in the range of 350–875 and 740–1100 nm with excitation using uranium fission fragments were studied in (Gorbunov et al., Reference Gorbunov, Grigor'ev, Dovbysh, Mel'nikov, Sinitsyn, Sinjanskii and Tsvetkov2004; Abramov et al., Reference Abramov, Gorbunov, Melnikov, Mukhamatullin, Pikulev, Sinitsyn, Sinyanskii and Tsvetkov2006).
In the present paper, we have studied the luminescence spectra of noble gases and their binary mixtures in the 200–975 nm range subject to excitation using heavy ion beams.
2. EXPERIMENTAL SETUP
The studies were carried out on an ion accelerator DC-60 (Gikal et al., Reference Gikal, Dmitriev, Apel, Bogomolov, Borisov, Buzmakov, Gulbekyan, Ivanenko, Ivanov, Itkis, Kazarinov, Kalagin, Kolesov, Papash, Paschenko, Tikhomirov and Khabarov2008; Zdorovets et al., Reference Zdorovets, Ivanov, Koloberdin, Kozin, Alexandrenko, Sambaev, Kurakhmedov and Ryskulov2014). DC-60 accelerator is a dual cyclotron; multi-charged ions are produced in the Electron Cyclotron Resonance ion source and are transported by injection channel into the center of the cyclotron magnet, where main acceleration takes place. The main parameters of the accelerated ion beam were the following: ion type was from lithium to xenon, the ion energy varied from 0.5 to 1.75 MeV/nucleon. The intensity of ion beam varied from 1012 to 1014 particles/s depending on the type and energy of the ions. The ion impulse duration was several nanoseconds at an ion repetition rate of 1.84–4.22 MHz. Primarily argon ions were used as a source of ionization and excitation. The accelerated ion beam passed from an evacuated transportation channel through a 3-mm hole in the flange to the irradiation chamber (Fig. 1). The hole in the flange was closed using a 2-μm titanium foil membrane or a 2.5-μm-thick Havar foil. The internal volume of the irradiation chamber was 34 liters (380 × 300 × 300 mm3). The chamber was pumped out by turbomolecular pump up to vacuum 0.1 Pa before gas puffing. Gases were used with an impurity content of <10−3%, and the whole system was flushed several times with the new gas. The gas pressure in the cell was measured using a capacitance diaphragm gauge (Agilent Technologies CDG-500) mounted on the top of the chamber.

Fig. 1. Schematic representation of the installation: flange with Ti foil (1); irradiation chamber (2); pressure gauge (3); pressure controller (4); quartz window (5); collimator (6); fiber (7); spectrometer (8); PC (9); gas inlet valve (10).
The ions passed through the foil and ionized and excited the gas mixture in the irradiation chamber. The argon ion energy after the separation foil was approximately 55 MeV, the beam current was 20 nA, and the corresponding pump power of 80 kPa argon was W ≈ 3 W/cm3. The emerging light radiation passed through a quartz window and condenser lens made from fused silica and was focused on the optical fiber. The beam fell on a compact spectrometer (Ocean Optics QE65Pro) through the fiber, and the recorded spectrum was displayed on a computer. The relative spectral sensitivity of the system (quartz window, lens, optical fiber, and spectrometer) was on the range of 400–975 nm measured using a calibrated HL2000-CAL halogen lamp. In the UV region up to 210 nm, the quartz window transmission exceeded 50%, and the transmission boundary of the optic fiber and the lens was 190 nm. Some measurements are made using BK-7 glass lens with a diameter of 50.8 mm instead of a 25.4-mm quartz lens.
The distance from the separating flange to the output window was 500 mm. Runs of argon-40 ions with energy of 50 MeV in the gas under normal conditions range from 13 mm for xenon up to 114 mm for helium.
3. CONTINUUM AND MOLECULAR BANDS
An intense molecular band in the range of 200–400 nm with a maximum of approximately 260 nm was observed in the krypton spectrum (Fig. 2). This band is typically referred to as the third continuum of krypton (Boichenko et al., Reference Boichenko, Tarasenko, Fomin and Yakovlenko1993), and the origin of the third continuum was considered in (Boichenko et al., Reference Boichenko, Tarasenko and Yakovlenko1999; Wieser et al., Reference Wieser, Ulrich, Fedenev and Salvermoser2000). The krypton atom line at λ = 557 nm was overlaid using a band of a KrO excimer molecule (McCusker, Reference McCusker and Rhodes1984), and the appearance of this band was, apparently, due to the presence of oxygen or water vapor in the krypton.
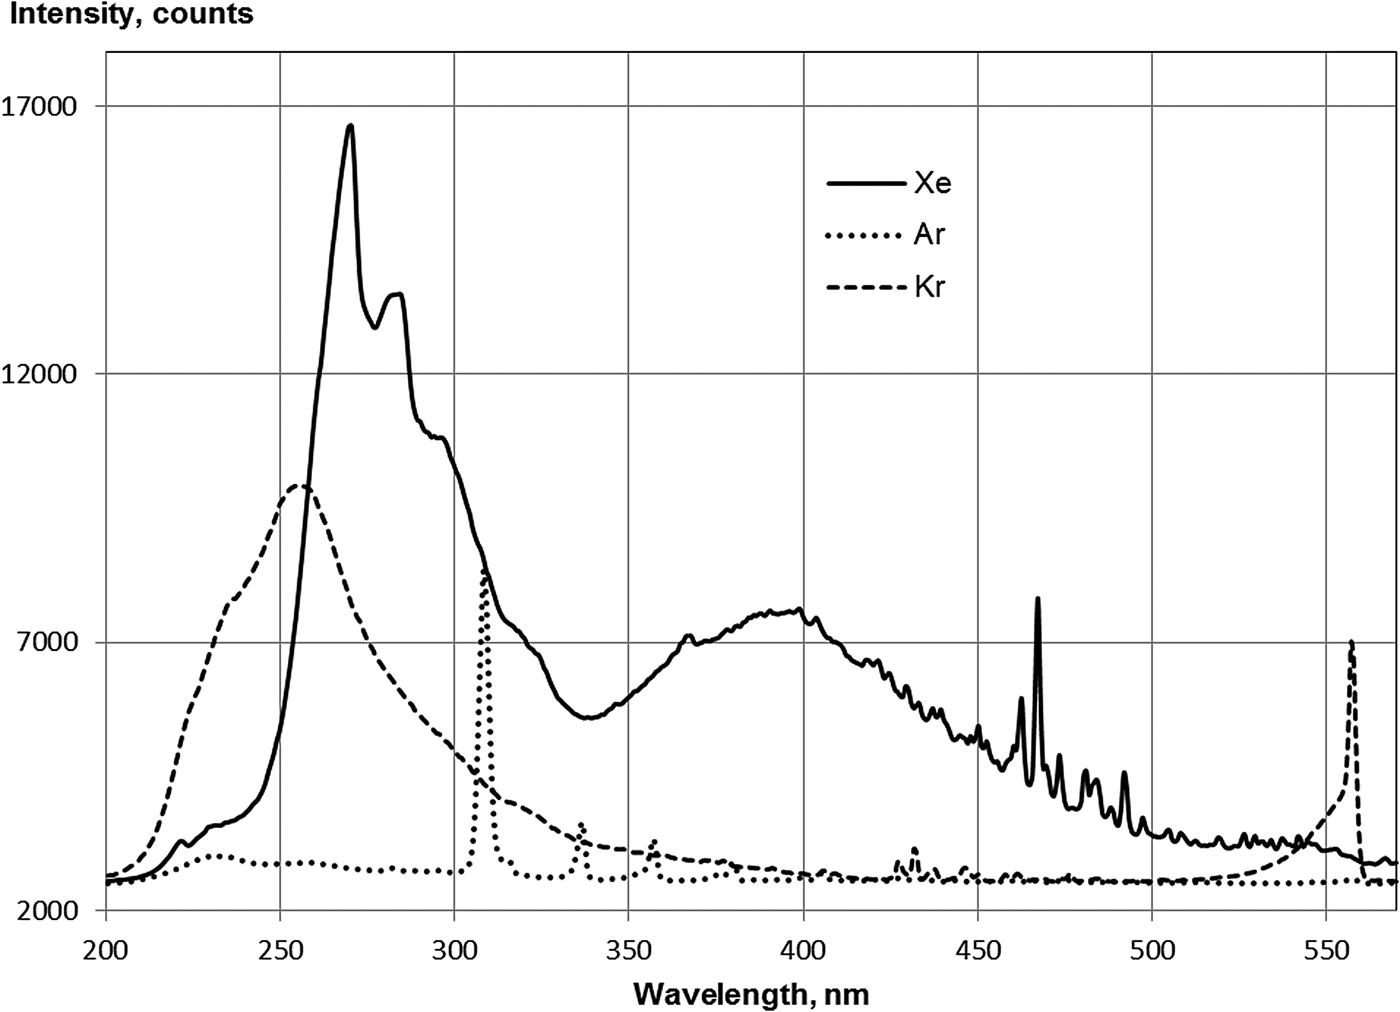
Fig. 2. Spectra of Ar(79.6 kPa), Kr(80.6 kPa), and Xe(30.7 kPa) under argon beam excitation in the range of 200–600 nm. Integration time of the spectrometer: 3s.
The band with a maximum at 230 nm corresponding to the third continuum in argon is weakly expressed. A strong band of 308 nm is connected due to transitions of the OH radical, and the bands of the second positive system of nitrogen were also observed (see Fig. 2).
The band of third continuum in xenon has several maxima: the main maxima at 270 and 390 nm (see Fig. 2). According to Wieser et al. (Reference Wieser, Ulrich, Fedenev and Salvermoser2000), these maxima correspond to different times of the decay of particles in the xenon plasma.
For neon, the maximum of the weak continuum occurs at approximately 280 nm, and there are bands of the second positive system of nitrogen and strong bands of the first negative system of nitrogen. According to Griegel et al. (Reference Griegel, Drotleff, Hammer and Petkau1990) a maximum of the third continuum of neon is near 100 nm. The intensity of the 308 nm band of OH in neon was approximately three times less of this band intensity in argon. It should be noted that the water vapor content in neon (10−4%) was three times less than in argon.
Figure 3 shows the emission spectra of the heteronuclear ionic molecules in the Ar–Xe, Ar–Kr, and Kr–Xe mixtures. The maxima of the bands of the heteronuclear ionic molecules are located at wavelengths of 329 and 506 nm (Ar–Xe), 491 nm (Kr–Xe), and 642 nm (Ar–Kr). Similar bands were previously observed in the electron beam excitation of the Ar–Xe, Ar–Kr (Kugler, Reference Kugler1964), and Kr–Xe mixtures (Friedl, Reference Friedl1959; Kugler, Reference Kugler1964). The molecular bands observed in the emission spectra of the paired mixtures of the rare gases have been identified (Tanaka et al., Reference Tanaka, Yoshino and Freeman1975) as the transitions between states of heteronuclear ionic molecules:
where the molecular states of M+N asymptotically correspond to the M+ + N states, and the state of MN+ to M + N+. Here, M and N are atoms of rare gases, and N is the heavier atom. If, in the low-pressure plasma, an electrical discharge in paired mixtures of rare gases observed up to 5 of these bands (Tanaka et al., Reference Tanaka, Yoshino and Freeman1975), at excitation by α-particles of the mixture of medium or high pressure (pump power W ~ 10−7–10−5 W/cm3) there are no transitions from the M+N ion levels, which corresponds to the states of atomic ions M+(2 P 3/2) (Millet et al., Reference Millet, Barrie, Birot, Brunet, Dijols, Galy and Salamero1981; Khasenov, Reference Khasenov2005, Reference Khasenov2006). With powerful pumping of an Ar–Xe mixture by the electron beam (W ~ 1 MW/cm3) (Laigle & Collier, Reference Laigle and Collier1983) except for the line 329 nm, lines at 345 and 349 nm were observed from the level of Ar+Xe corresponding to 2 P 3/2 state of Ar+. Apparently, this was due to mixing of the Ar+Xe levels at a high electron density.
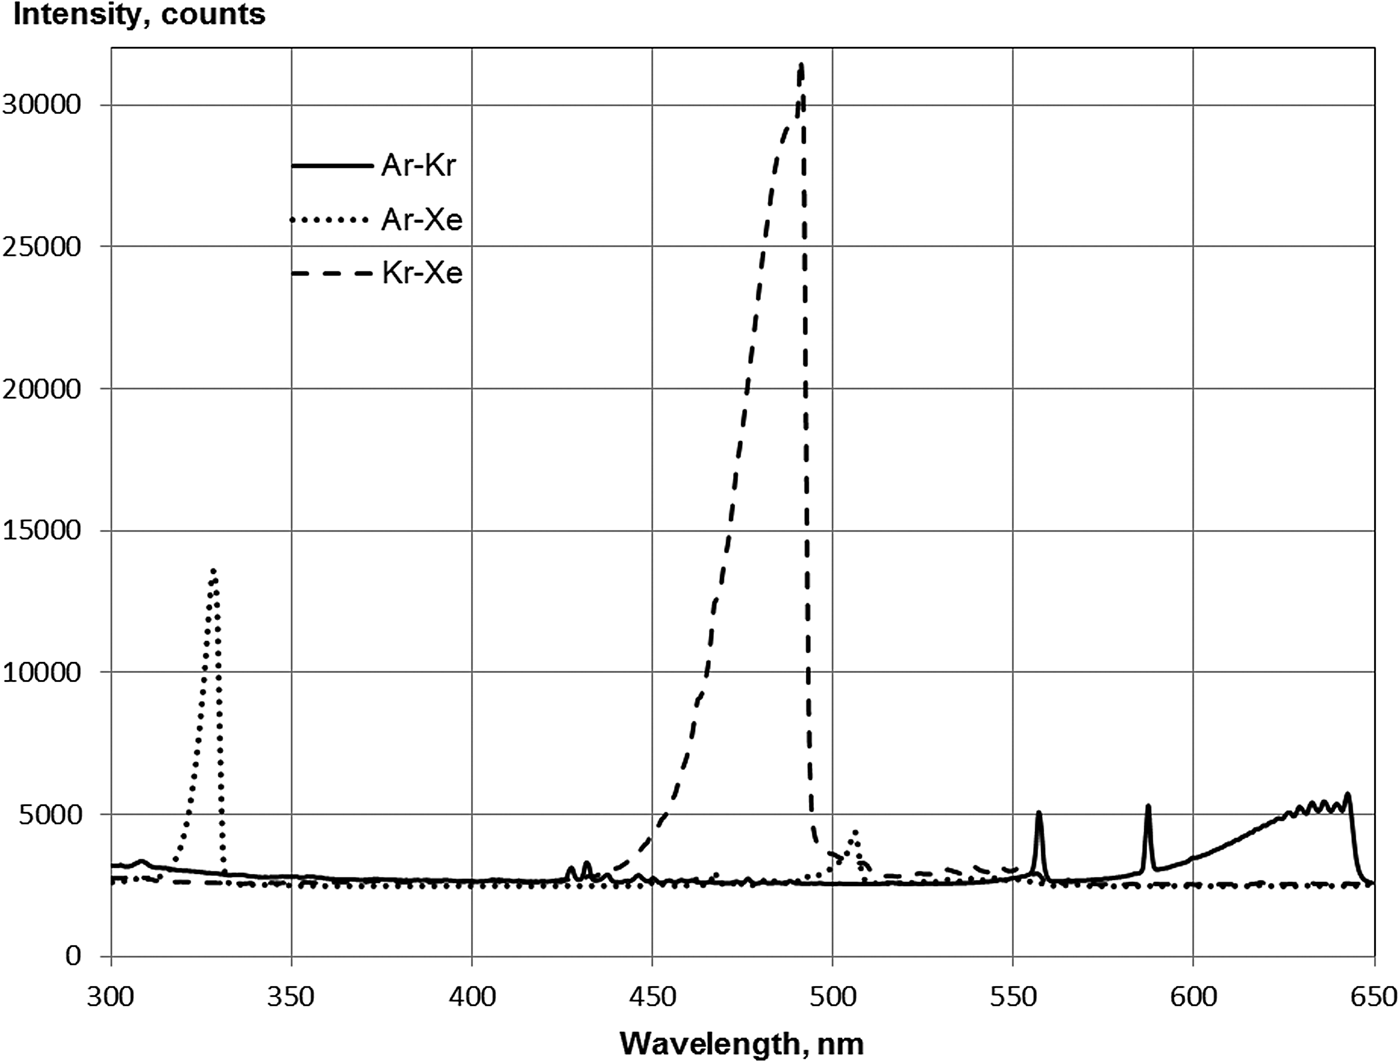
Fig. 3. Spectra of Ar(59.3 kPa)–Xe(6.7 kPa), Kr(53.3 kPa)–Xe(13.6 kPa) and Ar(53 kPa)–Kr(13.6 kPa) mixtures under argon beam excitation in the range of 300–650 nm. Integration time of spectrometer: 3s (Kr–Xe, Ar–Kr) and 1s (Ar–Xe).
Emission in 491 nm band is shown in the Kr–Xe mixture at a partial pressure of xenon of several hundred Pa (Fig. 4). At excitation by α-particles of polonium-210, the emission maximum in the 491 nm band was achieved at a Kr:Xe ratio of 1:1. At this ratio of components, approximately 11% of the power enclosed in the gas is converted to radiation in the previously mentioned band (Khasenov, Reference Khasenov2005).
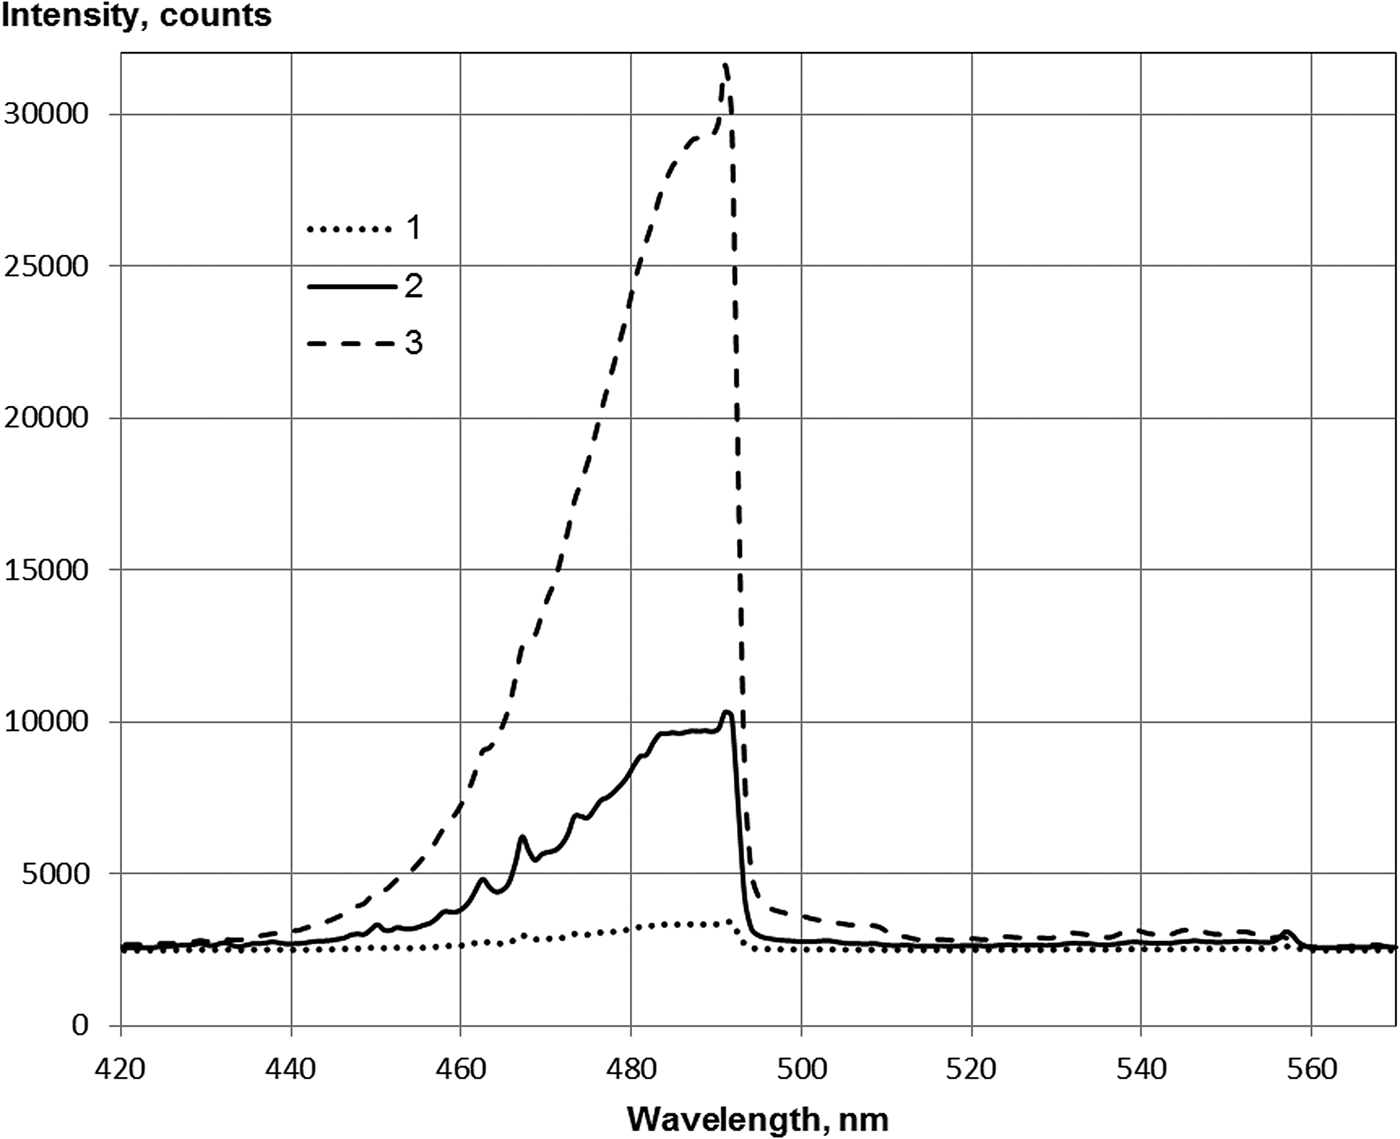
Fig. 4. Spectra of Kr–Xe under argon beam excitation in the range of 420–570 nm, a partial pressure of Kr of 53.3 kPa (1, 3) and 52 kPa (2) and a partial pressure of Xe of 0.67 kPa (1), 1.5 kPa (2), and 13.6 kPa (3).
4. ATOMIC SPECTRA
In helium, bands of the first negative system of nitrogen (391, 427 nm) were observed and were comparable with the intensity of the 31 D 2–21 P 1 transition line (667.8 nm), and weaker lines of helium at 501.6 nm (31 P 1–21 S 0), 587.5 nm (33 D–23 P), 706.5 nm (33 S 1–23 P), and 728.1 nm (31 S 0–21 P 1) were also observed.
Atomic lines in argon were only represented by the 4p–4s-transition (2p–1s in Paschen notation) lines, and the line at 777.4 nm referred to the atomic oxygen (Fig. 5). Line intensities corrected for the installation spectral sensitivity as well as the total intensity of the transitions from each of the 2p levels are shown in Table 1. In cases where the individual lines were outside the range of spectral sensitivity of the installation or were not resolved due to their proximity to stronger line, the total intensity of transitions from the level was determined from the measured intensities of the lines from this level, and the level lifetime value and transition probabilities given in (Radtsig & Smirnov, Reference Radtsig and Smirnov1986)
where I i is the line intensity, A i is the probability of optical transition, and τ is the level lifetime.
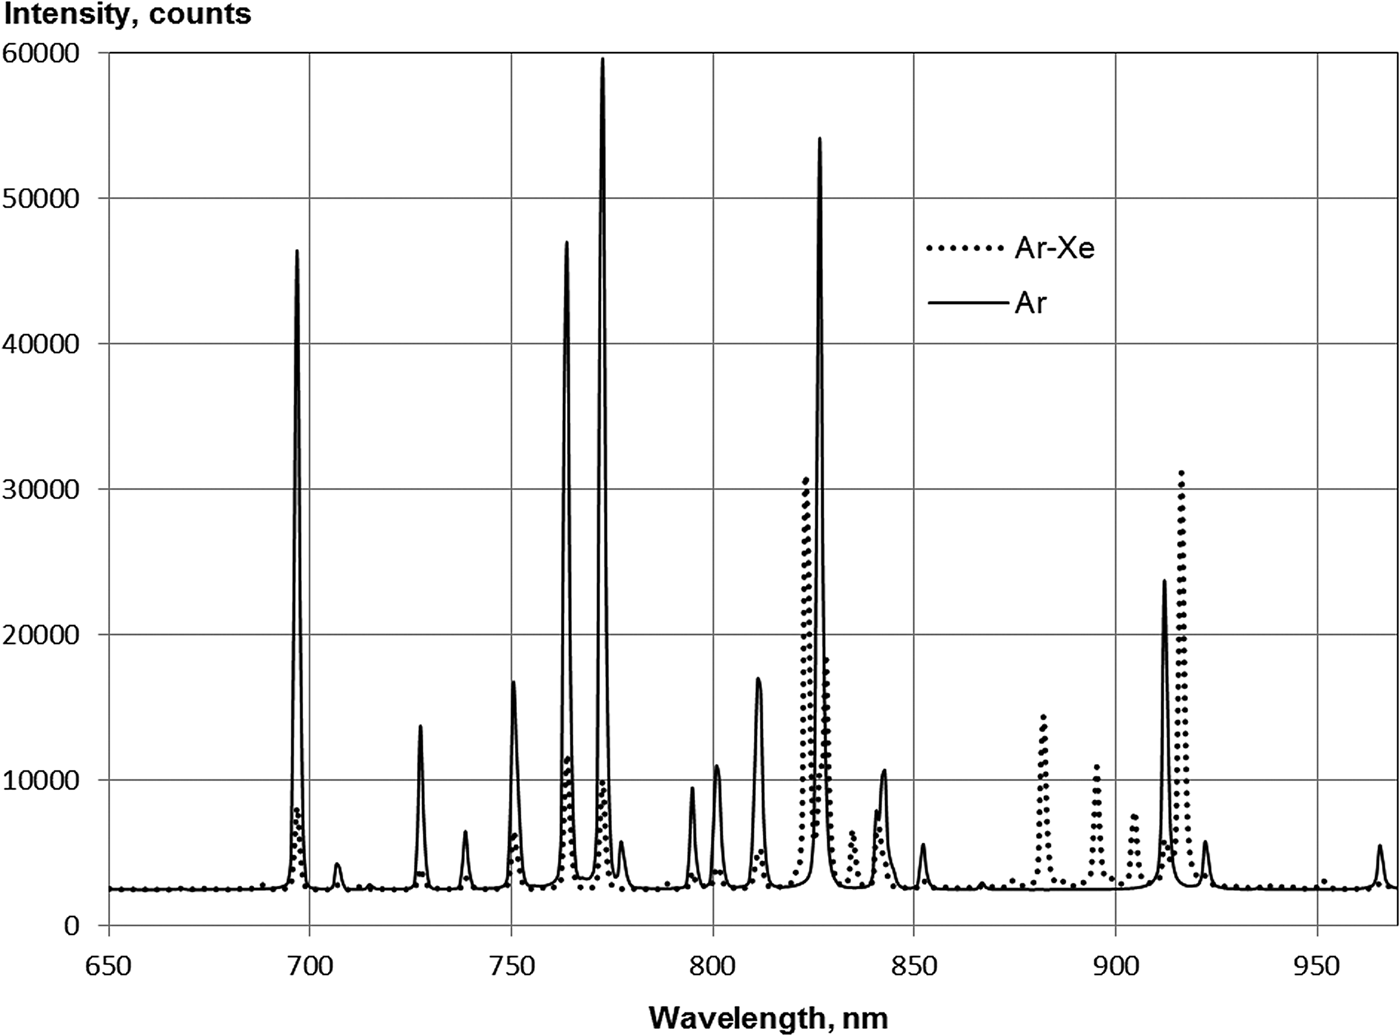
Fig. 5. Spectra of Ar(66.6 kPa) and Ar(65.3 kPa)–Xe(0.67) in the range of 650–975 nm. BK-7 glass lens.
Table 1. The intensity lines of the 2p–1s transitions of argon (79.6 kPa) and neon (80 kPa) excited by argon ions (relative units, corrected for the spectral sensitivity of the installation)
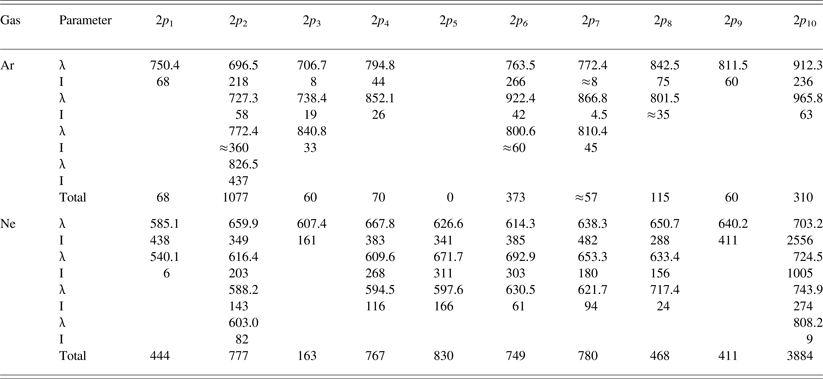
The spectrum of neon emission was dominated by lines from the 3p–3s transitions of atomic neon (2p–1s in the Paschen notation, see Table 1) in the near-infrared area of the 3d–3p transition lines. The atomic oxygen lines at 777.4 and 844.6 nm and a weaker line at 644.5 nm apparently refer to the 5s[3/2]2–3p[3/2]2 neon transition were observed. These experiments observed 27 of 30 spectral lines, which are from the 3p–3s neon atom transitions. The 747.2–868.2 nm regions contain 17 lines due to the 3d–3p neon transitions, and the total intensity of these lines is 10% of the intensity of the 3p–3s transitions.
The krypton emission spectrum is dominated by lines of the 5p–5s transitions of krypton atoms (Fig. 6, Table 2), and there are also very weak lines from the 6p–5s and the 6p–6s transitions of krypton at 427.4 and 432.0 nm, respectively, and the line of krypton's 5d[1/2]1–5p[1/2]1 transition (791.3 nm) was also observed.
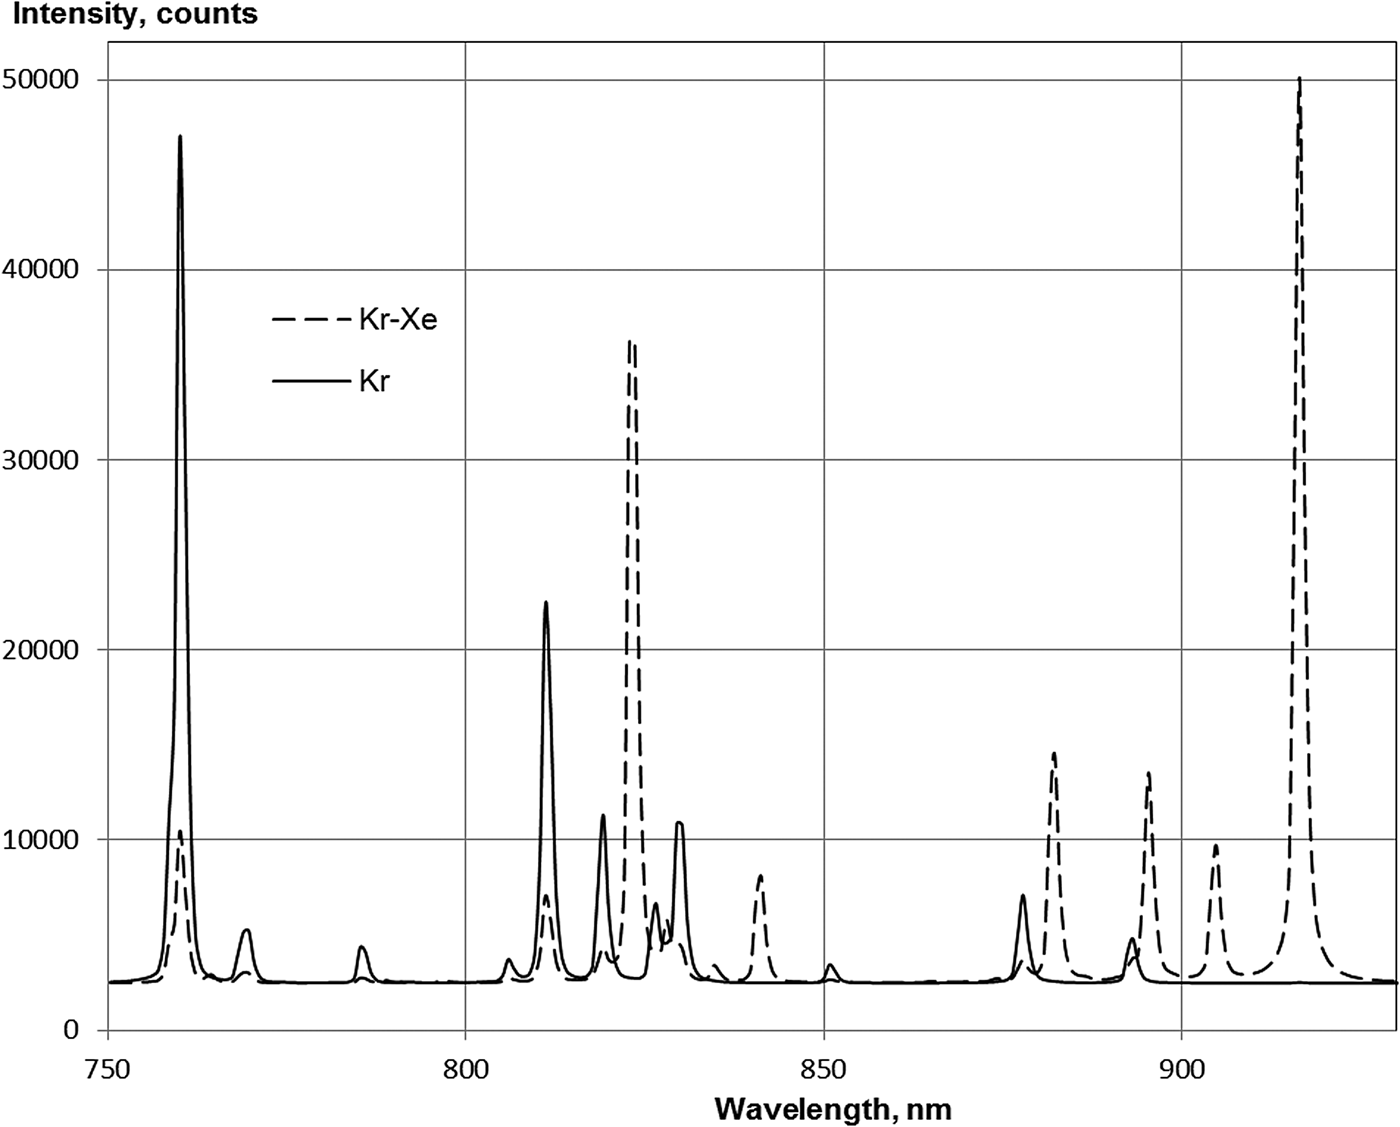
Fig. 6. Spectra of Kr(53.3 kPa) and Kr(52.6 kPa)–Xe(0.67 kPa) in the range of 750–930 nm. Integration time of spectrometer: 1s.
Table 2. The intensity lines of the 2p–1s transitions of krypton (80.6 kPa), xenon (30.7 kPa), and the lines of xenon in the Kr(52.6 kPa)–Xe(0.67 kPa) and Ar(65.3 kPa)–Xe(0.67 kPa) mixtures excited by argon ions (corrected relative units)

a The 828.1 nm line was not resolved due to the proximity of a strong line at 829.8 nm.
b The 758.7 nm line was not resolved due to the proximity of a strong line at 760.2 nm.
c The 810.4 nm line was not resolved due to the proximity of a strong line at 811.3 nm.
IR – transitions from the 2p 10 lie outside the spectral sensitivity.
In the xenon spectrum, in addition to the lines from the 6p–6s transitions of the xenon atom (see Table 2), there are transitions from the 7p, 7d, and 5f xenon levels demonstrating weak lines with an intensity of one or two relative units. The intensity of the line at 937.5 nm (4f–5d) was approximately eight relative units, and the total intensity of four lines from the 6d–6p transitions (890.9, 951.3, 968.5, and 971.8 nm) was 37 units.
A significant difference should be noted between the total intensity of the 2p–1s transitions for different gases at the same beam power value of the gas:
 $$\eqalign{& {\rm I(Kr,}\;{\rm 80}{\rm. 6}\,{\rm kPa)\!:\!I(Ar,}\;{\rm 79}{\rm. 6}\,{\rm kPa)\!:\!I} \cr & \quad {\rm (Xe,}\;{\rm 30,7}\,{\rm kPa,}\;{\rm 2}p_{{\rm 10}}\;{\rm level}\;{\rm excluding)\!:\!I(Ne,}\;{\rm 80}\,{\rm kPa)} \cr & \quad = {\rm 1\!:\!1}{\rm. 4\!:\!2}{\rm. 6\!:\!5}{\rm. 7}{\rm.}} $$
The spectra presented in Figures 5 and 6 show the high efficiency of the excitation transfer of argon and krypton to xenon atoms in the Ar–Xe and Kr–Xe mixtures. Nevertheless, the total emission intensity from the 2p xenon levels in the Kr–Xe mixture is twofold less than in pure xenon and, for the Ar–Xe mixture, the emission intensity was fourfold less (see Table 2).
5. DICUSSION AND CONCLUSIONS
The results obtained are not sufficient to identify the mechanisms at a level population. It is necessary to further investigate the infrared region of the spectrum and measure the spectral and temporal luminescence characteristics. However, some conclusions can be drawn from these results. The emission intensity distribution at the atomic 2p level (see Tables 1–3) is markedly different from the flow of the dissociative recombination of the molecular ions through the levels given in (Ivanov, Reference Ivanov1992). To a lesser extent, this applies to neon, and there is a more even distribution of intensity, a higher proportion of transitions from 2p 10 level is explained as a larger share of the recombination flow on this level (22%) and deactivation of the overlying levels by neon. For argon, a noticeable flow portion of the Ar2 + dissociative recombination falls on the 2p 9 level, whereas approximately half of the emission falls on the level 2p 2. For xenon, the emission partly goes from the level 2p 5, and this level accounts for only 4% of the Xe2 + ion recombination flow. For krypton, 19% of the Kr2 + recombination flow falls on the level 2p 2, and from this level, >5% of photons from the 2p levels are emitted. Apparently, the population of the 2p levels of the noble gas atoms occurs in the cascade transitions from the d levels (Khasenov, Reference Khasenov2014; Mel'nikov et al., Reference Mel'nikov, Sizov, Sinyanskii and Miley2015), and the dissociative recombination of the molecular ions with electrons is not the main process of the 2p atomic levels of the noble gas population.
The emission intensity distribution difference in the 2p levels for xenon in mixtures with argon and krypton from the distribution in pure xenon may be connected as to the different mechanisms at the population level for pure xenon and its mixtures, and the fact that the rate constant of deactivation of the xenon 2p 5 level with argon and krypton is 20–30 times greater than the value for atomic xenon (Xu & Setser, Reference Xu and Setser1990).
Table 3. Emission intensity distribution (in percentage) on the 2p levels of Xe in the xenon (30.7 kPa), Kr(52.6 kPa)–Xe(0.67 kPa), Ar(65.3 kPa)–Xe(0.67 kPa) mixtures, and 2p levels of Kr in the krypton(80.6 kPa) and Ar(59.3 kPa)–Kr(0.67 kPa) mixture

a The 811.5 nm line was not resolved due to the proximity of an argon line 811.3 nm (2p 9–1s 5).
ACKNOWLEDGMENTS
This work has been supported by the Ministry of Education and Science of the Republic of Kazakhstan (Grant No. 0681/GF4). The author is grateful to staff of the DC-60 accelerator for their assistance in conducting the experiments.


