

Recent studies of the Low-Back-Merger Shift (LBMS) suggest that it is playing an important structural role in many varieties of North American English. The LBMS is a vowel chain shift in the lower region of the vowel space, involving the movement down and back of dress, kit, and preoral bat as well as the merger of lot and thought.Footnote 1 As outlined by Becker, the current name and theoretical definition of this shift crucially depend on the hypothesis that front vowels shift in response to lot movement toward thought. The current notions of the LBMS raise key questions about how change occurs in vowel systems in general. New England is a key place to explore these questions since much of New England has been a longstanding location for the low-back merger.
In our fieldwork, we focused on North American English as spoken in majority White communities in Western Massachusetts. The dearth of prior work on this subregion of New England is likely due to its proximity and thus association with Boston/metropolitan Eastern Massachusetts—the hub of one of the most recognizable North American dialects—situated just one hour's drive away. Western Massachusetts, though, is very much unlike Boston, both socially and linguistically. Very limited data on nineteenth century Western Massachusetts English shows minimal Boston-associated features but the input conditions of Inland North speech, as it was a major provider of settlers to that area located just south of the North American Great Lakes (Boberg, Reference Boberg2001), while the limited data on twentieth century speech shows some evidence of the pan-American LBMS (Boberg, Reference Boberg2001; Labov, Ash, & Boberg, Reference Labov, Ash and Boberg2006). The present paper provides the largest acoustic sociophonetic analysis of Western Massachusetts phonology to date (fifty-nine speakers aged 18–89, forming a dataset of 9,984 tokens of stressed vowels). We track the progression of these three vowel configurations: (1) traditional Boston-influenced New England features (e.g., Boberg, Reference Boberg2001, Reference Boberg2010; Carver, Reference Carver1987; Dinkin, Reference Dinkin and Wagner2005; Johnson, Reference Johnson2010; Kurath, Reference Kurath1939; Labov et al., Reference Labov, Ash and Boberg2006; Nagy, Reference Nagy2001; Nagy & Irwin, Reference Nagy and Irwin2010; Nagy & Roberts, Reference Nagy, Roberts, Schneider, Burridge, Kortman, Mesthrie and Upton2004; Roberts, Reference Roberts2006, Reference Roberts2007, Reference Roberts2016; Stanford, Reference Stanford2019); (2) the Northern Cities Shift (NCS) of the Inland North (Labov, Yaeger, & Steiner, Reference Labov, Yaeger and Steiner1972); and (3) the LBMS (Becker, Reference Becker2019). The data show evidence of all three systems in this area. The results suggest that Inland Northern (NCS) features in Western Massachusetts have been receding since the mid-twentieth century, but not toward the nearby Boston-related features. Rather, Western Massachusetts is moving toward the supralocal LBMS.
While our Western Massachusetts results nicely confirm the overall LBMS configuration that Becker (Reference Becker2019) and Boberg (Reference Boberg and Becker2019b) predicted for regions with the low-back merger, our results suggest a different chronology: in this region, movement toward the low-back merger was not the initial component of the LBMS. This finding suggests that, although disparate communities across North America might come to adopt the same vocalic system, the temporal ordering need not be uniform. Instead, we observe that the ordering may sometimes be conditioned by sociosymbolic meaning of certain individual components of the older system within the local social context. Our results also suggest that the LBMS may be even more advanced in New England than in locales where this configuration is most often observed.
These findings are interpreted against the backdrop of the possible social motivations for LBMS adoption in Western Massachusetts, that is, maintenance of standard/“nonaccented” speech, especially in contrast to Boston and the rest of urban eastern Massachusetts. As a speaker from Springfield told us, “We say things right [here in Western Mass.], and they don't [in the east].” Becker hypothesized that sociosymbolic meaning of LBMS components might condition the magnitude of some LBMS vowel movements and their rates of change (Reference Becker2019:18–19). Citing Boberg (Reference Boberg and Becker2019b) and other studies in the Becker (Reference Becker2019) collection, Becker noted that local social meanings can “reinforce, amplify, or even accelerate the trajectory of sound change,” and can also have an “inhibiting effect” that reduces the pace of change (Reference Becker2019:19). We concur with these perspectives, but our study goes a step further by proposing that such local social meanings can even reverse the key temporal ordering of a vowel shift. Thus, our paper contributes to the ongoing discussion of how disparate communities develop the same vocalic system.
PRIOR WORK IN SOUTHWESTERN NEW ENGLAND
Much of Western Massachusetts is defined as being part of a Southwestern New England (SWNE) dialect area (Dinkin, Reference Dinkin and Wagner2005; Kurath, Reference Kurath1939; Kurath & McDavid, Reference Kurath and McDavid1961). The Linguistic Atlas of New England (LANE, Kurath et al., Reference Kurath, Hanley, Bloch, Lowman and Hansen1939–43) reports on 1930s fieldwork throughout New England. Based upon postvocalic /r/, palm/start fronting, “broad-a” bath, and other features, Kurath (Reference Kurath1939) noted a significant east-west divide in New England that runs northward from the beginning of the Connecticut River in Connecticut and along the Green Mountains of Vermont to the Canadian border. This east-west boundary places Maine, New Hampshire, eastern Vermont, eastern Massachusetts, Rhode Island, and eastern Connecticut in the ENE dialect area, while western Vermont, western Massachusetts, and western Connecticut are in the Western New England (WNE) dialect area. This east-west divide matches Mathews’ (Reference Mathews1962) examination of New England settlement history. Kurath (Reference Kurath1939) also identified a north-south division in New England, leading to the distinction of four separate dialect areas (Kurath, Reference Kurath1949, fig. 3; Kurath & McDavid, Reference Kurath and McDavid1961: map 2; cf., Carver, Reference Carver1987).
Two later studies examined subregions within New England—Boberg (Reference Boberg2001) and Labov et al. (Reference Labov, Ash and Boberg2006)—and corroborated the four-way divide in this region, using data from the Telsur Project, a North American telephone survey of 762 informants from 1992–99. Focusing specifically on data from seven WNE speakers, Boberg (Reference Boberg2001) determined that the north-south divide in Western New England was still intact such that there was a distinct northern variety (NWNE), which encompassed Vermont, and a southern variety (SWNE), which encompassed western Connecticut and western Massachusetts. Boberg (Reference Boberg2001) used the low-back merger as a key variable in making these distinctions between subregions, suggesting that WNE was the “staging ground” for the Northern Cities Shift, as discussed below. Shortly after, the Atlas of North American English (ANAE; Labov et al. Reference Labov, Ash and Boberg2006) also showed a four-way partition of New England, based on twenty-three Telsur informants from New England (see Figure 1). We notice that, like Boberg (Reference Boberg2001), the ANAE analysis places Western Massachusetts squarely within the SWNE dialect area (see also Boberg, Reference Boberg, Boberg, Nerbonne and Watt2018; Nagy & Roberts, Reference Nagy, Roberts, Schneider, Burridge, Kortman, Mesthrie and Upton2004).

Figure 1. New England regions according to the ANAE map 16.4 as adapted by Charles Carson in Stanford, Leddy-Cecere, & Baclawski (Reference Stanford, Leddy-Cecere and Baclawski2012, Fig. 3, American Speech). Black dots indicate a fronted start. Used with permission.
SOUTHWESTERN NEW ENGLAND FEATURES
Traditional New England Features
In LANE (Dinkin, Reference Dinkin and Wagner2005; Kurath, Reference Kurath1939), ENE features included the fronting of palm to [a:] (in words like father and spa) in contrast to lot (in words like sock and top), fronting of start to [a:] (in words like sharp and heart), r-lessness, the three-way distinction between marry (e.g., Larry and carry), merry (e.g., berry and cherry), and mary (e.g., scary and hairy), as well as the merger of lot (e.g., sock) and thought (e.g., caught). WNE was characterized by r-fulness, the absence of start/palm-fronting,Footnote 2 either complete or partial merger of mary, marry, and merry, and lot-thought distinction. Fifty years later, ANAE/Telsur data reveal a north-south distinction in WNE whereby start-fronting and lot-thought merger appear to have spread to NWNE (Labov, Ash, & Boberg, Reference Labov, Ash and Boberg2006: figures 56, 231). Though Stanford's (Reference Stanford2019:7–8) analysis of New England speech found the same general patterns among older speakers, that project showed that many traditional ENE features like r-lessness and start/palm-fronting are receding in northern New England, thus weakening the traditional east-west line of contrast. In the ‘Hub’ of New England (metropolitan Eastern Massachusetts), such features remain strong in some neighborhoods, such as South Boston, but are realized in different ways when intersecting with other social and demographic factors. The traditional ENE regional features are selectively adopted in the Black Boston communities (Browne & Stanford, Reference Browne, Stanford, Kodner and Wade2018; Nesbitt, Watts, & Stain, Reference Nesbitt, Watts and Stain2021; Stanford, Reference Stanford2019:182–95). Likewise, these features are waning most rapidly for upper class White speakers inside the ‘Hub’ and in communities furthest away from the Hub. Thus, there is substantial evidence that some traditional NE features are not stable even in the Hub area and are likely waning in other NE locales. Given the literature, then, in Western Massachusetts we might expect to find variability or change-in-progress involving some of the features attested therein. Figure 2 shows the current status of the lot-thought merger, based on acoustic sociophonetic analysis of the audio recordings elicited from New Englanders online via Mechanical Turk (Kim, Reddy, Stanford, Wyschogrod, & Grieve, Reference Kim, Reddy, Stanford, Wyschogrod and Grieve2019; Stanford, Reference Stanford2019:89).

Figure 2. Current status of the lot-thought merger based on a prior study that elicited online audio recordings for acoustic sociophonetic analyses. Speaker mean F1/F2 Euclidean distances between lot-thought for 588 speakers (14,474 tokens), plotted in quartiles. Darker dots indicate smaller Euclidean distance. Reproduced from Stanford (Reference Stanford2019:89, Fig. 4.7) with permission of Oxford University Press.
In those results, we note that the overall lot-thought pattern is quite similar to Labov et al. (Reference Labov, Ash and Boberg2006) (recall our Figure 1 above), but we also see that Western Massachusetts is a transitional region worthy of more focused local fieldwork, as undertaken in the present study.
Vowel Shifts in Western New England
There is also evidence that two of the three major North American vowel chain shifts (Labov, Reference Labov and Eckert1991) —the Northern Cities Shift and the LBMS—are present in Western New England. The Northern Cities Shift (NCS) is a rotation of six short vowels in North American English (Eckert, Reference Eckert1988; Labov, Reference Labov1994, Reference Labov2010; Labov et al., Reference Labov, Yaeger and Steiner1972; inter alia). The “input” or “pivot point” conditions of the NCS are that bat remains unsplit into tense and lax subclasses, and that lot and thought are distinct phonemes (Labov, Reference Labov and Eckert1991; Labov et al., Reference Labov, Ash and Boberg2006). After these conditions are met, the NCS proceeds as a chain shift whereby bat raises and fronts, lot shifts forward to occupy the vacated space, thought lowers, dress lowers, and/or backs, as displayed in Figure 3, though in some NCS localities the NCS proceeds as a push chain whereby lot shifting precedes bat shifting. Some accounts also find that advanced forms of the shift include strut-backing and kit-lowering and backing (see, e.g., Eckert, Reference Eckert1988; Labov et al., Reference Labov, Ash and Boberg2006). The NCS is characteristic of the Inland North dialect area (Labov et al., Reference Labov, Ash and Boberg2006), which sits just south of the Great Lakes and extends from southeastern Wisconsin eastward to upstate New York and is observed as far south as the St. Louis corridor in Illinois (Labov et al., Reference Labov, Ash and Boberg2006). Major NCS cities include Buffalo, Detroit, and Chicago.

Figure 3. A typical Northern Cities Shift vowel configuration.
Westward expansion out of New York state into Inland Northern cities began in 1825 with the opening of the Erie Canal, while expansion out of WNE into New York state began several decades prior (Boberg, Reference Boberg2001; Kurath, Reference Kurath1939; Labov, Reference Labov2010:114–18; Labov et al., Reference Labov, Ash and Boberg2006). This settlement history is important because little is known about when and where the NCS was initiated, that is, before or after westward expansion. Based on his observations about unsplit bat-raising and lot-fronting away from thought in Telsur, Boberg (Reference Boberg2001) provided a compelling argument for the former. According to descriptions of fieldwork transcriptions, Kurath (Reference Kurath1939) and Kurath and McDavid (Reference Kurath and McDavid1961) found that lot and thought were merged in ENE but distinct classes in WNE. Little is offered in a description of bat except for in isogloss maps where it is shown as low-front /ae/ even before nasals. Therefore, only the “pivot” conditions of the NCS were observed in LANE. Boberg's (Reference Boberg2001) thorough acoustic analysis of bat, lot, and thought in the Telsur data found a north-south divide for lot-thought such that merger defined NWNE, but not SWNE. He also showed that many WNE speakers, especially those in SWNE, exhibited bat-raising. The appearance of bat-raising in SWNE since LANE is either an indication that this feature was overlooked during LANE fieldwork transcription or that it is an early twentieth century innovation. Boberg contended it must be the latter because bat-raising is not correlated with age in his sample, which is expected during a change in progress (Boberg, Reference Boberg2001:19). Thus, as Labov described it, “the [NCS] match was struck by builders of the Erie Canal, but the timber that burned was grown in New England” (Reference Labov2010:118). Crucially, though bat-raising was a later phenomenon, the “pivot” conditions of the NCS (unsplit bat and lot-thought distinction) must have been intact in SWNE at around the time of westward expansion (at the turn of the nineteenth century). If the NCS was indeed a change in progress in Western Massachusetts, we would expect to find that it has progressed beyond bat-raising in a present-day analysis. Bause (Reference Bause2014) also found evidence that the NCS is a twentieth century innovation in their analysis of the NCS in Amherst, MA. In a sample of twenty-three speakers born between 1922 and 1993, the “pivot points” are characteristic of all speakers born before the 1980s, while bat-raising is only characteristic of speakers born in the 1950s to 1970s. A shift away from NCS features—lot-thought merger, bat-backing, and dress-lowering—is observed from those born in the 1980s and onward.
As Boberg (Reference Boberg2001) pointed out, the development of lot-thought merger and bat-lowering in NWNE is suggestive of the emergence of the LBMS in New England. The LBMS has previously been called the “Third Dialect” (Labov, Reference Labov and Eckert1991), the “Canadian Shift” (Clarke, Elms, & Youssef, Reference Clarke, Elms and Youssef1995), and the “Elsewhere Shift” (Fridland & Kendall, Reference Fridland, Kendall and Farrington2014). The “input” or “pivot point” conditions of the LBMS are a subphonemic split of bat into tense (before nasals) and lax (all other environments) subclasses, and movement toward lot-thought merger (Labov, Reference Labov and Eckert1991; Labov et al., Reference Labov, Ash and Boberg2006). Schematized in Figure 4, the LBMS also involves the retraction and lowering of dress, kit, and preoral bat (Boberg, Reference Boberg2001; Clarke, Elms, & Youssef, Reference Clarke, Elms and Youssef1995; Labov, Reference Labov and Eckert1991; Strassel & Boberg, Reference Strassel and Boberg1996; inter alia).

Figure 4. LBMS vowel configuration.
Originally described as independent chain shifts in California and Canada (Clarke, Elms, & Youssef, Reference Clarke, Elms and Youssef1995; Labov et al., Reference Labov, Ash and Boberg2006), the LBMS has come to be called a pan-American phenomenon (Becker, Reference Becker2019; Boberg, Reference Boberg and Becker2019b) due to its appearance across North America. Outside of the U.S. West and Canada, recent analyses find some combination of low bat and movement toward lot-thought merger in the U.S. Midland (Bigham, Reference Bigham2008, Reference Bigham, Gorman and MacKenzie2010; Durian, Reference Durian2012; Kohn & Stithem, Reference Kohn and Stithem2015; Strelluf, Reference Strelluf2014, Reference Strelluf and Becker2019), in Alaska (Bowie, Bushnell, Collins, Kudenov, Meisner, Ray, Scotland, Valentine, Driscoll, Joehnk, & Kubitskey, Reference Bowie, Bushnell, Collins, Kudenov, Meisner, Ray, Scotland, Valentine, Driscoll, Joehnk and Kubitskey2012), the American South (Stanley, Reference Stanley2019), and also in the Inland North dialect area (Dinkin, Reference Dinkin2009; Driscoll & Lape, Reference Driscoll and Lape2015; Kapner, Reference Kapner2019; King, Reference King2017; McCarthy, Reference McCarthy2011; Morgan, Deguise, Acton, Benson, & Shvetsova, Reference Morgan, Deguise, Acton, Benson and Shvetsova2017; Nesbitt, Wagner, & Mason, Reference Nesbitt, Wagner, Mason and Becker2019; Rankinen, Albin, & Neuhaus, Reference Rankinen, Albin and Neuhaus2019; Wagner, Mason, Nesbitt, Pevan, & Savage, Reference Wagner, Mason, Nesbitt, Pevan, Savage and Jeoung2016). And as we noted above, the LBMS appears to be spreading throughout Western New England.
We have already discussed the appearance of LBMS in NWNE in the generations between LANE and Telsur, but there is also some evidence, albeit based on just three speakers, that it may be spreading to Western Massachusetts. In Boberg's (Reference Boberg2001) analysis, all three Western Massachusetts speakers exhibited a reduction in the contrast between lot and thought in both perception and production. Likewise, the two older speakers (both over sixty years old) had raised bat, while the youngest speaker did not (Boberg, Reference Boberg2001:23–24). Boberg postulates that these changes may suggest that in the generations from LANE to Telsur, a change in progress from NCS to LBMS was underway in Western Massachusetts, which might be progressing to the present day. Further support for this hypothesis can be observed in Figure 2 above, where lot-thought ranges from being merged to distinct in Western Massachusetts (based on Stanford, Reference Stanford2019:89 figure 4.7 & 111 figure 4.20). In this SWNE region, there is also considerable variability in Stanford's (Reference Stanford2019) maps with respect to some traditional NE features such as mary/marry/merry (101 figure 4.13) and palm-fronting (109 figure 4.19), but not others, for example, r-fulness (96 figure 4.9) and no start-fronting (108 figure 4.18). No observations about bat in Western Massachusetts were made in that prior work. In that dataset, the variability with respect to NCS, LBMS, and traditional New England features in Western Massachusetts, in contrast to the more uniform results elsewhere in New England, suggests that either the variability in Western Massachusetts observed by Kurath (Reference Kurath1939) has persisted into the twenty-first century or that these features have been experiencing rapid changes.
In this paper, we include an analysis of NCS and LBMS participation in SWNE beyond the two “pivot points,” to determine how advanced these shifts are and to provide an account of the temporal ordering of the features therein. Boberg (Reference Boberg2019a) and Becker (Reference Becker2019) put forward a method for quantifying LBMS participation beyond calculating bat-raising and lot-thought, which we will utilize for the current analysis. This method does not consider palm movement, though an analysis of this vowel class will prove to be important in Western Massachusetts. Boberg (Reference Boberg2010:155) argued that short front vowel movement in New England is prevented by the independence of palm from lot-thought. Indeed, the explanation for the blockage of the LBMS in Cape Breton put forward by Roeder and Gardner (Reference Roeder, Gardner and Freeman2013) is the existence of a palm class in central position, blocking trap movement. Based upon this, we might surmise that, for New England, the only way that the LBMS could emerge is the movement of palm back toward thought. Therefore, we include palm in our analysis of LBMS participation in Western Massachusetts. palm was not included in the Becker (Reference Becker2019) volume because palm was presumably already merged with lot in all of the communities explored therein. Exploring all of the components of the LBMS beyond the “pivot points” is especially important, as scholars are actively trying to track where it is observed and its temporal ordering across North America.
METHODS
Elicitation Methods and Speakers
Our Western Massachusetts speakers come from what is locally called the “Lower Valley of the Connecticut River” or “Pioneer Valley.” Within this region, we focused on the city of Greenfield and neighboring towns in the north, and Springfield and neighboring towns in the south, rather than the central region, the Amherst-Northampton area, which is an academic cultural “bubble” that houses five colleges. Because of this “strong academic influence” (Bause, Reference Bause2014) and a transient seasonal residence of college students, faculty, and staff from other states, and so on, we considered this central region less representative of Western Massachusetts as a whole, especially from a longer-term historical perspective, so we did not conduct fieldwork there. The Kurath (Reference Kurath1939) analysis of the Pioneer Valley was divided such that the southern section was part of WNE, while the northern portion was classified as ENE. We do not separate the two locales in this paper as we found no significant difference in our regression models between them.
During March-June 2019, a group of Dartmouth students and faculty conducted field trips to these regions in Western Massachusetts. We randomly approached potential interviewees on sidewalks, shops, and parks. In order to introduce ourselves and quickly locate people from the region, our opening statement was, “Excuse me, are you from around here?” Following Labov (Reference Labov1966:107), we targeted speakers who were raised in the region. If the person responded affirmatively, we confirmed that they were raised since early childhood in Western Massachusetts and then invited them to participate in our recorded interview, approximately 10–15 minutes, using handheld Edirol/Roland R-05 recorders (WAV format, 16-bit resolution, 44.1K sampling rate). In addition, we conducted several interviews with residents of local retirement communities. In total, we interviewed fifty-nine speakers, ages 18–89, balanced for binary gender, overwhelmingly White in ethnicity. The interview activities included a word list, a list of sentences, a short reading passage, and a series of discussion questions about the person's background and attitudes toward the local area and other nearby regions. We concluded the interviews by asking respondents for their perspectives on local dialect features and for examples of particular pronunciations or words that they viewed as distinctive to their region.
Data processing
Using Praat, we manually annotated TextGrids by transcribing the different speech styles for each speaker and then aligned and extracted the vowel formants using the semi-automated features of DARLA (Dartmouth Linguistic Automation, darla.dartmouth.edu, Reddy & Stanford, Reference Reddy and Stanford2015a-Reference Reddy and Stanfordb). DARLA is a user-friendly online interface that runs the Montreal Forced Aligner for alignment (McAuliffe, Socolof, Mihuc, Wagner, & Sonderegger, Reference McAuliffe, Socolof Michaela, Sarah, Michael and Sonderegger2017), and FAVE-Extract for vowel extraction (Rosenfelder, Fruehwald, Evanini, Seyfarth, Gormann, Prichard, & Yuan, Reference Rosenfelder, Fruehwald, Evanini, Seyfarth, Gorman, Prichard and Yuan2014). The F1 and F2 measurements were extracted in DARLA with FAVE-Extract, which uses the standard FAVE extraction points and methods described in detail in Labov, Rosenfelder, and Fruehwald (Reference Labov, Rosenfelder and Fruehwald2013:35–36). Such FAVE alignment and extraction methods have been tested and found effective in Evanini (Reference Evanini2009:92), Evanini, Isard, and Liberman (Reference Evanini, Isard and Liberman2009), Labov et al. (Reference Labov, Rosenfelder and Fruehwald2013:38), Stanford, Severance, and Baclawski (Reference Stanford, Severance and Baclawski2014:111–112, 140), and Severance, Evanini, and Dinkin (Reference Severance, Evanini and Dinkin2015). See also Gonzales, Grama, and Travis (Reference Gonzalez, Grama and Travis2019) and MacKenzie and Turton (Reference Laurel and Danielle2020), which show the effectiveness of the Montreal Forced Aligner, along with testing of other alignment methods. We normalized with the Lobanov method (Reference Labov, Rosenfelder and Fruehwald1971), which is a well-regarded speaker-intrinsic normalization method commonly used in sociolinguistics (Johnson & Durian, Reference Johnson, Durian and Hickey2017; Thomas, Reference Thomas2011; Thomas & Kendall, Reference Thomas and Kendall2007), making our results directly comparable with other speaker-intrinsic datasets that do not depend on any particular group mean.
Tokens from the relevant vowel classes (bat, dress, fleece, kit, strut, mary, marry, merry, lot, palm, start, thought) were extracted for the current analysis. Tokens of lot, bat, dress, fleece, kit, strut, and thought that preceded a sonorant were excluded, as vocalic items that occur before these segments behave differently than they do in other phonological environments in American English, for example, fronting of vowels before /l/ (cf., Labov et al., Reference Labov, Ash and Boberg2006). Function words and items that did not occur in a stressed syllable were also excluded. Each of the vowel classes is represented at least four times for each speaker in the sample. The resulting data set contained 9,984 vowel tokens for subsequent data analysis.Footnote 3
Statistical Approaches
Tokens of speaker Lobanov-normalized F1 and F2 measurements were submitted to linear mixed-effects regression models using the lme4 package in R (Bates, Maechler, Bolker, Walker, Marin, & Walker, Reference Bates, Mächler, Bolker and Steven2014) for each of the major vowel classes involved in the three vowel configurations under consideration in this paper. Age was included in each model as a fixed effect, along with gender and socioeconomic status, as well as phonetic environment. Lexical item and speaker were included as random intercepts. These statistical analyses test the hypothesis that the NCS and traditional New England features are waning in Western Massachusetts while the LBMS is taking hold. Best-fit models were selected by statistical comparison of models in R. As for features that go beyond two-dimensional F1/F2 measurements, we recognize that other measures, such as duration, nasalization, trajectory, and various other spectral measures, can contribute to perception and production of vowel mergers and shifts (e.g., Farrington, Kendall, & Fridland, Reference Farrington, Kendall and Fridland2018; Fridland, Kendall, & Farrington, Reference Fridland, Kendall and Farrington2014).
Low-Back Mergers
To quantify the distance between thought and palm and lot, Pillai-Bartlett statistic values were calculated for each speaker in the sample. The Pillai-Bartlett statistic measures the degree of overlap in F1/F2 space between categories (Hall-Lew, Reference Hall-Lew2010; Hay, Warren, & Drager, Reference Hay, Warren and Drager2006). Following Hall-Lew (Reference Hall-Lew2010), we calculated this statistic as an output from multivariate analysis of variance (MANOVA) models fitted on F1 and F2 measurements by vowel class for each speaker. Two Pillai-Bartlett statistics were calculated for each speaker in the sample: one to measure the amount of overlap between lot and thought, and another to measure the amount of overlap between thought and palm. These values were then submitted to two separate linear mixed-effects regression models, where age was included as a fixed effect, and speaker was included as random intercept.
LBMS Index
To quantify the position of the short front vowels in the vowel space, we follow Boberg (Reference Boberg2019a) and Becker (Reference Becker2019) and utilize the Short Front Vowel Shift Index. For each speaker in the sample, this index score was calculated as the average of the Euclidean distances (ED) between fleece and the three short front vowels kit, bat, and dress. As with the F1, F2, and Pillai-Bartlett measures, the LBMS index scores were submitted to a linear mixed-effects regression model with age included as a fixed effect and speaker as a random intercept.
RESULTS
Graphical overview of the changing vowel systems
Before examining individual vowel movements statistically, we begin with a holistic graphical view of changes to the vowel space, highlighting how the individual vowels are indeed part of entire systems of structurally related components. In the following two graphical illustrations, we examine vowel spaces contrastively in terms of older speakers versus younger speakers. From a systems-level perspective, these vowel plots provide an initial “road map” perspective of the systematic changes-in-progress in terms of the full vowel space.
In Figures 5–6, we compare the aggregate vowel space of the five oldest speakers in our sample—those born in the 1930s (Figure 5)—to that of the five youngest speakers born in the 2000s (Figure 6). For speakers born in the 1930s (Figure 5), we find a configuration that resembles that described in the literature for locales in WNE: a hybrid of Northern Cities Shift and ENE features. As expected in SWNE and as part of the NCS, we observe that lot is separate from thought and marks the lowest and near-center point of the vowel space. We also find advanced raised and fronted bat compared to dress. This advanced feature of the NCS is unexpected because it was not observed in any of the WNE speakers’ vowel spaces in the ANAE. We also see for these older speakers bat's close proximity to ban, approximating the NCS continuous configuration. Though these two “pivot points” of the NCS appear intact and rather advanced for these 1930s speakers, evidence of later NCS stages is minimal in this configuration. Though lot does appear very close to strut in the F2 dimension, as described for WNE speakers in the ANAE, lot does not appear directly under or in front of strut as it is for advanced ANAE speakers. Likewise, though dress has lowered below strut and in line with thought, dress and lot do not appear in close proximity in the F2 dimension. Kit-lowering and retraction is also absent for these speakers as it sits at the periphery with merry, mary, and ban.
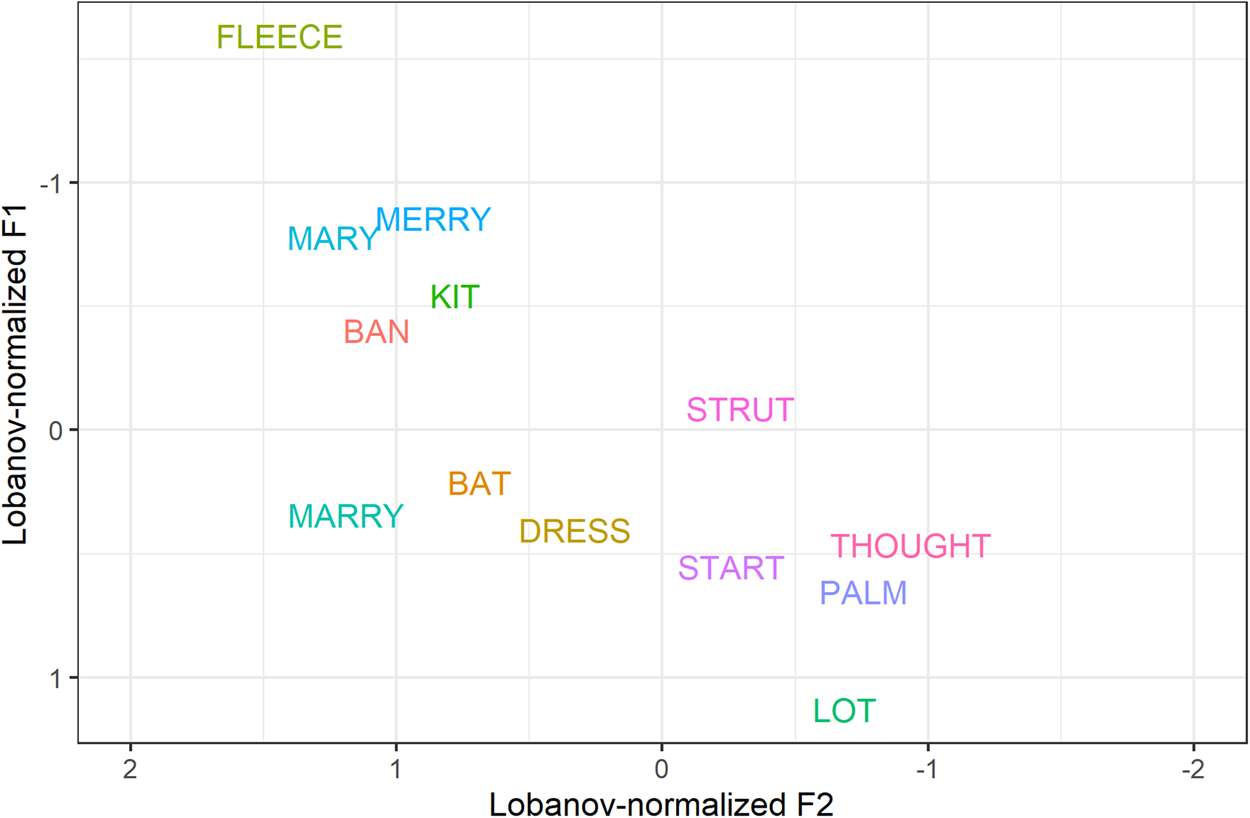
Figure 5. Oldest speakers: Front and low vowel space representing average vowel class values for the five oldest speakers (1930s birth years) in the current Western Massachusetts sample.

Figure 6. Youngest speakers: Front and low vowel space representing average vowel class values for the five youngest speakers (2000s birth years) in the current Western Massachusetts sample.
To round out the description of the vowel space of speakers born in the 1930s, we turn to the ENE features. This indicates that ENE features have had a wider regional reach in Massachusetts than a cursory reading of boundaries in prior work might suggest. First, there is a clear distinction of marry from merged merry-mary, which is one of the configurations attested in Dinkin's (Reference Dinkin and Wagner2005) SWNE isogloss from LANE. Another unexpected feature is the fronting of start away from lot, which is a feature attested in the rest of NE but not SWNE, where start is expected to be identified with lot (see ANAE Map 16.4 as reprinted in our Figure 1 above). Overall, the configuration of these 1930s Western Massachusetts vowels resembles an inverted triangle with its point, lot, skewed to the right. We find the two “pivot points” and a later stage of the NCS, as well as remnants of ENE features in this system.
The contemporary Western Massachusetts vowel space, represented by the younger speakers displayed in Figure 6, resembles the inverted triangle of the pan-American LBMS. In this configuration, start, palm, and lot have moved up and back to merge with thought, making up the low-back region of the vowel space. Interestingly, we see that this is the opposite of what was observed for the three western Massachusetts speakers in Boberg (Reference Boberg2001), where thought had moved down to merge with lot. We also find that, in the contemporary Western Massachusetts system, bat now marks the apex of the inverted triangle and sits directly below dress. The lowering and retraction of bat appears to be the most advanced change in the community for speakers born since the 1930s. We thus see evidence for the nasal system for bat/ban in this community. dress, kit, and strut have all also lowered and retracted to some extent.
In this initial overview, what we have seen in Western Massachusetts for birth years from the 1930s to the 2000s (Figures 5–6) is a reorganization of the vowel space. We find a merger in the mid-front and low-back quadrant, and the centralization of bat, dress, and kit, so that the historical Western Massachusetts system with regional features (moderate NCS vowel configuration with layerings of NE features) has been jettisoned in favor of the supralocal LBMS configuration. Now that we have outlined this transition in vowel configurations from a graphical perspective contrasting two age groups, we turn to a quantitative examination of the individual features of each system, including all speakers in the dataset. In this way, we provide a temporal account of system change in the area. We organize this discussion in terms of: (1) traditional New England features; and (2) LBMS and NCS features.
TRADITIONAL NEW ENGLAND FEATURES
In the following, we report the results of regression analyses for start, palm, mary, marry, and merry movement in F1/F2 space. Overall, we observe that, in Western Massachusetts, there is movement away from these traditional New England features.Footnote 4
Traditional New England Vowel Features
As introduced above in our review of prior literature, fronted start/palm and the mary/marry/merry distinction are traditional features associated with ENE.Footnote 5 We find that these traditional features are present in some of our older speakers in Western Massachusetts, but receding, much as they are in most other New England regions (Stanford, Reference Stanford2019:7–8; Stanford, Reference Stanford2020; Stanford et al., Reference Stanford, Severance and Baclawski2014). Table 1 provides our regression results for these vowels in our Western Massachusetts dataset, and below we discuss the results for each feature in more detail.
Table 1. Summary Results for start, palm, and mary/merry/marry: Regression table showing main effect of birth year for predicting Lobanov-normalized F1 and F2 of linguistic features (* = p < 0.05; ** = p < 0.01; *** = p < 0.001)

Palm- and start-fronting. Figure 7a-b displays the apparent time movement of palm (dark circles) and start (gray triangles) in Western Massachusetts along F1 and F2. Following Labov et al. (Reference Labov, Ash and Boberg2006), we examine palm and start separately. Negative coefficients in Table 1 for all four measures suggest movement backwards or up in the vowel space. In Figure 7a-b, we note that while palm has consistently greater F1 and lower F2 values than start, the F1 and F2 values for both vowel classes appear to decline in apparent time, suggesting raising and backing, and these movements appear to have initiated with speakers born prior to the 1960s. We return to palm in the section on LBMS and NCS Patterns, where we discuss the overall systematic shift toward the LBMS.

Figure 7a-b. palm and start over apparent time in our Western Massachusetts data. Each point is a token in our corpus. (a) The upper plot displays F1 values. (b) The lower plot displays F2 values.
mary/marry/merry
Our dataset shows another traditional ENE variable receding, as mary/marry/merry move closer together in apparent time in both F1 and F2. As Figures 5–6 and Table 1 show, this is primarily due to changes in marry. Due to manuscript size limitations, we are not able to provide further analysis here, but we note that our results for this variable show a receding pattern similar to many other contemporary New England areas (Stanford, Reference Stanford2019:100, 158–63, 188, 200–206, 218–9).
LBMS AND NCS PATTERNS
Low Vowel Shifting
In this section, we assess the movement of the Northern Cities Shift (NCS) and the Low-Back-Merger-Shift vowels in F1/F2 space over apparent time in our Western Massachusetts data. We then utilize the metric developed by Boberg (Reference Boberg2019a) to assess LBMS participation in the community in order to establish how advanced the shift in Western Massachusetts is in comparison to other regions where the LBMS is attested. Table 2 provides the summary results from regression modeling on F1 and F2 for each of the relevant vowel classes, where we assess the direction of their movement over apparent time. Note that positive intercept values for F1 analyses indicate lowering in the vowel space and negative intercept values for F2 analyses indicate retraction.
Table 2. Regression results showing main effect of birth year for predicting Lobanov-normalized F1 and F2 of linguistic features (* = p < 0.05; ** = p < 0.01; *** = p < 0.001)

As summarized in Table 2, many of these vowel classes are shifting in the direction of the LBMS in Western Massachusetts. fleece, our anchor vowel, does not move in either the F1 or F2 dimension. The positive F1 coefficient and negative F2 coefficient suggest down and backward movement of kit, albeit moderate. bat and dress also move down and backward, as evidenced by their positive F1 coefficients and negative F2 coefficients. Negative F1 and F2 coefficients for lot suggest raising and backward movement in Western Massachusetts, while nonsignificance for thought suggests no apparent time movement in F1/F2 space. As we have discussed above, all of these movements are implicated in the LBMS. Below, we will explore these changes in more detail in order to get a sense of how long the LBMS has been progressing in the community.
ADVANCEMENT OF THE LOW-BACK-MERGER-SHIFT
Just how advanced is the LBMS in Western Massachusetts? Below, we examine the two diagnostics of LBMS participation—low-back merger and short-front vowel-shifting—to answer this question and to get a sense of how long this pan-American configuration has been progressing in the area. Table 3 provides summaries of the regression analyses utilized to assess LBMS participation. These analyses consider three changes in progress: shifting of the short-front vowels (kit, dress, and bat), the merger of lot with thought, and the merger of palm with thought. First, we examine the relative distance between palm and thought in F1/F2 space as measured by the Pillai-Bartlett statistic, and its change over time.
Table 3. Regression results showing main effect of birth year for predicting lot-thought and palm-thought merger (Pillai Statistic). (* = p < 0.05; ** = p < 0.01; *** = p < 0.001)

The negative coefficient for this measure (Table 3) and the downward trajectory in the trend line of Figure 8 show that there has been a change toward merger of these vowel classes in the community. We observe that, for speakers born prior to 1950, there is a wide distribution of Pillai-Bartlett values ranging from 0.029 to .806, and that only four of these speakers have Pillai-Bartlett values above .3. After 1950, the range of Pillai-Bartlett values decreases so that Pillai-Bartlett values are almost exclusively at or below 0.3 and many of the youngest speakers have values close to 0.0. The decline in palm-thought Pillai-Bartlett values is significant but only at a level of p = 0.016, and this is likely because the significant decline appears to have been in the earlier half of the twentieth century, while decline appears to have tapered off in the latter half.

Figure 8. palm-thought Pillai-Bartlett Statistic values over apparent time in our Western Massachusetts data. The Pillai-Bartlett Statistic quantifies the amount of overlap between the two vowel classes. A value of zero represents complete overlap.
We observe a different trend for lot-thought, albeit in the same general direction. The negative coefficient for lot-thought Pillai-Bartlett values in Table 3 suggest change toward the merger of lot and thought, as we would expect given the overall vowel space examination we conducted in the previous section. In Figure 9, we observe the decline of lot-thought Pillai-Bartlett values over apparent time. Like with the palm-thought merger, we find a wide range of Pillai-Bartlett values for older speakers and a narrow range toward zero for younger speakers. Speakers born prior to 1970 exhibit a range from 0.048 to 0.625. Beginning in birth year 1970, we note a sudden decline in the distribution of Pillai-Bartlett values whose upper limit is 0.35. By the late 1990s, all but one speaker exhibit Pillai-Bartlett values below 0.3. Like with palm/thought, this decline is significant at p = 0.016 (see Table 3). However, as discussed below, a more fine-grained analysis reveals a notable difference in the timing of the palm/thought merger versus the lot-thought merger.
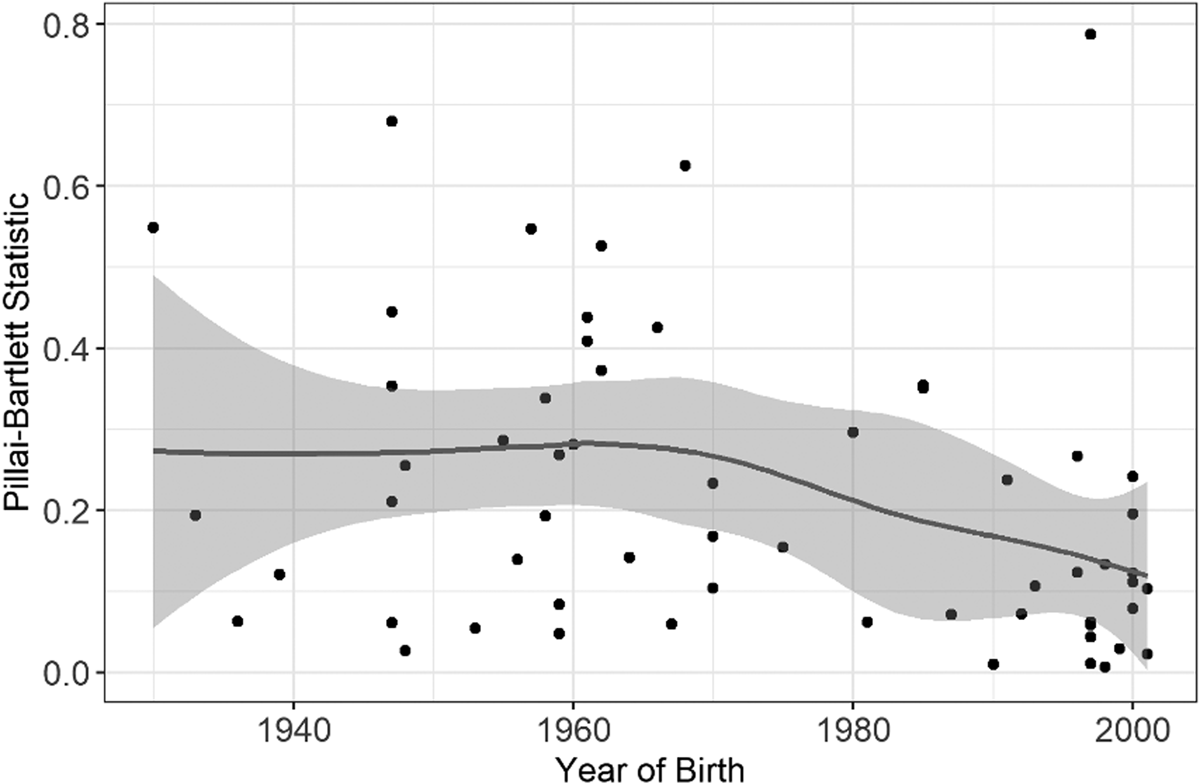
Figure 9. lot-thought Pillai-Bartlett Statistic values over apparent time in Western Massachusetts.
Committing lot and palm movement to a decade-by-decade regression analysis (Table 4) reveals that, unlike for palm/thought, whose major shift appears to have occurred early in the twentieth century, change toward community-level lot-thought merger took off toward century's end. In Table 4, significant palm-raising (F1) and backing (F2) were first initiated in the 1950s. palm-backing reoccurred in the 1970s and continued in every subsequent decade, and palm-raising shows the same pattern starting in the 1970s. The analyses also reveal that lot-backing and raising occurred in the 2000s. This is corroborated in Figure 8 where we see a decline in palm/thought Pillai values by the 1950s and 1960s and crucially no decline in lot-thought Pillai values (Figure 9) until much later. Therefore, in Western Massachusetts, we observe that LBMS-like palm movement occurred prior to lot movement. This is unexpected, as palm-lot are often what is merging with thought as the initial LBMS component. It is beyond the scope of the current paper to provide a detailed investigation of what causes palm to back before lot in Western Massachusetts. It is, however, an important part of the LBMS puzzle and we look forward to exploring this question in the future.
Table 4. Regression results showing main effect of birth year for predicting Lobanov-normalized F1 and F2 of lot and palm. Reference level 1930. (* = p < 0.05; ** = p < 0.01; *** = p < 0.001)

SHORT-FRONT VOWEL SHIFTING
We now examine the other major component of the LBMS: the lowering and retracting of the short-front vowels (bat, dress, kit). As described above, we utilize the Index Score developed by Boberg (Reference Boberg2019a) to measure the distance between these three vowels and the anchor vowel fleece in F1 and F2 space. To get a sense of the community-level direction of change with regard to short-front vowel shifting, we examine the index scores over apparent time. Figure 10 displays index scores of each speaker in the sample across year of birth. The plot suggests a slight increase in LBMS scores over time, as seen in the rising trend line in Figure 10 and the positive coefficient (estimate = 0.0062) in the apparent time regression, but this increase is not significant (p = 0.085). This suggests that the LBMS has been underway in Western Massachusetts for quite some time. We note that these LBMS index scores are well within the range observed by other studies of LBMS in other regions. Of all the six communities represented in Becker (Reference Becker2019), LBMS scores range from 1.85 to 2.88, with the highest and lowest index scores in the volume coming from California (Fridland & Kendall, Reference Fridland, Kendall and Becker2019). Thus, in fact, Western Massachusetts appears to be at the forefront of the retraction and lowering of the short-front vowels in North America, with values surpassing those in western and Canadian communities—where the LBMS is suspected to have progressed longer.
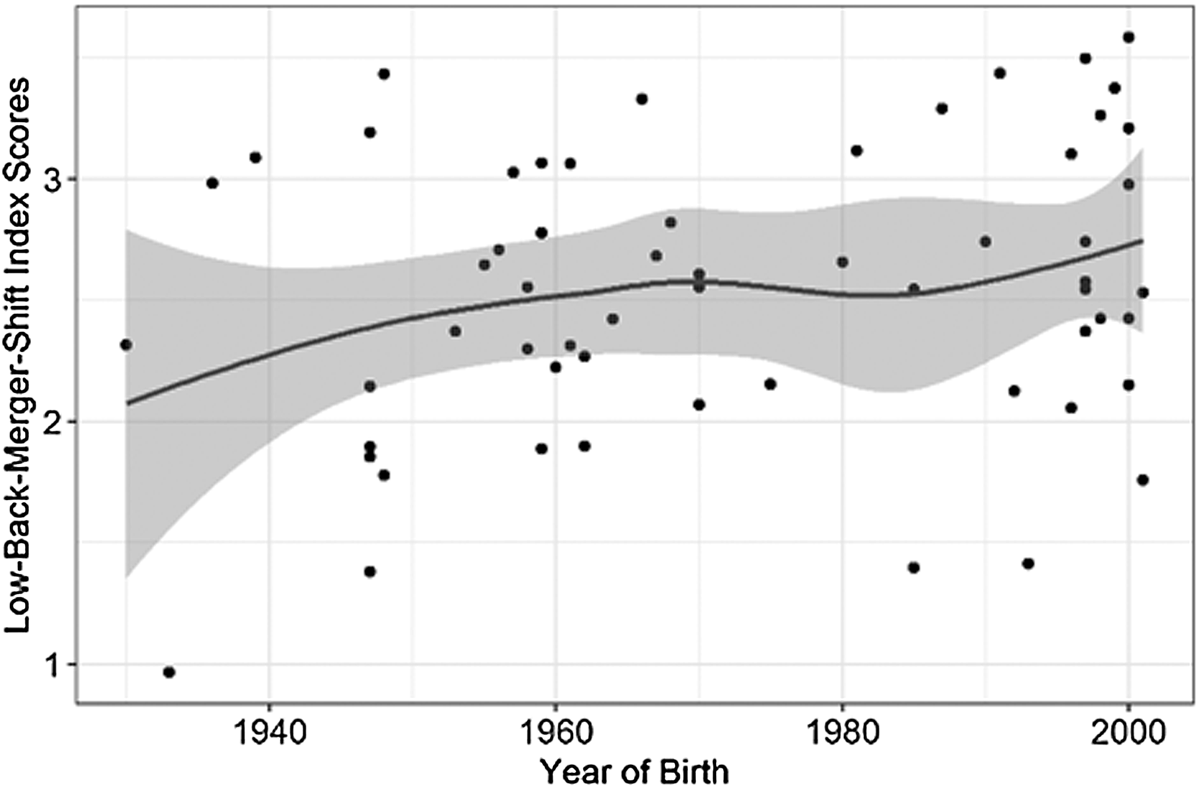
Figure 10. LBMS index scores over apparent time in our Western Massachusetts data. The index measures the amount of distance in F1/F2 space between fleece and the short-front vowels (bat, dress, kit). A higher score indicates more distance.
In Figure 10, we find that more than half of the Western Massachusetts speakers exhibit index scores well above 2.88—the upper limit in the Becker (Reference Becker2019) volume. Furthermore, those in our sample born in the 2000s have higher index scores than their college-aged counterparts in these western and Canadian samples. A decade-by-decade regression analysis of bat and dress movement akin to the ones performed for lot and palm above show that these measures in every decade from 1940 to present day are significantly different from those in 1930. We thus observe that, in Western Massachusetts, the retraction and lowering of the short-front vowels, bat and dress, has been well underway at least since the 1940s and that this process appears to be more advanced here than in the communities where the LBMS has been argued to be robust, that is, the West and Canada.
To summarize, the observations in the last few sections lead to new findings about the structural account of the LBMS in North America. The current account holds that the shifting of lot toward thought is the trigger of the LBMS, so that once lot-palm moves toward thought, the short-front vowels follow. Our analysis in Western Massachusetts suggests, however, that other chronologies may be possible. We find the following community pattern: short-front vowel shifting prior to the 1950s, palm-shifting toward thought in the 1950s, and lot-shifting toward lot-thought merger in the 2000s. Therefore, we add two unexpected developments to the discussion of LBMS ordering. First, in Western Massachusetts, palm movement toward thought preceded lot movement. Second, it is not the movement of lot-palm toward thought that prompted the shifting of the short-front vowels in Western Massachusetts, rather short-front vowel shifting initiated the LBMS there.
DISCUSSION AND CONCLUSIONS
We have shown that traditional New England and NCS features are receding in this region while supralocal LBMS features are coming in. Our results support the overall structural account put forward in the Becker (Reference Becker2019) volume, but also introduce new questions about the assumed chronology in that model. First, our analyses confirm the general findings proposed by Boberg (Reference Boberg2005) and adopted in Becker (Reference Becker2019), which argue that, in any community where the low-back merger is found, there will be evidence of short-front vowel shifting down and back in the vowel space. Second, the results of the present study provide a differing perspective on Boberg's (Reference Boberg2010) and Roeder and Gardner's (Reference Roeder, Gardner and Freeman2013) suggestion that backward movement of palm toward thought is a prerequisite for the LBMS. Our analysis of this Western Massachusetts dataset suggests that short front vowel movement precedes palm movement. Third, our results raise questions about assumptions of the relative ordering of events in the LBMS. The structural account put forward in the Becker (Reference Becker2019) volume considers the movement of lot toward merger with thought as the catalyst for short-front vowel shifting. Our community-level analysis suggests that short-front vowel shifting has been initiated before the shifting of lot toward thought.
Becker (Reference Becker2019:9) pointed out that, “Given the input condition of an NCS vowel configuration, it may not be reasonable to expect the LBMS to proceed as it does in locales with a more neutral starting configuration.” If there is to be a unified account of the LBMS, we believe that it should take into account communities without a neutral starting configuration. Our analysis suggests that the pull-chain as hypothesized in Becker (Reference Becker2019) best characterizes communities with neutral starting configurations. For communities of other profiles, such as those outside of the U.S. West, Canada, and the U.S. Midland, the LBMS may emerge differently. Furthermore, we observe that the LBMS may be more advanced in Western Massachusetts than in the two regions where the LBMS has been most robustly attested: the U.S. West and Canada. A similar observation is made for Lansing, Michigan (Nesbitt, Wagner, & Mason, Reference Nesbitt, Wagner, Mason and Becker2019), where within three generations, Lansingites also show advanced LBMS features. One possible explanation is that the LBMS is a more recent phenomenon in the West and Canada than previously thought. Another likely explanation is that the LBMS carries different social meanings in nonwestern areas like the Midwest and New England than in the West and Canada. Indeed, as Becker (Reference Becker2019:18–19) and Boberg (Reference Boberg and Becker2019b) observe, social meaning can “reinforce, amplify, or accelerate” the trajectory of sound change.
Considering social meaning, we believe that avoidance of regionally stigmatized features can help explain how the LBMS achieved its foothold in Western Massachusetts. This type of scenario was postulated by Becker (Reference Becker2019:9) in accounting for the different temporal ordering of the LBMS in Lansing, Michigan, though there have to date been no investigations into the sociosymbolic meanings of those changes in Michigan. We know that traditional New England features associated with Boston/metropolitan Eastern Massachusetts, such as palm/start-fronting and r-lessness, have a salient, stereotyped social meaning across the overall New England dialect area and beyond (Nagy & Roberts, Reference Nagy, Roberts, Schneider, Burridge, Kortman, Mesthrie and Upton2004; Stanford, Reference Stanford2019:116–21). In the present study, we find that there is an ideology that those in Western Massachusetts speak “good English” as opposed to the variety spoken in Boston/metropolitan Eastern Massachusetts.
Prior work confirms this as a generational shift evident in many middle-aged and young adults across New England, who portray themselves in opposition to such pronunciations. For example, one young woman in New Hampshire said that she only used such features “when mocking someone from Massachusetts. It was never how I talked” (Stanford, Reference Stanford2019:285). A young man from Eastern Massachusetts stated, “My father had a thick Boston accent growing up, but has eliminated many of its features… The Boston accent was to an extent viewed as a working-class accent” (286). Another said, “Growing up, both of my parents would try to avoid displaying New England features in their speech” (287). Our Western Massachusetts interviewees show similar sentiments toward the Hub, such as, “They speak Bostonian over there, but over here we speak American [laughter]… That's correct English.” Such evaluations, along with the social and political ideologies associated with them, can help explain the rapid linguistic change in the area. New England, as a whole, has undergone dramatic social changes in recent decades, including large-scale socioeconomic and lifestyle shifts (e.g., shifts away from rural farming), new populations moving in, and younger speakers having greater supraregional contact (Roberts, Reference Roberts2007; Stanford, Reference Stanford2019:289–91). As for the LBMS, our interviewees and those in the prior New England work frequently mention ENE variables but do not appear to have an awareness of LBMS or NCS vowels. This suggests that the LBMS is coming in as a change-from-below, while traditional ENE variables are receding as a change-from-above.
In our dataset, lot movement toward thought is not a crucial initial condition for the LBMS, unlike prior analyses. Local social meaning may therefore play an important role in the vowel movement chronology of the LBMS in a given region, even as it eventually develops into the same familiar supralocal configuration that the authors in Becker (Reference Becker2019) have so consistently described elsewhere.
In conclusion, we have identified New England as another dialect area where regional features are giving way to the supralocal LBMS, thus generating new knowledge about the scope of LBMS in North American English, and more generally, knowledge about how, why, and when vowel shifts occur. Within New England, future research can ascertain whether this finding of LBMS in Western Massachusetts may represent similar changes in the larger New England dialect area. Moreover, since the name and current theoretical formulation of the LBMS rely on assumptions about the triggering role of the low-back merger (Becker, Reference Becker2019), the results of our study have theoretical implications for our understanding of the LBMS itself: though disparate communities might adopt the same system, the means by which this happens may differ at the local level, including the chronology of key vowel movements of the LBMS. Differing sociohistorical circumstances and sociosymbolic meaning may have a larger role in the LBMS, and in other large-scale vowel shifts, than previously assumed.
ACKNOWLEDGMENTS
Thank you to the Western Massachusetts participants in this study, the Lucas Family Foundation, and Dartmouth Undergraduate Advising and Research. Thank you to student fieldworkers Leanna Arjune, Charlene Browne, Olivia Estes, Dillon Ford, Anne Furman, Macguinness Galinson, James King, Madeline Kroot, Zoe Leonard, Patrick Matlin Redondo, Arista Ngodinh, Jebreel Samples, Andrew Siegel, Tara Sweeney, Sebastian Turner, Leah Urbanski, Dat Vo, and Joshua Wende.


