
In their Atlas of North American English (hereafter ANAE), which seeks to characterize the varieties of English spoken across the United States, Labov, Ash, and Boberg (Reference Labov, Ash and Boberg2006) noted that two vowel features are especially pivotal in defining the dialects of contemporary U.S. English. The unconditioned merger of the low back vowels in many regions of the United States and the variety of realizations found for the low front /æ/ vowel evidenced in contemporary American speech. Increasingly, it seems, these vowel features are defining regional dialect distinctions among American (as well as Canadian) regional dialects. Given this role in regional vowel patterns, the production of the low front and low back vowels (collectively and in isolation) have been investigated both broadly (Clopper, Pisoni, & de Jong, Reference Clopper, Pisoni and de Jong2005; Jacewicz, Fox, & Salmons Reference Jacewicz, Fox and Salmons2011; Labov et al., Reference Labov, Ash and Boberg2006) and in specific locales (e.g., Bigham, Reference Bigham2010; Boberg, Reference Boberg2005; Dinkin, Reference Dinkin2011; Doernberger & Cerny, Reference Doernberger and Cerny2008; Hall-Lew, Reference Hall-Lew2010a; Moonwomon, Reference Moonwomon1991).
In general, among North American dialect regions, the main variable realizations of the /æ/ vowel are associated either with raising and tensing (in the Inland North) or retraction (in Canada and the West). In terms of the /ɑ/ and /ɔ/ classes, the low back merger has been noted extensively throughout Canada and the Western United States, as well as the Midland and Eastern New England. This merger involves the loss of distinction, both in production and perception, between the /ɑ/ and /ɔ/ classes (Herold, Reference Herold1990; Terrell, Reference Terrell1976). The precise trigger for merger and its relationship with the low front vowel is still unclear, with a number of scholars suggesting that merger may result from a structural realignment following /æ/ retraction, although, in practice, the merger has variably been reported as a result of fronting/lowering of /ɔ/ (Hall-Lew, Reference Hall-Lew2013; Moonwomon, Reference Moonwomon, Denning, Inkelas, McNair-Knox and Rickford1987, Reference Moonwomon1991) rather than the backing and/or raising of /ɑ/ (D'Onofrio, Eckert, Podesva, Pratt, & Van Hofwegen, Reference D'Onofrio, Eckert, Podesva, Pratt, Van Hofwegen, Fridland, Kendall, Evans and Wassink2016; Eckert, Reference Eckert2004; Strelluf, Reference Strelluf2014).
As of yet, this relationship among the low vowels, often referenced as a chain shift process, is not well elucidated. The current work explores this suggestion of a structural relation among the vowels more deeply, as well as investigates whether the different acoustic phonetic positions for low vowels found regionally affect how the low vowel continuum is perceived. As such, this paper contributes both confirmation of the low vowel patterns found across regions in earlier work and a more in-depth treatment of the structural relationship often assumed among these vowels, but rarely empirically explored (particularly across multiple regional groups). This paper also contributes to the growing body of literature that examines whether such differences in production are connected to how vowel tokens are categorized in perception.
In earlier work on the mid and high front vowels, Fridland and Kendall (Reference Fridland and Kendall2012) found that both production and perception were affected by the regionally variable vowel shift patterns widely noted across U.S. dialects. The South showed the greatest difference in where mid and high front vowel targets were realized acoustically, and this distinction in production affected how those same vowel categories were categorized perceptually in a vowel identification task (Kendall & Fridland, Reference Kendall and Fridland2012). This work suggested that exposure to variable input in terms of production correlates with how such sounds are systematically heard. To follow up on this line of inquiry, we also look at the link between production and perception of the low vowels by examining how regional variation in production affects perception of the low vowel continuum. Based on the work just cited, we might here expect that we will find similar indicators of regional distinctions in production and perception for the low vowels.
CONTEXTUALIZING U.S. ENGLISH VOWEL SYSTEMS: THE NORTH, WEST, AND SOUTH
Most sociophonetic work on vowels in American regional dialects has centered on three major shifts—the North Cities Shift; the California, or Canadian, Vowel Shift; and the Southern Vowel Shift—that affect the Inland North, the West, and the South, respectively. (See Gordon [Reference Gordon, Chambers and Schilling2013]; Labov [Reference Labov1994]; or ANAE for greater detail and schematizations of these shifts.)
The Inland North is generally characterized by a set of vowel shifts known as the Northern Cities Shift (NCS). Introduced by Labov, Yeager, and Steiner (Reference Labov, Yaeger and Steiner1972) in some of the earliest acoustic sociophonetic work, the NCS primarily involves the movement of five vowel classes in what Labov (Reference Labov1994) identified as a chain shift mechanism. The ANAE suggests the initiating movement was the general raising of the /æ/ class that then triggered subsequent realignment involving the fronting of the /ɑ/ class (merged with the /a/ class). Other scholars also suggested that these two shifts are structurally linked (Bigham, Reference Bigham2010; Gordon, Reference Gordon and Schneider2005; Thomas, Reference Thomas2001).
The ANAE describes a relationship between the low front and low back system in the NCS such that this raising of /æ/ and the fronting of the /ɑ/ class inhibits the tendency toward low back merger, a resistance suggested to be unavailable in dialects without such fronting. Some recent research suggests this Northern resistance toward merger is not as strong as previously suggested, however. For example, Dinkin (Reference Dinkin2011) found weakening resistance to merger in upstate New York (on the fringe of the Inland North), particularly via backing of /ɑ/. Likewise, Benson, Fox, and Balkman (Reference Benson, Fox and Balkman2011) indicated that low back merger can co-occur with /æ/ raising in northwestern Wisconsin, located on the other side of the Inland North. Beyond the suggestion of weakening, the ordering of the shifts and the necessity of a structural relationship has also been questioned (e.g., Dinkin, Reference Dinkin2011; Gordon, Reference Gordon2001; McCarthy, Reference McCarthy2010).
These low vowel positions in the North strongly differentiate this region from Western speech. Unlike the Inland North, which exhibits a tense /æ/ system, Western speech exhibits the more widespread nasal /æ/ split where all non-nasal tokens of /æ/ remain lax (with the exception of some pre-/g/ tensing in the Pacific Northwest; Becker, Aden, Best, & Jacobson [Reference Becker, Aden, Best, Jacobson, Fridland, Kendall, Evans and Wassink2016]; Wassink [Reference Wassink2015, Reference Wassink, Fridland, Kendall, Evans and Wassink2016]). When nasal tokens are excluded, the mean position for Western /æ/ is also lowered and backed compared with non-Western /æ/, part of a generalized retraction of the front lax system. Another key point of contrast between the North and the West is in the low back system. The primary distinguishing feature of the West is the conflation of the /ɑ/ and /ɔ/ (low back) classes into a single vowel phoneme, the so-called low back merger, while areas affected by the NCS-related /æ/ raising maintain separation of these classes.
In terms of its contemporary low vowel system, the South is somewhere in between the North and the West, with a number of uniquely defining features. Southern speech is affected by a shift referred to as the Southern Vowel Shift (SVS), the main reflex of which is the monophthongization of the /ay/ diphthong (not a focus of the present paper) along with centralization of the /i/ and /e/ vowels. This shift also involves the fronting and raising of the lax front vowels, often accompanied by breaking. The ANAE suggests the low front vowel is part of this lax ingliding system affected by the SVS, though /æ/ raising in the South is not well documented. In terms of acoustic position, the Southern /æ/ nucleus more closely resembles the Northern acoustic position, though not typically as high (Labov et al., Reference Labov, Ash and Boberg2006:243). The South also appears to realize a more variable low back system. Southern low back vowels often show overlapping low back nuclei in terms of F1/F2, especially for younger speakers (Fridland, Reference Fridland, Picone and Evans2015). However, glide differentiation accompanies this overlap, with upglided /ɔ/ but not /ɑ/ tokens. In addition, for many Southern speakers that exhibit upgliding, the /ɔ/ class is unrounded, while those maintaining the nuclear separation still maintain rounded tokens. Among younger speakers, there is even some tendency toward low back merger, undifferentiated by gliding. In North Carolina, Jacewicz et al. (Reference Jacewicz, Fox and Salmons2011) suggested that /ɑ/ is backing and raising across generations (along with the backing and lowering of /æ/), a movement similar to that found in the West, but opposite that expected in the Northern pattern. As such, the Southern system exhibits a unique, and rather complex, low vowel system and, according to the ANAE, the back upgliding system also presents a structural resistance to the low vowel merger.
Still, we have yet to see much empirical evidence that such a structural relationship exists, beyond the observation that areas with distinct low back classes often have shifts involving the /æ/ class that effectively increase the margin of security (as proposed by Martinet [Reference Martinet1955]), or follow the principle of maximal or, at least, sufficient, contrast (proposed by Lindblom [Reference Lindblom, Ohala and Jaeger1986]) with /ɑ/, offsetting any tendency for merger (Gordon, Reference Gordon and Schneider2005; Labov et al., Reference Labov, Ash and Boberg2006; Thomas, Reference Thomas2001). In contrast, areas with the merger (such as the West and Canada) have vowel shifts that effectively serve to increase margins of security breached by backed /æ/ tokens or expand into low vowel territory enlarged by the movement of /ɑ/ toward /ɔ/ (out of a low central position). As well, some counterevidence to the stable resistance to merger in the North also exists (e.g., Benson et al., Reference Benson, Fox and Balkman2011; Dinkin, Reference Dinkin2011), highlighting the need for more investigations of this relationship across regions.
Empirical confirmation of such a relationship has been tricky, as correlations evident at the community level are not necessarily maintained at the level of the individual in studies of specific community locales (Bigham, Reference Bigham2010; Dinkin, Reference Dinkin2011; Gordon, Reference Gordon and Schneider2005). In other words, not all merged speakers exhibit low front retraction and, for example, not all Inland Northern speakers that show raised /æ/ have a more front /ɑ/ position. And this fact appears to hamper arguments about structural universals or causal relationships. However, as a driving question in the current project, we wondered whether there might exist a general relationship among vowels that is not tied directly to particular shift patterns, but that is sensitive to relative positions among the low vowels such that, within a community, vowels restructure phonetically in response to changes that alter this preferred structural relation over time. To examine low vowel production among the regions in this way, we will first compare the North, South, and West in terms of the low vowel system, looking closely for any correlations within the low vowels that persist across regions.
To complete our investigation of the low vowel system, we also attempt to uncover whether any differences in production correlate with differences in perception when regions or speakers have systematically different acoustic realizations for low front and low back vowels. Other research (e.g., Di Paolo, Reference Di Paolo1992; Doernberger & Cerny, Reference Doernberger and Cerny2008; Labov et al., Reference Labov, Ash and Boberg2006) has examined how word pairs are perceived by speakers with and without a merger in production. In that research, speakers with and without the merger show differences in how they perceive contrast between the two back vowel categories (e.g., “same” or “different”). Here, instead, we look at how listeners’ low vowel productions might relate to their vowel category identification along a continuum between the low front, /æ/, and low back, /ɑ/, vowels.
METHODS AND DATA
The data for this project come from a large-scale perception and production study of regional vowel patterns across the United States. Data collection consisted of two parts: an online vowel identification study and a fieldwork component to collect speech data. This design allowed us to gather perception and production data simultaneously from the same participants in several field sites. In addition to this production/perception data subset, we also collected a larger population of participants for the online perception portion to provide a more comprehensive look at vowel identification regionally. This larger study and several of our specific inquiries have been described elsewhere and readers are referred to these other sources for additional information about the study design and its other foci (cf. Fridland & Kendall, Reference Fridland and Kendall2012, Reference Fridland and Kendall2015; Fridland, Kendall, & Farrington Reference Fridland, Kendall and Farrington2014; Kendall & Fridland, Reference Kendall and Fridland2012, Reference Kendall, Fridland, Côté, Knooihuizen and Nerbonne2016).
Participants from several regional field sites were recruited, two in the West (Reno, Nevada, and Eugene, Oregon), two in the Inland North (Oswego, New York, and Chicago, Illinois), and three in the South (Memphis, Tennessee; Raleigh, North Carolina; and Blacksburg, Virginia). For the examination here we focus on the participants in terms of their regional affiliation and do not examine finer subregional differences. From the over 550 participants recruited for the main perception study, we focus our analysis on the subset of participants who also contributed speech production recordings to the study. These participants, after completing the vowel identification task, were recorded reading a reading passage, a word list, and, for a smaller subsample, talking in an informal interview. These recordings were collected with a Tascam digital recorder and a Shure WH30XLR head-mounted microphone, or with a Marantz digital recorder and a Shure SM93 lavalier microphone by a single local fieldworker in a quiet setting.
For the present study, a combined total of 86 participants from the field sites are examined, with a regional breakdown given in Table 1. Participants were primarily college-age adults who reported that they resided in the region of study from early childhood (age 4 and above) until at least adulthood (age 18). Our sample of Southerners is larger than the sample for the other regions and included a slightly broader sample of older adults. Participants self-reported their ages into one of six bins: 18–25, 26–30, 31–40, 41–50, 51–60, or 61–65. Seventy-eight percent of the participants (n = 67) reported their age as 18–25. For the North, four participants were over 25, and for the West, only two were. Thirteen Southern participants were over 25 (n = 4 for 26–30, n = 7 for 31–40, and n = 2 for 51–60). Although we might expect to find age-related differences during changes in progress, we do not focus on age-related patterns in this analysis since the participants are primarily younger adults.Footnote 1 Six participants, included in Table 1, contributed speech data but did not complete the perception study.
Table 1. Participants in the present study

For the analysis, per speaker, approximately 100 vowels were measured from the word list and 34 vowels were measured from the reading passage. Vowels were measured from throughout each speaker's vowel space to gain a full representation of each speaker's vowel inventory and to capture information about the low vowels. The word tokens for the main low vowel categories of interest, the focus of this paper, are listed in Appendix A. Praat (Boersma & Weenink, Reference Boersma and Weenink2012) was used for all acoustic measurements, with F1 and F2 measurements taken at 1/3 and 2/3 of each vowel's temporal duration. The 1/3 measurement point is used throughout our analysis as the vowel's nucleus. All vowel data were manipulated and, where relevant, normalized using the Vowels package (Kendall & Thomas, Reference Kendall and Thomas2009) for R (R Development Core Team, 2010). For the analyses and discussions herein, the production data are normalized using the Lobanov z-score method (Kendall & Thomas, Reference Kendall and Thomas2009; Lobanov, Reference Lobanov1971). This technique results in relatively similarly scaled F1 and F2 dimensions (e.g., notice in Figures 1–3 that all vowels fall between 2 and -2 on both the x- and y-axes of the vowel plots). As explained in Fridland and Kendall (Reference Fridland and Kendall2012), this similarity in scaling between dimensions makes Euclidean distance (ED) an appropriate measure of the distance between two mean vowel categories, and we occasionally use ED measures in the analyses to follow.

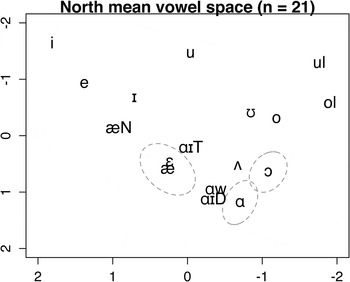
Figure 1. Mean (onset) vowel positions for Northern speakers (n = 21). Ellipses indicate one standard deviation around vowels of interest.

Figure 2. Mean (onset) vowel positions for Western speakers (n = 21). Ellipses indicate one standard deviation around vowels of interest.

Figure 3. Mean (onset) vowel positions for Southern speakers (n = 44). Ellipses indicate one standard deviation around vowels of interest.
The web-based perception test designed for the project measured vowel category judgments for five vowel continua. The current paper examines participants’ categorization of steps along one of the five continua, a continuum in the low vowel space from /æ/ to /ɑ/, synthesized between natural speech endpoints. For the vowel identification stimuli, each vowel continuum was embedded into two different consonant contexts (following a labial and following an alveolar) resulting in seven-step continua for the word pairs pad~pod and sad~sod. Formant information for the stimuli are provided in Appendix B. Each trial presented participants with a single vowel-continuum step (played once), and they were asked to indicate the token they just heard from two choices (e.g., sad or sod). Each step in the vowel continuum was played four times randomized over the course of the study. More information about the experiment and stimuli is available in Kendall and Fridland (Reference Kendall and Fridland2012).
In the following sections, we first elucidate previous work on vowel production across the three regions by examining how these patterns are realized in the low vowel systems of speakers across regions. We ask specifically whether these changes have effectively reshaped the low vowel subsystem and whether we can locate evidence of a structural relationship among these vowels. After establishing the relative vowel positions within and across regions, we move to our results comparing regional production and perception in order to explore how linkages in production may co-vary with the perception of these vowels.
THE LOW VOWELS IN PRODUCTION
The production data from the 86 participants show clear reflexes of the three regional shift patterns (see also Fridland & Kendall, Reference Fridland and Kendall2012; Fridland et al., Reference Fridland, Kendall and Farrington2014). Figures 1–3 display the (Lobanov normalized) F1 and F2 means for vowel onsets across composite results for the three regional groups. These mean value positions do not include prelateral, prerhotic, or prenasal environments although the plots include separate prelateral means for the high and mid back vowels to help illustrate the overall shape of the regional vowel spaces, since vowels in these environments remain back. Prenasal /æ/ is included as its own category in the plots. We do not investigate prenasal /æ/ raising in this paper due to a low number of tokens in our elicitation materials, but we do note that all three regional groups exhibit raised prenasal /æ/. Recent research has taken interest in the raising of /æ/ in prevoiced velar (/g/) environments (Becker et al., Reference Becker, Aden, Best, Jacobson, Fridland, Kendall, Evans and Wassink2016; Fridland & Kendall, Reference Fridland, Kendall, Fridland, Evans, Wassink and Kendallin press; Wassink, Reference Wassink2015), however our data, with limited pre-/g/ tokens of /æ/, show little evidence of this phenomenon so pre-/g/ tokens of /æ/ are included in the main category. Ellipses depict one standard deviation around the mean for each vowel category of interest. (Ellipses are not included elsewhere simply to limit clutter in the vowel plots.)
As can be seen in Figures 1–3, the regional patterns for low vowel realization match expectations based on the distinguishing vowel shifts affecting each region. The West shows a clear low back merger that is lacking in the other two regions, with both maintaining separate nucleus position for /ɑ/ and /ɔ/. Northern /ɑ/ is relatively central in the low vowel space compared with the more backed positions for the West and South. We also see a very raised low front vowel in the North, a comparatively retracted low front vowel in the West, and a relatively intermediate low front position for the South.
While a number of studies have considered the low vowel space, very little work has attempted to quantify the relative positions of the low vowels or their relationships to one another. Thus, for the remainder of this section, we examine a series of speaker-level production metrics that capture various acoustic/positional relationships between the three primary low vowel categories: /æ/, /ɑ/, and /ɔ/.Footnote 2 To assess the relative utility of these metrics, we conduct a series of analysis of variance (ANOVA) tests asking whether each metric is statistically differentiated by region.
Quantifying tensing and retraction of /æ/
The movement of /æ/ is typically considered in terms of height as measured by F1.Footnote 3 We can also consider the F2 positions of /æ/, which, especially for retracted speakers may capture more of the movement than difference in height. An ANOVA test of the mean F1 positions (South M = .91, West M = 1.13, North M = .53; all values in Lobanov normalized units) of speakers’ /æ/ vowels finds a significant difference across the regional groups (F(2,83) = 31.85, p < .001), with a Tukey post-hoc test showing that all three groups are significantly different from one another (West vs. South: p < .01; West vs. North: p < .001; South vs. North: p < .001). These results confirm our sense from Figures 1–3, that the North has a significantly higher /æ/, as expected given the NCS pattern, while the West has a significantly lower /æ/, with Southern F1 in an intermediate position. An ANOVA test of the mean F2 positions of these speakers’ /æ/ vowels also finds a significant difference across the regional groups (F(2,83) = 8.26, p < .001; South M = .18, West M = .03, North M = .28), although one that is less strong than for F1, with post-hoc comparisons yielding significance for the West versus South (p < .05) and West versus North (p < .001) comparisons but not the South versus North comparison (p = .160). Such results suggest that the backed position of /æ/ associated with the Western vowel pattern in particular creates a regionally distinctive low front vowel position for our Western speakers.
Quantifying the positions of /ɑ/ and /ɔ/
We now examine the relative relationship of the /ɑ/ and /ɔ/ vowels, assessing the extent of the low back vowel merger among our regions of study. Since the low back merger involves a collapsing of the /ɑ/ and /ɔ/ categories, we expect that speakers in the West, with greater merger, will be significantly different from speakers in the South and North, with less merger.
We first compare regions by way of the Pillai statistic, which is a commonly used statistic arising from a multivariate analysis of variance test. A Pillai value, or score, reflects the amount of overlap between two categories. Pillai values closer to 1 indicate nonoverlapping distributions, and scores closer to 0 indicate overlapping distributions. Hall-Lew (Reference Hall-Lew2010b) and Nycz and Hall-Lew (Reference Nycz and Hall-Lew2014) provided useful discussions of the utility of the Pillai statistic for studies of vowel merger. Hay, Warren, and Drager (Reference Hay, Warren and Drager2006) and Fridland et al. (Reference Fridland, Kendall and Farrington2014) also used and discussed Pillai.Footnote 4 We expect the Pillai values between /ɑ/ and /ɔ/ to be regionally different, based on the regional shift patterns. An ANOVA test indicates this is indeed the case (F(2,83) = 27.49, p < .001; South M = .55, West M = .17, North M = .60), with a Tukey honest significant difference post-hoc test confirming significantly lower Pillai values for the Westerners compared with Southerners (p < .001) or Northerners (p < .001). Once again, the North and South are not significantly different (p = .731).
Along with the presence or absence of vowel merger, the low back vowels show quite variable acoustic position depending on dialect.Footnote 5 To speak more concretely to the positions of these vowels in our data, we examine the (normalized) F1 and F2 positions of these vowels. ANOVAs testing the F1 and F2 position for /ɑ/ by region yields significant differences (F1: F(2,83) = 8.86, p < .001; South M = 1.03, West M = .97, North M = 1.21; and F2: F(2,83) = 45.20, p < .001; South M = −.97, West M = −1.00, North M = −.70). Tukey post-hoc tests identify that the North is the source of this significance for both F1 and F2 (North vs. South: F1 p < .01, F2 p < .001; North vs. West: F1 p < .001, F2 p < .001; West vs. South: F1 p = .485, F2 p = .706).
ANOVAs for /ɔ/ also yield significant differences (F1: F(2,83) = 16.61, p < .001; South M = .51, West M = .77, North M = .64; and F2: F(2,83) = 33.29, p < .001; South M = −1.28, West M = −1.06, North M = −1.08). Tukey post-hoc tests here indicate a primary difference between the South and the other two regions. For F1, /ɔ/ is significantly different between the South and North (p < .05) and South and West (p <.001) and marginally significantly different between the West and North (p = .050). For F2, the South is highly significantly different between the South and North (p < .001) and South and West (p < .001), but F2 is not different between the West and North (p = .847).
The lack of significant difference for /ɔ/ between the West and North suggests that, in the West, shift in /ɔ/ is involved in the merger with /ɑ/, a movement that actually aligns this vowel's position with the NCS-related shifts affecting the low back system in the North. Both dialects have a lowered (and fronted) /ɔ/, distinguishing both regions from the higher/backer Southern /ɔ/. As a result, we find a more traditional position for Southern /ɔ/ as a mid back vowel compared with these other dialect regions.
Quantifying the relative positions of /æ/, /ɑ/, and /ɔ/ as a (sub)system
Beyond differences among regions in terms of absolute F1/F2 position, many accounts of the NCS and the low back merger also hypothesize linkages between the position of /æ/ and the position of /ɑ/, and interrogating these interrelations is also a primary interest of the present paper. Evidence for this structural relationship has often been indirect, noting that a fronted /æ/ position often occurs with the absence of vowel merger (e.g., exhibiting “stable resistance” as per Labov et al. [Reference Labov, Ash and Boberg2006]) or that backed /æ/ co-occurs with merged vowels. Here, we wanted to examine the /æ/ to /ɑ/ linkage more directly, looking at the extent to which the distance between these vowel categories is stable across speakers or across regional varieties, similar to work by Gordon (Reference Gordon and Schneider2005), Strelluf (Reference Strelluf2014), and Bigham (Reference Bigham2010).
First, we use an ED measure to simply look at whether different regions maintain a similar distance between the low front (/æ/) and low back (/ɑ/) vowels. We might expect such a relationship given the suggestion of a structural linkage. This measure is plotted by region and, within region, by speaker in Figure 4. While speakers in the West have a slightly smaller ED on average than the other regional speakers, an ANOVA test of the EDs for the 86 speakers here indicates that there are not significant regional differences for this measure (F(2,83) = 2.58, p = .082; South M = 1.22, West M = 1.09, North M = 1.25). Thus, all groups have roughly similar distances between /æ/ and /ɑ/, indicating that indeed these vowels may be tethered together in some way.Footnote 6 Of course, this ED measure does not consider the absolute locations of these classes (which, based on the preceding F1/F2 comparisons, are substantially different), just their distance from one another.

Figure 4. /æ/ to /ɑ/ (onset) EDs, by region and speaker (dashed lines represent regional means).
While the regional means are relatively similar, we also note from Figure 4 that individuals within each region are variable. Considering the question of individual variability further, we can turn to ask whether the speaker-level differences in ED between /æ/ and /ɑ/ are related to the positions of /æ/ or /ɑ/, and to what extent individual vowel class positions are correlated with one another across individuals. Table 2 presents the results of Pearson's product-moment correlation tests for relationships among /æ/ to /ɑ/ ED and /æ/ F1, /æ/ F2, and /ɑ/ F2. These correlation tests look at all individuals without regard to their region. (Throughout we report r values rather than r2 values so that the direction of the correlation, positive or negative, is obvious.) As the tests show, the ED between /æ/ and /ɑ/ on a per-speaker basis is related to the position of /æ/. Table 3 shows correlations between the front-back position of /ɑ/ and the position of /æ/. While /ɑ/ F2 does not correlate with the distance between /æ/ and /ɑ/ (in Table 2), /ɑ/ F2 is highly correlated with the position of /æ/. This accounts for the relatively stable distance between these two vowels across speakers and groups and points to a structural linkage between these vowels that persists notwithstanding regional vowel shifts. Table 3 also includes a correlation test for /ɑ/ F2 with the merger status of /ɑ/~/ɔ/ as measured by the Pillai statistic. As the significant positive correlation shows, fronter /ɑ/ (higher normalized F2 values) correlate with more distinct low back distributions.
Table 2. Correlation tests for /æ/-/ɑ/ ED

Note: Brackets [] indicate nonsignificant correlation.
Table 3. Correlation tests for /ɑ/ F2

We can also examine a similar metric for the /ɔ/ class, asking whether there are systematic differences in the distance between /æ/ and /ɔ/ across regions. The ED between /æ/ and /ɔ/ for speakers and regions is shown in Figure 5. Though this vowel class participates in several regional vowel shifts (e.g., the North and West), it is rarely discussed as structurally tied to the other vowels in the same way as /æ/ and /ɑ/ are. In fact, the evidence for merger in many U.S. dialects would argue against any structural relationship, at least for the /ɑ/ and /ɔ/ vowels. Here, an ANOVA testing this ED measure finds a significant difference across regions (F(2,83) = 15.74, p < .001; South M = 1.55, West M = 1.18, North M = 1.42), with Tukey post-hoc tests indicating significant differences for the West versus North (p < .001) and West versus South (p < .01) comparisons but not the South versus North comparison (p = .103). In other words, the low back merger results in a change to the relative distance between these two vowels across dialects (unlike the stability across dialects found for the relative positions of /æ/ and /ɑ/).

Figure 5. /æ/ to /ɔ/ (onset) EDs, by region and speaker (dashed lines represent regional means).
Since the West is similar to the other regions in terms of the ED between /æ/ and /ɑ/, this indicates that Western /ɑ/ backs and raises as /æ/ retracts, and that collectively these two vowels move closer to /ɔ/. It also may be in line with an interpretation of Western low back merger as a process of approximation, as /ɑ/ moves into the space of /ɔ/. An additional question of interest, then, is whether /ɔ/ lowering is also occurring for speakers with retracted /æ/ and /ɑ/. Rather than examine this by region, as in Figures 4 and 5, we can simply test whether /ɔ/ height, as measured by (normalized) F1, is correlated with the position /æ/ or /ɑ/, measured by their F2 (since the majority of movement for those vowels is captured by F2 and not F1) or the degree of merger between /ɑ/ and /ɔ/, as measured by the Pillai statistic. Table 4 displays the results for these three correlation tests. /ɔ/ height is not correlated with the front-back position of /æ/ or /ɑ/, although, as should be expected, /ɔ/ F1 is correlated with /ɑ/~/ɔ/ Pillai. Lower /ɔ/ leads to less distinct, that is, more merged, low back vowels, a finding that also supports a merger by approximation. Again, though, we see that the relationship between /æ/ and /ɑ/ is much less independent than that with /ɔ/.
Table 4. Correlation tests for /ɔ/ F1

Note: Brackets [] indicate nonsignificant correlation.
Altogether, these findings support one primary conclusion, /æ/ and /ɑ/ maintain a structural relationship across the three major dialect regions of the United States.
PRODUCTION DISCUSSION
Thus far, we have examined differences in low vowel positions as realized across Northern, Southern, and Western dialects in the United States. We indeed found that the three vowel shifts often associated with these regions (the NCS, the SVS, and the California, or Canadian, Vowel Shift patterns) are present in our data. F1, F2, ED, and Pillai measures for the low vowels significantly differentiate the regions, with the position of /æ/ and the presence or absence of the low back vowel merger strongly diagnostic of region. Both correlations and the ED measure comparing /æ/ and /ɑ/ find all three regions maintain roughly the same distance between these vowels, regardless of participation in different regional shift patterns. We do not, on the other hand, locate such a relationship between /æ/ and /ɔ/ or /ɑ/ and /ɔ/ (with the exception of merged speakers for whom these vowel classes are no longer distinct).
These results provide empirical evidence to support the suggestion of earlier work hypothesizing a structural relationship for the low front and low back vowels, particularly that of the ANAE, which suggested the Inland North shows “stable resistance” to the low back vowel merger, and Gordon (Reference Gordon and Schneider2005) who suggested the low back merger can trigger retraction of /æ/. However, how do we reconcile the present results with previous work that, in looking for a structural relationship, failed to firmly find such a relationship? One issue may be in how and between which vowels the structural relationship was defined. For example, Bigham (Reference Bigham2010), though locating a correlation between /æ/ F2 and the ED between /ɑ/ and /ɔ/, did not find such a relationship at the level of the individual speaker. Here we found that the main relationship exists between /æ/ and /ɑ/, rather than correlating /æ/ with degree of merger, a different and perhaps less direct measure. In other words, the correlation with the merger found by Bigham may be a result of the structural repositioning of /ɑ/, rather than of the merger itself. A structural relationship between /æ/ and /ɑ/, as found in our work, does not necessitate that /ɑ/ and /ɔ/ have any particular structural alignment. In fact, the widespread merger of these vowels suggests the opposite, or that the need to maintain maximal dispersion for the low back vowels is not as pressing. This tendency toward conflation may be a reflection, perhaps, of a number of factors that make the low back vowels more likely to allow F1/F2 overlap such as a lower functional load, the additional feature of rounding and the frequent alternation noted historically between /ɑ/ and /ɔ/ for many contexts such as prenasal (strong, long) post-/w/ (water, watch), and pre-/g/ (dog, fog, log) words (Kurath, Reference Kurath1939; Labov et al., Reference Labov, Ash and Boberg2006).
Using a more direct approach, Strelluf (Reference Strelluf2014:215) did look at the relationship between /æ/ and /ɑ/, finding “when TRAP and LOT are treated abstractly as phonemes, a structural relationship exists between them.” Both Bigham's (Reference Bigham2010) and Strelluf's (Reference Strelluf2014) work suggest that a structural relationship can be observed, at a higher level of abstraction, but not at the level of the individual or the individual token. Our work appears to confirm this larger finding—that there is a linkage between the low front and low back vowel. Abstracting away from any particular regional shift pattern and assuming that vowels readjust gradually to the movements of other vowels in the system (for instance, to maintain margins of security that increase comprehension), we find a similar relationship correlating movements among these vowels regardless of region, but one that may not be upheld at the same time point by all speakers.
THE LOW VOWELS IN PERCEPTION
The pattern found in our production data—that regardless of the positions of /æ/ and /ɑ/, the space between the two vowel categories is (relatively) preserved—raises important questions about the phonological and perceptual ramifications of movements of the low vowels. Do the relative positions of /æ/ and /ɑ/ in a person's vowel system influence how that person hears the distinction between the vowel categories?
Because our data come from a joint perception and production project, we are able to consider how the same participants (n = 80) categorize vowel stimuli in the low vowel space and how these participants’ own positions of the low vowels relates to their perceptual performance. To recap from our methods, participants in our vowel perception experiment heard vowel stimuli from a series of continua between vowel pairs. Here we consider participants’ behavior for the /æ/~/ɑ/ continua, for which we have two pairs, sad~sod and pad~pod.
Figures 6 and 7 show the regional mean identification functions for the pad~pod and sad~sod continua, respectively. The figures move from the most /æ/-like stimuli (step 1, on left) to the most /ɑ/-like stimuli (step 7, on right). As Figures 6 and 7 indicate, participants across the three regions have, on average, similar percepts of our stimuli, and they typically move from near-categorical judgments of /æ/, at step 1, to about 60% judgments of /ɑ/, at step 7. This low rate of /ɑ/ judgments indicates our stimuli could have continued further into the low back vowel space (to obtain higher rates of /ɑ/ judgments). However, it is clear that listeners shift from hearing a majority of the low front to the low back vowel before step 7.

Figure 6. Perception of the pad~pod continuum by region for the subset (step 1 = most /æ/-like to step 7 = most /ɑ/-like).

Figure 7. Perception of the sad~sod continuum by region for the subset (step 1 = most /æ/-like to step 7 = most /ɑ/-like).
In line with the depiction in Figures 6 and 7, statistical analyses do not indicate that regional differences significantly predict participants’ perception. This is shown in Tables 5 and 6, which present results for mixed-effect logistic regression models (using the lmerTest package in R; Kuznetsova, Brockhoff, & Christensen [Reference Kuznetsova, Brockhoff and Christensen2014]) testing the effect of region (South or North or West) and continuum step (1–7) on whether listeners heard /ɑ/ rather than /æ/. Models included random intercepts for participant and random slopes for continuum step by participant.Footnote 7
Table 5. Fixed effects for pad~pod logistic regression model

Note: Brackets [] indicate nonsignificant correlation.
Table 6. Fixed effects for sad~sod logistic regression model

Note: Brackets [] indicate nonsignificant correlation.
This is unlike earlier findings for other vowel pairs in our perception data. For instance, in Kendall and Fridland (Reference Kendall and Fridland2012), vowel identification for the mid and high front vowels (category boundaries between /e/~/ε/ and /i/~/ɪ/) is significantly different for Southerners in comparison to Westerners and Northerners, and Fridland and Kendall (Reference Fridland and Kendall2012) demonstrated that regional effects persist even when significant participant-level acoustic measures are included in the models. However, unlike differences in /e/~/ε/ and /i/~/ɪ/ in which the regional shifts change the relative distance between the tested pairs in the vowel continuum task (e.g., /e/ and /ε/ reverse in relative position in Southern dialects, but not in Northern dialects), the low vowels are subject to shifts that change these vowels’ acoustic position in ways that do not affect the relative distance between them. In fact, critically, this relative distance, rather than the absolute position of these two vowels, ties the regions together in low vowel production, making otherwise disparate positioning of these vowels actually similar in the relation that obtains. Perhaps, in perception, such a relationship is also relevant, with categorization decisions based on relative distance rather than absolute position, a cross-dialect stability that /e/ and /ε/, for example, do not exhibit.
Instead, here, the fundamental phonological difference we find affecting the low vowels regionally and by speaker is whether or not there is a merged low back system, something not tested directly by our /æ/ to /ɑ/ perception task. As we have seen, the merger bears some relationship with the relative position of /ɑ/, but, simultaneously, this merger does not directly involve the /æ/ to /ɑ/ continuum. As a result, how shifts involving the low vowels affect perception of those categories may not be as obvious, at first glance, as for the mid front vowels where the regional shifts involved directly impact the tested continuum (e.g., both /e/ and /ε/). Given that individuals within regions exhibit variability, we also need to consider our listeners individually, based on whether they have, for example, a retracted/nonretracted /æ/ or a merged/unmerged system, rather than simply by regional grouping.
To better understand what factors (if any) help to account for patterns in the perception data, we ran a series of mixed-effect logistic regression models testing various acoustic measures as potential predictors for the perception data. These tests included a wide range of plausible factors, such as each individual's mean F1 and F2 for /æ/, /ɑ/, and /ɔ/, ED between /æ/ and /ɑ/, and low back Pillai scores. We also constructed a set of categorical predictors derived from several of these measures, such as grouping our participants into four quartiles based on the height (F1) of their /æ/ category or the frontness (F2) of their /ɑ/. These were used to test whether nonlinear or other coarser-level differences might emerge that would otherwise be missed in a search for linear relationships between predictors and the identification of the vowel categories (see Fridland and Kendall [Reference Fridland and Kendall2012] for a related discussion).
In the modeling process, each of the potential predictors was added individually to a base model that included continuum step (as a fixed effect) and a random intercept for participant and random slope for continuum step by participant. Models were then tested using typical likelihood ratio test procedures (cf. Baayen, Reference Baayen2008) to assess whether each predictor significantly improved model fit and was, therefore, significantly predictive. Low back Pillai score emerged through this modeling process as the only significant predictor of listeners’ percepts of the /æ/~/ɑ/ continuum. Fixed effects for the models including Pillai for pad~pod and sad~sod are presented in Tables 7 and 8, respectively. As can been seen in these models, larger Pillai scores, which indicate less category overlap between /ɑ/ and /ɔ/ (i.e., less merger) correspond to listeners hearing more /ɑ/ in the perception data.
Table 7. Fixed effects for pad~pod logistic regression model

Table 8. Fixed effects for sad~sod logistic regression model

This is demonstrated further in Figures 8 and 9, which show the mean identification functions for the pad~pod and sad~sod continua, respectively, this time organized into four quartiles (n = 20 participants per quartile) based on Pillai score. (The binning into quartiles here is simply for illustration—the statistical models presented in Tables 7 and 8 report the actual (numerical) value of Pillai as the statistical predictor.) The pad~pod data in particular show an orderly progression from hearing much more /æ/ for the listeners with high measures of low back merger to relatively more /ɑ/ for the nonmerged listeners. The sad~sod data show a less consistent pattern, in that the third quartile (participants with Pillai scores between .534 and .696) have the highest percepts of /ɑ/ for that continuum. However, we still note that the listeners with greatest degree of merger are hearing the least amount of /ɑ/.

Figure 8. Perception of the pad~pod continuum by Pillai in quartiles for the subset (step 1 = most /æ/-like to step 7 = most /ɑ/-like).

Figure 9. Perception of the sad~sod continuum by Pillai in quartiles for the subset (step 1 = most /æ/-like to step 7 = most /ɑ/-like).
PERCEPTION DISCUSSION
Our perception results, when examined through the lens of participants’ own production, indicate that listeners identify the boundary between /æ/ and /ɑ/ in a way that relates to their overall system for the low vowels (rather than, say, the regional positions of individual vowel classes). The most striking difference, as seen in Figures 8 and 9, is found for the participants with the highest degree of low back merger. These listeners appear largely to reject even our most /ɑ/-like stimuli as tokens of /ɑ/ and continue to classify words as containing the /æ/ vowel at high rates even for tokens that acoustically are quite back, in the region of many participants’ /ɑ/ vowels.
According to our production findings, speakers with low back vowel merger also tend to have a backer realization for that merged class, as well as more retracted /æ/ and /ɑ/ tokens, and, as a result, their low vowel system is, in effect, structurally distinct from speakers without this merger. It may be that this overall change—in effect, from a more quadrilateral low vowel space toward a more (retracted) triangular space (e.g., D'Onofrio et al., Reference D'Onofrio, Eckert, Podesva, Pratt, Van Hofwegen, Fridland, Kendall, Evans and Wassink2016)—is really what drives this difference in low vowel percepts between merged and unmerged speakers (rather than any direct relationship in absolute distance between /æ/ and /ɑ/), explaining why merger, but not absolute distance between the tested continuum vowels, is what emerges as significant. In other words, perception of this continuum is not about individual vowels’ positions but, rather, about something more systemic in the overall relation among the low vowels. Merger is the crux of this relationship distinction and indicates the most striking realignment of these three vowels. This, we believe, is in line with the sense implied by Labov's (Reference Labov2001) notion of a chain shift process, in that these vowel shifts are not isolated shifts, either in production or perception, but, instead, exhibit covariance.
Such a more system-governed relation among the vowels perceptually is supported by recent work by Maye, Aslin, and Tanenhaus (Reference Maye, Aslin and Tanenhaus2008) and Weatherholtz (Reference Weatherholtz2015), who examined whether listeners appear to expect a covariance relationship among novel vowel chain shifts, or whether they process these shifts independently. Maye et al. (2008) demonstrated that listeners exposed to a novel vowel shift adjust their expectations about vowel category membership in systematic ways (e.g., generalized lowering). In Weatherholtz (Reference Weatherholtz2015), listeners were able to use information about a part of a vowel shift presented during a training phase to generalize movements in other vowels. Work along these lines indicates that listeners are sensitive to the ways in which vowels are related to one another as systems or in particular subsystems.
Our own work here, as well as on the mid and high front vowel data elsewhere (Fridland & Kendall, Reference Fridland and Kendall2012; Kendall & Fridland, Reference Kendall and Fridland2012) and recent proposals by Sumner and Samuel (Reference Sumner and Samuel2009), indicate that listeners’ perception patterns are related to their production systems, but not in direct, one-to-one ways. (A handful of other recent studies identify similar kinds of results; e.g., Evans and Iverson [Reference Evans and Iverson2007]; Pinget [Reference Pinget2015].) Listeners hear the boundary between low vowel categories (and, e.g., mid front vowels; Fridland and Kendall [Reference Fridland and Kendall2012]) not through a direct mapping of F1 and F2 values to their own productions but rather through a more mediated process, one which seems to involve larger phonological or word-level representations and system-internal relationships than simple acoustic mapping.
Our results suggest that speakers understand vowels as systems, not as functions of their particular acoustic positions, in line with what we found here for production in terms of the relatively stable relation between the low front and low back vowel across regions. Likewise, in perception, it is not the absolute position that affects speakers’ perception along a vowel continuum between two vowel qualities. Instead, speakers perceive the continuum based on the relative relationship between those vowels within the larger system.
CONCLUSION
We examined the low vowel system for speaker-listeners in representative field sites within each of the three main U.S. dialects regions, the Inland North, South, and West. Each of these regions has been identified as participating in vowel shift processes that appear to be reshaping, in many ways, the vowel system of American English, often in contrasting ways inter-regionally. In the present work, we examined how the low vowels were positioned in acoustic space in each region, and we indeed find reflexes of contemporary vowel shift patterns in our data. However, we also wondered whether data on the relationship among the low vowels in each dialect region in the United States might best be understood by examining recurrent patterns of distribution among the low vowels across speakers, both within and among regions. Across regions, we found a linkage in the relative positioning of the low front and low back vowel, both in ED measures and correlations. We considered these patterns as evidence of a structural relationship between /æ/ and /ɑ/. Though our work only begins to explore this pattern, we consider these data to be suggestive of a realignment of vowel space triggered by the regional vowel shift patterns, in light of previous work on maximal dispersion (e.g., Liljencrants & Lindblom, Reference Liljencrants and Lindblom1972) and, perhaps, the more functional behavior of speakers who adjust their phonetic ranges to preserve comprehension, as suggested by Labov and Baranowski (Reference Labov and Baranowski2006). Finally, we began to explore what these production patterns across regions might mean from the standpoint of perception. Our results suggest that low vowel (/æ/~/ɑ/) perception is influenced by the degree of vowel merger in speakers’ systems, but not directly by absolute vowel position or region, suggesting that it is the larger relative system that affects how listeners perceive vowel variation.
APPENDIX A
The words examined for /æ/ (with pre-/g/ tokens noted), /ɑ/, and /ɔ/, for the production analysis of low vowels, were:
Word list: back (/æ/), bad (/æ/), bag (/æg/), bat (/æ/), bought (/ɔ/), caught (/ɔ/), cause (/ɔ/), chad (/æ/), chat (/æ/), cob (/ɑ/), cod (/ɑ/), cop (/ɑ/), cot (/ɑ/), cough (/ɔ/), dad (/æ/), dock (/ɑ/), dog (/ɔ/), fad (/æ/), fat (/æ/), hack (/æ/), hag (/æg/), half (/æ/), hawk (/ɔ/), hock (/ɑ/), pad (/æ/), paw (/ɔ/), pod (/ɑ/), pot (/ɑ/), sack (/æ/), sad (/æ/), sag (/æg/), stack (/æ/), stag (/æg/), tab (/æ/), & tap (/æ/).
Reading passage: aft(er) (/æ/), back (/æ/), black (/æ/), caught (/ɔ/), chat (/æ/), coffee (/ɔ/), cop (/ɑ/), dog (/ɔ/), dogs (/ɔ/), fath(er) (/ɑ/), had (/æ/), hot (/ɑ/), pot (/ɑ/), slosh (/ɔ/), stop (/ɑ/), talk (/ɔ/), & toss (/ɔ/). (The reading passage text is available in Kendall, Reference Kendall2013:56–57).
APPENDIX B
Formant values and tracks at all steps along synthesized vowel continua from perception study stimuli are included in Tables B1 and B2 and Figures B1 and B2.
Table B1. Formant frequencies for pad~pod stimuli, step 1 to step 7

Table B2. Formant frequencies for sad~sod stimuli, step 1 to step 7


Figure B1. Formant frequencies for pad~pod stimuli.

Figure B2. Formant frequencies for sad~sod stimuli.