


I. Introduction and Background
In the wake of the shootings at the magazine Charlie Hebdo in 2015, France experienced an unprecedented wave of terror attacks. In 2016, the number of foreign tourists visiting France decreased by approximately 1.5 million compared to 2015 (CRT, 2017). The question that we ask in this article is: What is the effect of the wave of terror in France on wine tourism? We use an original dataset on the number of visitors to La Cité du Vin, a wine museum located in Bordeaux, France, to analyze the evolution of the demand for attendance at this museum before, during, and after the wave of terror.
Studies dealing with the determinants of attendance of wine museums are scarce. Research has focused on the effect of price on demand for the arts (Seaman, Reference Seaman, Ginsburgh and Throsby2006). Since the museum's admission price is fixed, the current study focuses instead on the impact of several events on the revenue of La Cité du Vin. The literature on demand for attendance in the cultural field suggests several potential determinants not related to price: public and school holidays periods (Einav, Reference Einav2007), weather (De Roos and McKenzie, Reference De Roos and McKenzie2014), business cycle (Skinner, Ekelund, Jr., and Jackson, Reference Skinner, Ekelund and Jackson2009), among others. The demand for attendance at sporting contests allows us to address the impact of new arenas and to discuss the persistence of a positive effect on attendance (honeymoon effect) (Leadley and Zygmont, Reference Leadley and Zygmont2006).
Recent research suggests that using Internet search indexes relating to a destination improves the accuracy of time series models in forecasting the tourism demand (Önder and Reference Önder and GunterGunter, Reference Önder and Gunter2016). Addressing individual attractions, Volchek et al. (Reference Volchek, Song, Law and Buhalis2018) find a high correlation between Google Search queries concerning the most popular London museums and actual visits. Baidu Analytics is used by Huang, Zhang, and Ding (Reference Huang, Zhang and Ding2017) to forecast flows of visitors at the Forbidden Palace in Beijing.
The negative effect of terrorism on tourism demand is well documented: sharp reduction in tourist arrivals and expenditures in the incident regions (Sönmez, Backman, and Allen, Reference Sönmez, Backman and Allen1993), significant decline in the numbers of visitors (Richardson et al., Reference Richardson, Gordon, Moore II, Kim, Park, Pan, Richardson, Gordon and Moore2005), followed by a very slow process of recovery (Frey, Luechinger, and Stutzer, Reference Einav2007). Some destinations can also benefit from certain terror events (Araña and León, Reference Araña and León2008) because tourists tend to replace risky destinations with safer ones when there is a threat of terrorism (Sönmez, Reference Sönmez1998). Internet search trends are similarly used by researchers to measure public attentiveness and issue salience, including in the case of terrorism (Mellon, Reference Mellon2013). Searches for “terrorism” might be a good proxy for this concern (Ripberger, Reference Ripberger2011).
II. Data
To estimate the causal impact of terrorism on wine tourism, we collected attendance data at the La Cité du Vin,Footnote 1 which opened in June 2016. We use daily information on the number of visitors from the museum's opening through December 31, 2017 to estimate a demand equation for the museum (see Figure 1). These high-frequency data will allow us to assess the impact of the aforementioned terrorist attacks using distributed-lag time series models.
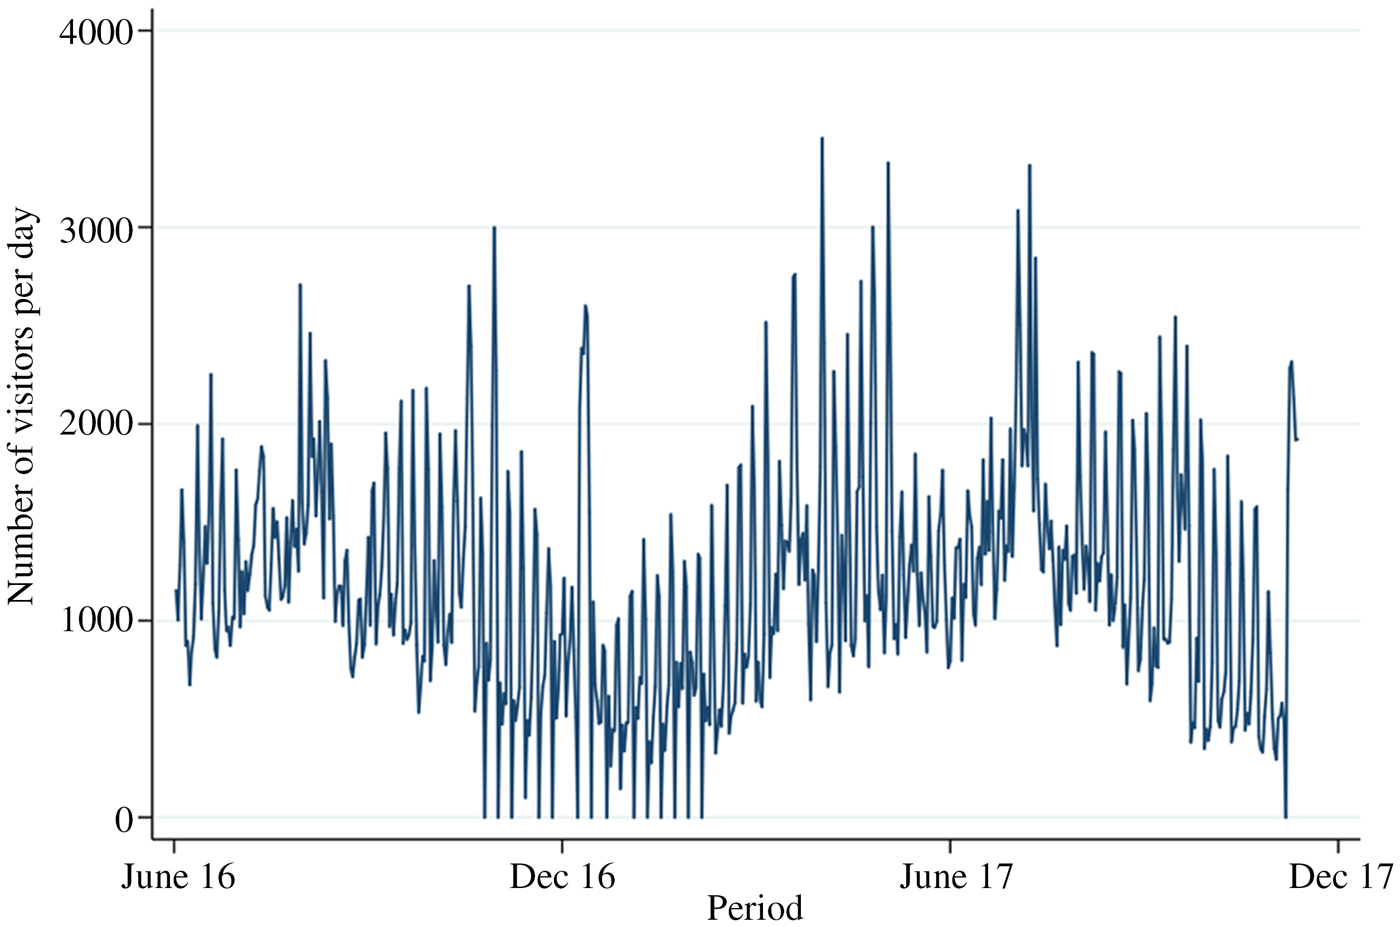
Figure 1 Number of Visitors per Day at La Cité du Vin June 1, 2016–December 31, 2017
The number of visitors per day exhibits strong intra-weekly variations with pronounced weekend peaks. A correlogramFootnote 2 suggests an autoregressive model with seven lags (AR(7)). We include a set of dummy variables to control for potential differences in attendance over the week. A monthly time trend allows us to control for some degree of variation in the number of visitors over the month. Households typically have more money at the beginning of the month. However, visiting a museum is a luxury like most cultural goods and the decision to visit La Cité du Vin, for some households, may only occur later in the month, once normal goods are consumed. A general time trend is used to check whether the museum has experienced a honeymoon effect since its opening. We use the average daily temperature and a dummy variable that equals 1 if the day in question was rainy and 0 otherwise. Temporal dummies capture the effect of the presence of cruise ships in the city, as suggested by Gordin and Matetskaya (Reference Gordin and Matetskaya2012). On July 2, 2017, France inaugurated a new high-speed railway line linking the capital city to the city of Bordeaux, which reduces the travel time from Paris to Bordeaux by more than an hour. We use a control variable to assess the impact of this major infrastructural development on the demand for attendance at La Cité du Vin (0 before July 2, 2017, 1 after that date). We control for the general attractiveness of the city of Bordeaux using the monthly number of French and foreign passengers arriving at Bordeaux airport (provided by Bordeaux Métropole Tourism Barometer).
Google Trends (GT) data offer insight about the intensity with which people search for information on the museum.Footnote 3 We use the same search engine to proxy the intensity of people's concern about terrorist attacks. We searched for the keyword “terrorism” in both French and English, as suggested by Mellon (Reference Mellon2013). These web analytics, which vary from 0 to 100, are integrated into our model with a series of lags (one- and two-week lag). As an alternative approach, we use a set of 15 time dummies to identify the two-week period following each attack. The French population experienced no fewer than 14 days of terror over the period investigated.
Table 1 presents descriptive statistics. We have complete information for 426 days of attendance. The average number of visitors is around 138 per hour. Temporary exhibitions account for 46% of the sample period, and school holidays and bank holidays account for 38%. Cruise ships dock frequently on Bordeaux (18% of the time). Around 550,000 air passengers, mostly foreigners, travel to Bordeaux every month.
Table 1 Descriptive Statistics

III. Results
We use two estimators to identify the main determinants of the number of La Cité du Vin visitors per hour.Footnote 4 First, we use a negative binomial regression model with a robust covariance matrix estimator, as suggested by Cameron and Trivedi (Reference Cameron and Trivedi2005), coupled with an AR(7). Indeed, unless count data are equi-dispersed, the usual Poisson maximum likelihood estimator standard errors will be wrong. Lags are used in this framework to deal with the presence of strong autocorrelation in the residuals. We also run a Poisson regression allowing for autocorrelation and over-dispersion (Schwartz et al., Reference Schwartz, Spix, Touloumi, Bacharova, Barumamdzadeh, Le Tertre and Saez1996) using the arpois user-written command in Stata. Although arpois offers a clear advantage over the usual negative binomial estimator in dealing with the time series dimension of our data, it does not compute robust standard errors. To overcome this limitation, and because the standard errors are not homoscedastic here, we bootstrap our estimates 500 times to obtain consistent standard deviations.
Table 2 displays four regression models. Regressions (1) and (3) contain the coefficients obtained using the negative binomial estimator with seven auto-regressive lagged terms (Neg. Bin. – AR hereafter). Regressions (2) and (4) show the results using the alternative Poisson approach (Poisson – AR hereafter). In regressions (1) and (2), we use GT to proxy the intensity with which people worry about terrorism in both English and French. In regressions (3) and (4), we use 15 time dummies to check whether the attendance at La Cité du Vin varied significantly over the first two weeks after an attack. These various coefficients are reported in Table 3.
Table 2 Main Determinants of the Demand for Attendance at La Cité du Vin Museum

Robust standard errors in parentheses for models (1) and (3). Bootstrapped standard errors with 500 replications for models (2) and (4). ***p < 0.01, **p < 0.05, *p < 0.1.
Table 3 Impact of the “Terrorism” Variables

Marginal effects have been generated using the margins command in Stata and are available from the authors upon request.
The results are stable across the specifications and do not vary much with the estimator used. We observe strong positive AR(1) and AR(7) effects and a mild negative AR(2) effect.Footnote 5 School and bank holiday coefficients have the expected positive sign (+4.31 and + 46.8 visitors per hour, respectively).Footnote 6 Attendance figures are also significantly higher over the weekend, especially on Saturdays (+35.31 visitors per hour) and significantly lower on Mondays (–32.1 visitors per hour). Similar attendance scores for Sundays (reference category) and for Tuesdays, Wednesdays, and Fridays. The museum is closed on Thursdays. Attendance is lower in warmer weather (–1.49 visitor per hour per degree Celsius) whereas rainy days encourage people to visit the museum (+15.9 visitors per hour). Attendance is also slightly lower during the spring than in other seasons. We do not detect any significant attendance patterns over the month. However, the general time trend coefficient is negative and significant, suggesting a limited but real honeymoon effect: attendance has decreased steadily over time since the museum opened. The marginal effect is around –0.72 visitors per day or 264 visitors per year. Neither the new high-speed railway line between Paris and Bordeaux nor the presence of cruise ships seem to affect the demand for attendance at La Cité du Vin. The same is true for the number of French passengers commuting via Bordeaux airport. In contrast, the demand for attendance is positively affected by the number of foreign passengers (0.13 additional visitors per hour for 1,000 additional foreign passengers). Temporary exhibitions are a good way to attract a substantial number of additional visitors (+27.2 visitors per hour). Last, the intensity of Google searches associated with La Cité du Vin conducted one week before the visit has a positive effect on attendance (+2.15 visitors per hour per additional GT percentage point).
Model (4) suggests that a given terrorist attack had a negative impact on the number of visitors to La Cité du Vin at 4 and 13 days after the attack (–25.73 and 13.73 visitors per hour, respectively). This amounts to a loss of 365.6 visitors after each terrorist attack, which represents a total cost of 5,119 visitors for the 14 successive terrorist events over the sample period. The results obtained using the GT indices for the keyword “terrorism” in French and English suggest that 1 percentage point of additional concern/interest in the wave of terror had varied effects on the demand for attendance at the museum. Foreign visitors concerned about the attack seem to have visited La Cité du Vin in greater numbers one week after the attack and in smaller numbers three weeks after the attack. The positive effect is probably due to the decision made by foreign visitors already present in Europe to visit Bordeaux to escape the areas directly affected by the attack (mainly the Paris urban area). The negative effect three weeks after the attack probably reflects the decision made by a significant number of cautious visitors to cancel their trips to France. We observe opposite effects for the keyword “terrorisme” in French. A significant proportion of local visitors probably decided to avoid visiting public spaces immediately after the attack and thus postponed their visits by about two weeks.
IV. Discussion and Conclusion
In this article, we analyze the determinants of the demand for attendance at La Cité du Vin, a wine museum in Bordeaux, to examine the effect on wine tourism during France's recent wave of terror. We conclude that the museum lost about 5,000 visitors over 426 days, during which 14 successive terrorist attacks occurred. This corresponds to almost 1% of the total number of visitors during the sample period.
We plan to extend the analysis to other tourism statistics in the future to confirm the results obtained in this article. In particular, it would be interesting to apply the same methodology to the number of hotel nights in some popular wine tourism destinations in France. In regards to La Cité du Vin, more observations would be needed to better characterize the seasonal pattern of the demand for attendance at this museum.


