


I. Introduction
Wine consumption is affected by a variety of economic, social, cultural, psychological, demographic, and attitudinal factors (e.g., Yakovlev and Guessford, Reference Yakovlev and Guessford2013; Holmes and Anderson, Reference Holmes and Anderson2017; Gustavsen and Rickertsen, Reference Gustavsen and Rickertsen2018; Fogarty and Voon, Reference Fogarty and Voon2018; Hart and Alston, Reference Hart and Alston2019). Personality traits have been found to affect an individual's liking of food (e.g., Shipman and Durmus, Reference Shipman and Durmus2016), food choices (e.g., Keller and Siegrist, Reference Keller and Siegrist2015), sweet taste preference in wine (Saliba, Wragg, and Richardson, Reference Saliba, Wragg and Richardson2009), emotional response elicited by wines (Mora, Urdaneta, and Chaya, Reference Mora, Urdaneta and Chaya2019), and alcohol consumption (e.g., Malouff et al., Reference Malouff, Thorsteinsson, Rooke and Schutte2007).
Personality traits are frequently measured by the Big Five personality model (McCrae and Costa, Reference McCrae and Costa2003). This model consists of five latent traits: openness to experience, conscientiousness, extraversion, agreeableness, and neuroticism, which frequently are referred to as the OCEAN traits. Openness to experience is associated with curiosity, creativity, preference for variety and novelty. Conscientiousness is associated with organization, self-discipline and the ability to work hard to reach the goal. Extraversion is associated with assertiveness, sociability, talkativeness, and the tendency to seek stimulation in the company of others. Agreeableness is associated with the tendency to be compassionate and trusting towards others. Neuroticism is associated with the degree of responsiveness to psychological stress. These traits are not directly observable but may be created on the basis of questions in surveys.
Gustavsen and Rickertsen (Reference Gustavsen and Rickertsen2018) found substantial effects of age, period, and cohort variables on the frequency wine consumption using Norwegian data for the period 1991–2015. Moreover, they found that marriage, increased education, high income, and living in a big city increased the probability of drinking wine. Attitudes such as hedonism and religion were also important for the probability of drinking wine. Our primary objective is to investigate the effects of the personality traits on wine and beer consumption after controlling for key socioeconomic and demographic effects reported in Gustavsen and Rickertsen (Reference Gustavsen and Rickertsen2018). The five latent variables representing the OCEAN traits are included in double-bounded beta regression models to estimate the associations between personality and consumption frequencies of wine and beer. To our knowledge, the effects of personality traits on consumption frequencies of wine and beer have not been investigated.
II. Data and Methods
To analyze the associations between personality and frequencies of wine and beer consumption, the Norwegian Monitor (NM) database was used. NM is the most comprehensive consumer survey in Norway. It is a nationally representative cross-sectional survey of adults aged 15 to 95 years, which has been conducted biannually since 1985. It includes questions related to socioeconomics, consumption frequencies, attitudes, time use, morality and health, and much more. Our study is based on the 2015 survey, which was the first year that included questions describing the OCEAN traits. We included 3,482 respondents aged between 18 and 80 years.
Table 1 shows the frequencies and percentage distributions of yearly wine and beer consumption. The values are based on the answers to the questions: “How often do you drink wine (any kind of wine)?” And “How often do you drink beer (any kind of beer)?” Less than 1% drank wine every day and 15% never drank wine. Almost 20% drank wine one or more times a week, about one-third drank wine a few times a month, and about 20% drank wine 3–11 times a year. The pattern of beer consumption is similar, but about 25% never drank beer.
Table 1 Frequencies and Percentage Distributions of Wine and Beer Consumption

Note: Based on 3,482 respondents.
Based on John, Donahue, and Kentle (Reference John, Donahue and Kentle1991), Engvik and Clausen (Reference Engvik and Clausen2011) developed a 20-item Norwegian version of Big Five that is included in the NM survey. This short version was developed for situations where time is limited. The version reached adequate levels of structural validity, factor divergence, maximal representation, test-retest reliability, and criterion validity (Engvik and Clausen, Reference Engvik and Clausen2011).
To construct the latent personality variables, we used the graded response model suggested by Samejima (Reference Samejima1969). This model is well suited to construct latent variables from discrete and graded responses. To estimate the frequencies of wine consumption, we used the beta regression setup in Ferrari and Cribari-Neto (Reference Ferrari and Cribari-Neto2004). However, to consider respondents who never drank wine and respondents who drank wine every day, odds ratios were included in the model (Stasinopoulos et al., Reference Stasinopoulos, Enea, Rigby and Hossain2017).
III. Estimation Results
The covariates are defined and discussed in more detail in Gustavsen and Rickertsen (Reference Gustavsen and Rickertsen2018). In addition to these covariates, we included the estimated OCEAN traits. The covariates and estimation results for the frequency of the wine consumption model are shown in Table 2.
Table 2 Estimation Results for the Double Censored Beta Regression for Wine Consumption
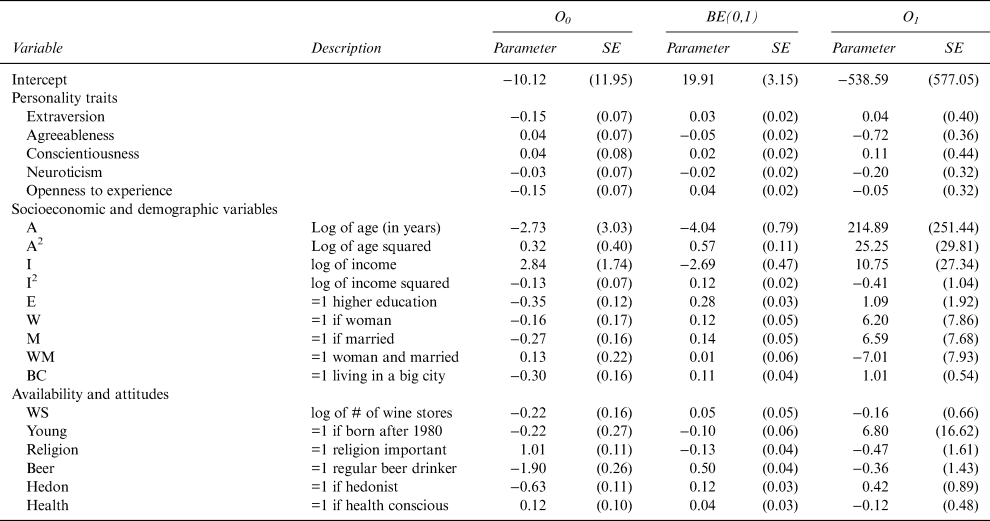
Notes: The estimation results are based on 500 bootstraps and 3,482 respondents. The numbers in the SE columns are the associated standard errors.
The third and the fourth columns show the estimated parameters and associated standard errors from the O 0 part of the model, that is, the odds for not drinking wine. The parameter estimates have no natural interpretation beyond sign and significance. The higher the degree of extraversion and the higher the degree of openness to experience, the higher are the probabilities for drinking wine. Furthermore, higher education, being a regular beer drinker, and being a hedonist are associated with increased probabilities for drinking wine. Finally, respondents who find religion to be important have a reduced probability of being a wine drinker.
Columns five and six in Table 2 show estimated parameters and associated standard errors of the beta regression (BE(0,1)) part of the model. Agreeableness reduces the expected frequency of wine consumption, and openness to experience increases the expected frequency of wine consumption. Higher education, being female, being married, living in a big city, being a regular beer drinker, and being a hedonist increase the expected frequencies of wine consumption, while a belief in the importance of religion decreases the expected frequency of wine consumption.
The two last columns in Table 2 (O 1) show estimated parameters and associated standard errors for the odds of being a daily wine drinker. The only significant personality trait is agreeableness, which is associated with a reduced probability of drinking wine every day.
Table 3 shows the results for the beer model. There are few effects of personality traits. The higher the degree of agreeableness, the lower the probability of drinking beer. Furthermore, increased conscientiousness reduces the expected frequency of beer consumption. There are several effects related to the other variables. Older respondents drink beer more frequently, and younger respondents drink wine more frequently. Wine is more popular with women and beer is more popular with men. Living in a city and being born after 1980 increases the expected frequencies of beer consumption. Quite interestingly there seems to be a complementary relationship between frequencies of wine and beer consumption. Being a regular wine drinker increases the frequency of beer consumption and vice versa. Less surprisingly, respondents who find religion to be important have a reduced frequency of beer drinking.
Table 3 Estimation Results for the Double Censored Beta Regression for Beer Consumption

Notes: The estimation results are based on 500 bootstraps and 3,482 respondents. The numbers in the SE columns are the associated standard errors.
To investigate the quantitative effects of personality traits on the frequencies of wine and beer consumption, we performed some simulations. In each simulation, we calculated the expected difference in frequency of wine or beer consumption between respondents in the 90th quantile (respondents who score high on the trait) and respondents in the 10th quantile (respondents who score low on the trait) for each trait. The other personality traits and covariates were held constant on their mean values in each simulation, and each simulation was bootstrapped using 500 repetitions.
Table 4 shows the expected yearly consumption frequencies for wine and beer in the 90th and 10th quantiles for each trait and the difference between these two quantiles. High scores on extraversion and openness to experiences increase the frequency of wine consumption, high scores on agreeableness reduce frequency, and conscientiousness and neuroticism have no statistically significant effects on the frequencies at the 5% level of significance. For example, respondents in the 90th quantile of extraversion are expected to drink wine 39.5 times per year, while respondents in the 10th quantile are expected to drink wine 35.6 times per year. There were no significant effects of the personality traits on the frequencies of beer consumption.
Table 4 The Effects of Personality on Frequencies of Wine and Beer Consumption
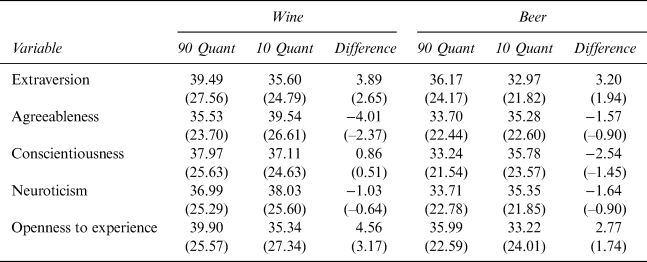
Notes: The estimation results are based on 500 bootstraps and 3,482 respondents. The number in the parentheses are the associated t-values.
IV. Conclusions
Personality traits are more associated with frequencies of wine consumption than frequencies of beer consumption, that is, beer drinkers are more evenly distributed along personality traits. The probability of not drinking wine is negatively associated with agreeableness and openness to experience, and the probability of drinking wine every day is negatively associated with agreeableness. Furthermore, agreeableness is negatively associated with the frequency of wine consumption and openness to experience is positively associated. Respondents who score high on extraversion or openness to experience drink wine more often than respondents who score low on these traits. Finally, respondents who score high on agreeableness drink wine less frequently than respondents who scored low.
How can these results be explained? One possible explanation for the effect of extraversion is that it is connected with meeting people, talking to people, attending parties and other social gatherings where wine is frequently consumed. Furthermore, high score on openness to experience may indicate high cultural capital, a desire to try new experiences, and to participate in cultural events where wine is frequently consumed. Agreeableness is associated with reduced frequency of wine consumption. However, the effect may be indirect. There may be cultural or religious effects associated with agreeableness that reduce the frequency of wine consumption.


