


I. Introduction
Twenty years ago, Amsterdam's Heineken had higher sales than Leuven's Interbrew. Both have taken over many companies since, but the acquisitions by the latter, now called AB Inbev SA, were more frequent and, especially, tended to be bigger. As the Economist (2019a) points out, one risk in an aggressive mergers and acquisitions (M&A) strategy is the winner's curse: overly optimistic buyers might end up with overpriced acquisitions, financed by debt that eventually becomes too much of a burden and thus pushes the firm towards indiscriminate cost cutting. We address the question of whether AB Inbev did overpay and whether the runner-up, Heineken, was more careful.
AB Inbev SA has a complex history. A company named Artois was a very active acquiror of fellow Belgian breweries in the 1800s–1900s. Its successor after a 1988 merger, Interbrew, started buying internationally as of 2000, and serially transformed itself into Inbev in 2004, AB Inbev in 2008, and AB Inbev SA in 2016, with a world market share of almost one-quarter against about 10% for Heineken. The company's acquisitions, though, were often deemed to be too costly. Interbrew's 2004 announcement of talks with Brazil's Ambev, a 3G company, for instance, was followed by a 5% drop in the share price. The Economist (2019a) commented that 3G's strategy of levered takeovers followed by cost cutting “has hit the wall” and occasionally led to large losses; an eventual break-up of the group is thinkable, they opined. Compared to all that, the brewing industry's runner-up, Heineken, seems to do well. Figure 1 illustrates some of these trends. Note AB Inbev's rapid growth and huge size despite the recent drop in equity values, high debt in both companies, and a much stronger dilution, in AB Inbev, of the 2000 shareholders’ positions relative to subsequent equity issues and debt. That said, in our sample, the original shareholders still did better in AB Inbev than in Heineken.

Figure 1 The World's Top Brewers: Evolution of Enterprise Value and Its Components, 2000–2018
Notes: Each graph shows a stacked plot of the components of enterprise value, in billions of USD, with shares existing in 2000 shown in the bottom, subsequent issues added above, and debt on top. The scales are different. Note that the evolution of, say, the market value of the 2000 share cohort is an incomplete indicator of return as dividends are ignored.
The Economist's indictment about 3G takeovers includes overpaying, over-levering, and indiscriminate streamlining. In a prelude to this article, available on request, we did consider the company's financials compared to the world's top-10 (for 2018) and to Heineken's (for 2000–2018). The firm looks exceptionally efficient, and there is no evidence, compared to Heineken, of lower growth in sales or cash flows, nor of excessive cost cutting. AB Inbev's debt is high, they admit, and is being actively lowered by halving the dividend, and by divesting, but is not unusually high. In this article, we focus on the first issue the Economist (2019a, 2019b) raises, overpaying.
To that end, we first study monthly and weekly stock returns of IIAB-I (henceforth our label for the entity Interbrew/Inbev/AB_Inbev/AB_Inbev_SA) and Heineken, corrected for risk. For both firms, the risk-corrected average return (“alpha”) is statistically and economically close to zero, as is the total return. To assess the role of takeovers in this overall risk-adjusted performance, we add an event study that measures stock-market reactions to all 113 Reuters takeover announcements by the two leading firms since Interbrew's 2000 IPO. This event study reveals that IIAB-I's stock price typically drops by 1.5–2.5% per takeover. For Heineken, in contrast, there is no statistically clear effect.
This finding raises interesting issues. We argue that this is unlikely to be a “permanent” impact and unbiased reflection of the takeover's impact on the acquirer value. The more plausible interpretation, in light of IIAB-I's satisfactory realized total return, is that the initial reactions were, on average, reversed afterwards. Malatesta and Thompson (Reference Malatesta and Thompson1985) offer a possible explanation: an initial rise in uncertainty depresses the price but is reversed as uncertainty is resolved.Footnote 1 When we do extend the test window from one month to three, the cumulative average effect is much smaller than the one-month effect and statistically insignificant. We actually do find the same pattern for Heineken, except that it happens in a few weeks rather than a few months. While the temporary-uncertainty hypothesis is plausible for the larger deals, it is not clear whether such an effect can amount to much for most deals, which are quite small; that is, the U- or V-shaped pattern might not always be rational.
This case study may be relevant to readers interested in the industry or in M&As per se. Our work also brings up two general methodological challenges. First, short-horizon event studies may miss a reversal and thus provide an incomplete assessment of the value effects of M&As. This risk has to be weighted against the loss of power that comes with a longer event window. Second, recognition of the heterogeneity matters. Since the two breweries are serial acquirers, we can run, per company, one regression that immediately delivers the average announcement effect for that firm,Footnote 2 and we do so at both the weekly and monthly frequencies. Compared to that, the unconditional average reaction pattern delivered by a standard methodology may suffer from an aggregation bias if reactions to events are heterogeneous. The time required for digestion of the information must vary substantially across events and hence, potentially across acquirers. We find that Heineken investors make up their minds within two weeks, on average, while IIAB-I's shareholders need two months to evaluate the (larger) deals; but when we use a panel with one common impact across firms, in the spirit of traditional event studies, then in both weekly and monthly data the reversals become statistically invisible.
II. Background Material
A. The Main Competitors
The two top contenders’ histories are quite different. In 1717, one Sébastien Artois, a burgess of Leuven in the then Austrian Netherlands, bought a local brewery where he had been a master brewer since 1708. Three centuries later, the descendants of the last Artois’ in-laws still are the brewery's largest private shareholders. Otherwise, the company has changed substantially. Following some major M&As and many minor takeovers, it has become by far the world's largest by volume, revenue, and market capitalization; its common stock was worth as much as the equity of the next biggest five brewers combined, and its sales volume is almost two and a half times Heineken's.Footnote 3 Heineken, in contrast, never merged. It did almost as many takeovers (Figure 2) as its rival, but even the major targets were nowhere as large as Anheuser Busch or SAB Miller. Its most ambitious acquisition, done together with Carlsberg, was Britain's Scottish & Newcastle, whose assets were divided. It is still very Dutch, with a clear location (Amsterdam) and a management and a board dominated by Dutchmen. AB Inbev, in contrast, is de facto hardly Belgian anymore: legally still a resident of Leuven, its operations are now run from New York by a team dominated by Brazil's 3G Capital.

Figure 2 Numbers of IIAB-I, Heineken, and Carlsberg Takeover Announcements per Year Since 1999
Source: Reuters, sorting on Interbrew, Inbev, AB Inbev, Heineken's.
The main events in the two companies’ family trees are shown in Figure 3. Interbrew was the result of a 1988 merger between Artois and Belgium's then second-largest brewer, Piedboeuf. It first acquired Canada's Labatt (1995), and in 2000 bought Withbread and Bass in the United Kingdom and Diesels, Gilde and Spaten in Germany. This made the group, unlisted until the end of 2000, the world's lead brewer by volume. (Anheuser Busch still led by revenue, at that time; Heineken was close; SAB Miller was not yet around in their final form.) One year later, Beck's (Germany) was bought. In 2004, Interbrew, by then listed in Brussels and New York, merged with Ambev, a breweries group from Brazil run by 3G Capital, the private-equity group that later also organized highly visible mergers like Heinz–Kraft and Burger King–Tim Hortons. Ambev itself was the result of a 1999 merger between Brahma and Antarctica, at the initiative of 3G Capital, the then new owners of Brahma. In 2008, the Interbrew-Ambev entity, Inbev, took over Anheuser Busch, restyled itself into AB Inbev, and moved its operational headquarters to New York. In 2016, AB Inbev acquired SAB Miller, itself the result of a M&A process involving company clusters in South Africa (SA Breweries), the United States (Miller), and Australia (Foster's).

Figure 3 AB Inbev's and Heineken's Family Trees
Notes: Our sample contains 38 events not shown in the diagram where smaller (and often private) breweries were acquired by one of the above companies: AB Inbev (7), Ambev (1), Anheuser Busch (4), Foster's (8), Interbrew (6), Labatt (5), Miller (5), and SAB Miller (2).
Source: Wikipedia (various pages).
Heineken engaged in many takeovers too, but never went as far as its Leuven competitor. Its larger subsidiaries include Amstel (NL; acquired in 1968), Murphy's (IE; 1983), and then five companies from the portfolio of Scottish & Newcastle, a group taken over in 2008 jointly with Carlsberg. Most recently, Heineken bought Femsa (MX), Asia Pacific (SG), Lavsko (SL), Lagunitas (US), and Brazil Kirin (BR). The company has a long history as an exporter to the United States, where in 1933, it was the first to take advantage of the relaxation of the 1920 Prohibition law. Heineken produced a beer of 3.2% volume, briefly the U.S. legal alcohol limit.
Carlsberg, Europe's number three in brewing, was far less active during our sample period, which runs from early December 2000 (the first full month after Interbrew's IPO) to the end of March 2019. Counting just the first announcement of a takeover or an acquisition plan as an event, IIAB-I showed up in Reuters with 63 events, Heineken with 50, and Carlsberg with just 21.
B. The Economics of Consolidation in the Brewing Industry
Malting and brewing is a mature industry, both in the sense that it has very old roots and that its overall growth is low.Footnote 4 The technologically oldest segment, however, is currently growing much faster. Traditionally, brewing worked at room temperatures (except in the summer), using yeasts that, when spent, raise to the top as a thick froth (“top fermentation”). Since the mid-1400s, Bavarian breweries gradually adopted yeasts that worked at much lower temperatures—achievable in winter-ice-cooled caves in the Bavarian Alps—and that, when spent, tend to sink (“bottom fermentation”). The currently standard “lager” yeast was isolated in the Carlsberg brewery in the late 1800s. Bottom-fermentation presently relies on cooling installations, rather than caves or tunnels with stored winter ice, and goes on all year. Most modern “craft” beers are top-fermentation products; more traditional examples include the stouts and ales in the British Isles, Germany's weizen type beers, and the Belgian “abbey” beers. The top-fermentation-beer market segment exhibits more growth, more entry/exit, more innovation, and larger profit margins but remains volume-wise dwarfed by the bottom-fermentation section. In the latter segment, growth is low or negative, except in traditionally wine-drinking countries or other recent-adopter markets.
The combination of a mature industry and the technology that relies on cooling has led to consolidation. In bottom-fermentation brewing, size does matter because boiling and especially prolonged cooling come with strong economies of scale: brewing 1,000 hectoliters in one go is much cheaper than in separate 200- or even 20-hectoliter batches, the more traditional sizes in micro-brewing. By 1990 the purely technical scale-economy story was largely over. In all of the major mergers shown in Figure 3, the main brands and plants survived: technical economies of scale from further concentration of production had fallen below the extra transportation costs. However, economies of scale and scope still arose in distribution, marketing, and management. Most of Artois’ minor Belgian acquisitions earlier in the 20th century were already about ownership of the acquiree's distribution outlets, including associated pubs and chains of pubs. Currently, cross-selling into other national or regional distribution networks is a key strategy: the small set of world brands like Stella, Corona, and Bud can quickly be distributed globally using the combined network. Regional brands do the same on a smaller scale, like selling Brazil's Brahma in the rest of Latin America. Small local brands, facing new intra-company competition, often disappear.
Another possible motive for consolidation, akin to exploiting economies of scope, is value creation via technically better management. When in the 1990s Central and Eastern Europe opened up, Interbrew took over breweries where product quality could be much improved at modest investment costs, leading to far higher profits. Roughly half of the takeovers in our sample are distributors, where the pooling of rolling stock reduces both unintended slack and the need for back-up material. Another way to improve margins is general cost cutting. A policy of continuously questioning the rationality of all expenses is what 3G Capital brought to Inbev in 2004. The Economist (2019a) sums up the new spirit as follows: assuming that, in mature and oligopolistic industries, “sales will remain steady, [3G] then loads firms with debt and cuts costs using zero-based budgeting.”
A last possible source of consolidation benefits is pure market power. In industrial economics, it is taken for granted that a higher industry concentration is associated with more pricing autonomy and rents.
The earlier discussion of takeover benefits is silent about the division of the gains among the interested parties. If entry into an industry is easy, profit margins may shrink, and the consumer would benefit. In the case of beers and ales, though, potential entrants into the bottom-fermentation business do face substantial upfront investments (unlike in the top-fermentation segment). When combined with uncertainty and the potential of predatory pricing by incumbents, this initial investment creates a strong barrier to entry. In addition, the experience in the craft segment tells us that even where entry costs are low, prices do not fall.
Most synergy gains, then, are likely to accrue to the producers, not the consumers. Management and labor may gain, but data are too aggregated and come twice a year only, so most of the studies focus on shareholders. In empirical studies, M&As are associated with increased shareholder wealth. The distribution of these gains between acquirer and acquiree shareholders is less clear-cut.
C. Bidder versus Target Returns
Empirical studies of takeover announcements, where both buyer and target are listed companies, can tell us how the benefits are split between the two parties. The acquiree's shareholders are known to benefit significantly. Eckbo (Reference Eckbo2008, Reference Eckbo2009, Reference Eckbo2014) reviews 15,000 takeovers, 1980–2012, and concludes that listed targets’ shareholders clearly win, with a run-up of about 10% in the two months before the announcement followed by a 20% gain in the days around the announcement. In the case of takeovers by private bidders, one typically sees smaller gains at the target side, with run-ups of about 5% and announcement gains of about 15%. The reasons why bidders typically offer a substantial premium over the market price include (1) discouraging other potential acquirers, white knights, and greenmailers, and (2) discouraging hold-out behavior among the target's shareholders by giving them at least part of the synergy gains.
Whether the high bid prices leave anything for the acquirer's shareholder are less clear. The bidder returns, in the same 2014 survey, are found to be statistically close to zero. Recent work is slightly more optimistic; Thorburn (Reference Thorburn2019), for instance, reports an average gain of about 1% for bidders. Still, the prima-facie imbalance in the returns to targets versus bidders remains huge. The interpretation is not easy. In a rational and value-oriented framework with negotiated mergers without competition, the gains should be shared; and even in competitive bidding contests, the gains should still be split because there is always an option to impose negotiation (Sercu and Van Hulle, Reference Sercu and Van Hulle1995).
One reason for the imbalance may be overpaying, leaving the bidder worse off despite the synergy gains. Any such overpaying could have various causes. Roll (Reference Roll1986)'s hubris hypothesis says that managers, after doing well by pure chance, ascribe their success to exceptional skills. As a result, they overestimate their capacity to generate profits. A second possible explanation is that anticipated synergy gains, even when estimated without bias, are probably noisy; in a contested takeover game, the winner's curse filter could still generate a sample dominated by unattractive deals. Less kind to managers, finally, is the Williamson (Reference Williamson1964) view that corporate officers care about their own power and income rather than shareholder wealth, and therefore tend to like the size for the sake of the perks it brings, even if the size is achieved at too high of a cost to their shareholders.
We discussed potential economic explanations for zero or negative returns to bidders. But there also is a statistical power issue: at the acquirer's side, any positive effects tend to be harder to detect. First, the lower returns to bidders may to a large extent reflect a basis issue: if a takeover worth 100 generates a gain of, say, 20 equally split between the two sides, the target's return on the pre-event value is (20/2)/(100–20) = 12.5%, but the bidder's return would be as low as 1.25% or 0.125% if their market value is larger by a factor of 10 or 100. Second, given that other news generates a standard deviation of returns amounting to 1.5 or 2% per day, a small-target return like 12.5% really stands out, but statistically detecting bidder effects of 1.25 or 0.125% is much harder. Third, it is easier to identify potential acquirers than potential acquirees, so that much of the bidder's gains may have been anticipated by the time of the announcement, being spread out over time long before an actual event, they again become quite hard to detect.
The generally unimpressive results for acquirer stocks come with much variability across subsets of events. Acquirer share prices experience an average rise of 2–3% when the target is private but react negatively in the case of public targets. In the Eckbo's 15,000-event sample, reactions to all-cash offers are more positive than those to all-stock deals, and large bidders (defined as top-quartile, by market value) show smaller returns than bottom-quartile bidders.
When reading the lists of IIAB-I- or Heineken-related events reported in Reuters since 1990, one notes that the vast majority of takeovers relate to privately-held targets, often distributors. In the literature, private targets tend to have a more positive effect on bidders’ values. One reason is that competition from rival buyers is less likely: the talks themselves can remain private until they come to an end. Also, most private deals are by nature “friendly,” negotiated between the two parties; and bargaining games tend to share the gains between the two parties, with perhaps more potential for benefits to the acquirer than in a public bid for a listed target. What this means for our sample is unclear: the chances of finding acquirer gains are helped by the predominance of private deals but hurt by the small size of those private deals.
There are some earlier studies of serial bidders. Malatesta and Thompson (Reference Malatesta and Thompson1985) conclude that for the 30 serial acquirers in their sample, the price reaction is positive. Aktas, de Bodt, and Roll (Reference Aktas, de Bodt and Roll2011, Reference Aktas, de Bodt and Roll2013) find that, among serial acquirers, a longer acquiree list comes with falling returns to the bidder. This, Aktas, de Bodt, and Roll (Reference Aktas, de Bodt and Roll2011) argue, could be explained either by hubris that is met with growing skepticism in the market or by rational learning on the managers’ side. Studying the times between bids, Aktas, de Bodt, and Roll (Reference Aktas, de Bodt and Roll2013) find more evidence of learning.
Most takeovers in this sample are international. Regarding the comparison of domestic versus cross-border takeovers, the literature has produced no consensus. Moeller and Schlingemann (Reference Moeller and Schlingemann2005) and Eckbo and Thorburn (Reference Eckbo and Thorburn2000) find that in cross-border acquisitions, the returns are lower, and Ahern, Daminelli, and Fracassi (Reference Ahern, Daminelli and Fracassi2015) similarly report lower returns when the partners are more culturally distant. Francis, Hasan, and Sun (Reference Francis, Hasan and Sun2008), in contrast, find cross-border deals to be more profitable.
III. Measuring Long-Run Average Abnormal Returns
To compute abnormal returns, one first needs to define a normal level of return. In financial economics, the normal return is typically taken to be, following the CAPM (see the appendix, if necessary), the entire stock market's return corrected for relative risk, with the latter being measured by the stock's market sensitivity or beta in the “market model” regression. Also, multifactor generalizations are quite popular, especially the Fama–French (FF) (Reference Fama and French1992, Reference Fama and French1993, Reference Fama and French2012) version where, for example, size- and “value”-related factors are added to the specification.
A. Data and Descriptives
Our data are monthly and weekly returns, including dividends. Daily returns are problematic because of non-synchronicity issues in trading times. One regressor we use is the return on the world-market index, and one of our regressees is the return on a global breweries index. Sydney trades eight to ten hours before Amsterdam/Brussels—Eikon works with close prices at the location of the primary listing, which for both IIAB-I and Heineken is Euronext—while the New York price information comes six hours later. This generates non-trivial measurement errors in daily world-market index returns and autocorrelation in the market model residuals. Non-synchronicity is much less of a problem in weekly returns and becomes a minor issue in monthly data. Second, while official announcements do have a clear date, press comments on the major takeovers often start by saying that rumors have been circulating for a few days already, so pinpointing an exact event day is an illusion. The third consideration against daily frequencies is that, in the event study, we need event windows of several weeks or months. We adopt monthly returns in the first-pass analysis and then turn to weekly data by way of robustness check.
Table 1 provides descriptive statistics for returns on the world market, the top two brewers, and Eikon's world brewing index. These four total-return series are neither statistically different from each other nor economically informative, so we turn to risk-adjusted returns.
Table 1 Summary Statistics for Weekly Returns in Percent

Notes: The table presents summary statistics for the returns (in percent per week) in 1990–2019 for the FF world market index, the Datastream world brewing index, IIAB-I, and Heineken. “t-stat” refers to a t-test on the average, $\bar{r} \sqrt N$ σ r; asterisks signal two-sided significance at 10 (|t| ≤ 1.645), 5 (1.960), or 1% (2.576). The last column provides the p-value, in percent, for the Barque-Jera normality test.
B. Total and Risk-Adjusted Average Returns
Risk correction typically consists of taking out that part of the return (or, actually, of the “excess return” above the risk-free rate) that reflects market-wide factors known to be “priced” in the sense that they provide a non-zero average excess return. We use the two most popular measures of risk-adjusted return, briefly reviewed in the Appendix. In Jensen's alpha, the general market factor is controlled for. For the three-factor FF alpha, one also removes the size and book-to-market factors. In a FF regression, specifically, there are three risk measures, the slope coefficients β, γ, and δ. They denote the stock's return sensitivities to the returns from, respectively, (1) the market portfolio, (2) a size portfolio (Small minus Big (SMB), with long positions in small stocks and short ones in big-cap firms), and (3) a “value” portfolio (High minus Low (HML), with long positions in high book-to-market-ratio stocks and short ones in low-ratio stocks):

The original CAPM model contains just the market as the priced factor, so the market-sensitivity (β) estimate is provided by a simple regression.

The significance of α b can be linked to the significance of the weight a mean-variance investor would assign to the brewery stock b in a portfolio that already contains, as initial assets, either the market index (Equation (2)) or the market, size and “value” factor portfolios (Equation (1)). That is, a positive alpha tells us that the stock is attractive over and above what is offered by a well-diversified portfolio with the same sensitivity to the general factor(s) as the stock. In the Arbitrage Pricing Theory, which is an alternative to the CAPM, alphas should be zero in equilibrium even outside the mean-variance paradigm, so positive alphas still represent abnormal mean returns.
Table 2 presents the risk exposures and the alphas for the brewing industry index and the two leading stocks. Consider the monthly data first. The industry as a whole has a market sensitivity (beta) that is quite average (1.05).Footnote 5 The two dominant players have much lower market sensitivities, about 0.5 or 0.6. Qualitatively, this is a common finding: a low beta is typically a large-firm phenomenon. Still, in the monthly-return data base, none of the three series has any clear exposure to either size or value as factors. Alpha, lastly, is statistically insignificant for all three series. That is, there seems to be no clear abnormal return for the leaders. Weekly data bring essentially the same message.
Table 2 Measures of Average Abnormal Returns (Percent) on Brewing Stocks, 2000–2019

Notes: We show results from two regressions. The regressees are excess returns from either the Eikon brewing index or IIAB-I or Heineken. The regressors are the FF world market return with slope β, augmented in the bottom half with the size-index (SMB) return, and the value’-index (HML) return whose slopes are γ and δ. The intercepts are expressed in percentage per week.
These alphas assess long-run average returns corrected for what is deemed to be a normal performance for similar stocks but do not tell us what the role of takeovers was in the total risk-adjusted performance. If takeovers were valuable indeed or at least regarded as such by the stock market, extra returns should be discernible around the time when acquisitions are announced. For that reason, we shift our focus from 18-year average returns towards 3–4-week performance around announcements of mergers or acquisitions.
IV. Event Study
A. Set-Up
In an event study, one looks at return patterns around the announcement time of a particular type of corporate event—an acquisition, in our case. In principle, one way is to run a system of CAPM or FF regressions, one per stock, adding on the right-hand side an indicator for the event and assigning to that regressor a common coefficient across stocks. This would allow us to detect the reaction to a typical announcement, averaged across firms and over time, a technology that is quite natural if the events one considers are rare within each time series. Since we have 51 events for Heineken and 62 for IIAB-I, we can actually run firm-by-firm regressions and extract bidder-specific reactions.
For these regressions, we define for every bidder b and month T, the indicator variable ${\bf 1}_T^b$ , set at unity if at time T bidder b issues the first statement about a new takeover, with b being either H(eineken) or I(IAB-I). This first announcement could be about an intention or the opening of talks; for small deals, it often already reports the completion of an agreement. We then run a time-series regression involving the indicators plus a benchmark-return variable, like the CAPM's market factor.

One can add SMB and HML as regressors. In the summations, A and B define the event window: it starts B periods before the event and ends B after the event. In the case of weekly data, for instance, we set B = 1 = A; so, we look at weeks –1, 0, and +1 relative to the event, corresponding to indicators of an event happening next period, or this one, or the preceding one. The coefficients $\varphi _{j\comma l}^{\rm b}$ estimate the average return on company j's stock in the l-th period relative to b's announcement. In addition, the literature often studies cumulative abnormal returns summed over the entire window, like [–1, 1] for the weekly-return tests. For firm j, for instance, the cumulative announcement effect of an IIAB-I statement across the three weeks in the events window is

In the first-pass monthly-return regressions, we set A = B = 0, that is, we just look at the event month. To better understand the results for IIAB-I, we then adopt a three-month window with B = 0, A = 2. For Heineken, a three-week window turns out to be useful (A = –1, B = 1).
B. Results from Monthly Data and a One-Month Event Window
We run the previous regressions with, as the regressee, the returns for each of the two firms and for the breweries index. On the right-hand side, we start with the market factor and just a single event-indicator regressor, the one for the company's own announcements. By way of robustness checks, we then add the size and value factors, and in a third round also the other firm's announcements. All these regressions are OLS with Newey–West t-tests. We omit alphas and exposures from the tables, since they are, essentially, unaffected by the addition of event regressors. In this subsection, we focus on the results for the monthly-return sample with a one-period window, summarized in the upper half of Table 3.
Table 3 Event Study of Takeover Announcements: Reactions, in Basis Points per Month

Notes: All returns are monthly. The regressee is the bidding company's excess return, and it is again regressed on the risk factors (market excess return in the CAPM, plus SMB and HML in the FF model). Additional regressors are dummies indicating that IIAB-I (superscript I) or Heineken (superscript H) made an announcement l (= 0, 1, 2) months ago. For the three average abnormal returns we also provide the cumulative abnormal return (CAR), the sum of the three effects. Asterisks signal two-sided significance at 10 (|t| ≤ 1.645), 5 (1.960), or 1% (2.576).
In terms of either stock's reaction to the company's announcements, the picture is not positive. Consider the results for monthly data. Every point estimate of average extra returns during event months is negative; and while for Heineken the outcomes are insignificant, for IIAB-I they are statistically clear: in the month of the announcement, prices drop by about 2%, on average, after taking out the general alpha and the market-wide events. Adding the second indicator, we note no significant cross-reactions. That is, there is no evidence that one company's external growth presages either more implicit collusion (via a clearer market-leadership), more intense competition, or a higher chance that the buyer could soon take over its rival any time soon. Nor does the brewing index react.
The poor results for IIAB-I can, to some extent, be traced back to very negative market reactions to, especially, the larger and earlier deals. The –5% return after Interbrew announced talks with Ambev, mentioned in the introduction, turns out to be no exception.Footnote 6 In Table 4 we list the six months with the largest acquisitions, and we add a simplified measure of abnormal return, the return on IIAB-I minus that of the market like the unit-β CAPM evaluated by Dybvig and Ross (Reference Dybvig and Ross1985). In the paragraph that follows, we refer to this return as the abnormal return.
Table 4 Returns for the Months Containing the Six Largest Takeovers
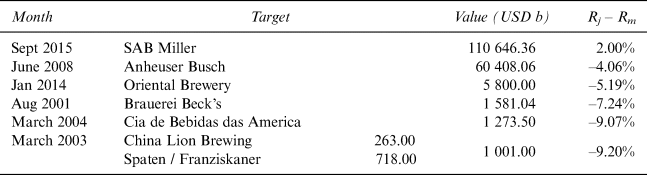
Notes: We list the six event months with the largest transactions and show the month's stock return in excess of the risk-free rate.
In Table 4, the SAB Miller event is associated with a positive abnormal return, but the next five are not: their abnormal returns range from –4.0 to –9.2%. This set strongly affects the all-deals average, even though that average is equally weighted. Graph A in Figure 4 shows, for all event months ranked by size of the takeover(s) from high to low, three numbers: (i) the abnormal return per event (the square dots), (ii) a moving average abnormal return of six takeovers that come next in terms of size (the dotted line), and (iii) an expanding average that starts with the six biggest and then each time adds the next takeover (the full line). The individual deals look quite scattered, apart from the five negative-return deals listed. The average abnormal return starts at –5.5% (the average excess return of the above six biggest deals), and after adding smaller and smaller deals ends up at –1.8% with a t-statistic for that mean of –2.25. (In fact, most t-tests for intermediate sample sizes are significant too.) The moving average of six abnormal returns has, of course, a less smooth path but shows that, even for smaller deals, most moving averages remain negative, with a few exceptions heavily affected by the one +14.4% outlier event in 2015.Footnote 7 To sum up, the event study's AARs in the zone [–1.3, –2.1] percent are robust and reflect especially the larger and older deals. If we had filtered out the smaller deals, the overall average would have been even more negative.

Figure 4 Market-Corrected Returns on IIAB-I in Event Months, Ranked by Size per Month (Panel A) or by Calendar Time (Panel B)
Tentatively, then, at this stage, the picture noted earlier is that Heineken's shareholders may neither have lost nor gained from its takeovers, while IIAB-I's may dislike the extra uncertainty or think the management overpaid on average and especially for the large deals. The next step is to find out which of these two explanations applies best.
If the market disagrees about future cash flow projections and is rational, the price change should be permanent in the sense that subsequent price changes are unrelated to the event reaction. Updating is likely, but upward revisions should cancel out, on average, against downward ones. If it is an uncertainty issue, conversely, sooner or later that uncertainty should be reduced or even resolved entirely. The implication would be that some or all of the price change is, on average, only transient—that is, there are price reversals. We first explore the permanent-change route and find the implied cumulative effect on value implausible. Direct evidence of reversals will then be the second step.
For the sake of argument, we first interpret the announcement effect as a “permanent” measure of takeover gains. If so, its overall impact would be economically non-trivial. Using the least unflattering estimate (–1.29% over the three-week interval, as in the FF model), the cumulative impact on value, after 62 takeovers, would amount to (1–0.0129)62 = 0.45 of the actual final stock price, meaning that the stock's final value, in the sample, is a mere 45% of its counterfactual value without acquisitions. The issues are whether these calculations are statistically convincing and, if so, economically credible.
Such calculations could be mostly due to estimation errors, but here this seems unlikely. If one is willing to assume log-normality for the event factor (unity plus the event effect as defined hitherto), confidence intervals for the cumulative compound impact are easily obtained. To produce a weekly mean event factor of 1–0.0129 with a standard error (SE) of 0.0076, the log event factor would need a mean μ of –0.01301 and a standard deviation σ of 0.007733.Footnote 8 The mean of the log of the product of 62 independent event factors would be 62μ with standard deviation $\sqrt {62}$ σ, giving us a plus/minus two-sigma confidence interval of [0.396, 0.505]. This is very far from the value unity; that is, it is implausible to regard the estimated cumulative loss of 0.55 as differing from zero just because of estimation noise. In fact, the t-test for the average event effect already told us that.
As a permanent effect, the estimate lacks economic plausibility. The average size of an individual loss, for instance, is large. For a company whose equity is worth, on average, 78 billion, even a 1.5% loss amounts to more than 1 billion, which is larger than the gross size of most transactions: there are only five deals exceeding 1b. It is even harder to accept that IIAB-I destroyed between half and three-quarters of its potential value and yet came out ahead of Heineken in terms of cumulative total return. We could also think counterfactually. Recall that, over 18.25 years, IIAB-I's stock rose from 100 to 500; if we take the –1.29 to –2.48% estimated reactions per event as irreversible, then without the acquisitions Interbrew's stock would have risen from index 100 to 500/0.55 ≈ 900 or even 500/0.31 ≈ 1600. This is not plausible: in a mature industry, there is only so much one can do by cutting costs in just one Belgian lager brewing firm that already starts off as the largest in the country. A cumulative total-return price index several times above the current 500 seems unthinkable if economies of scale and scope, including cross selling and cost cutting, had not been applied in more and more companies.
C. Direct Evidence of Reversals
The three-month cumulative abnormal return (CAR) and its components are shown in the lower part of Table 3. The month-zero loss is even more significant than before, both economically and statistically, but the IIAB-I 3-month CARs become insignificant. This is partly due to the denominator in the t-test: the standard error per event rises by about $\sqrt 3$ , and the number of observations drops to one-third. But also the numerator contributes: the one-quarter CARs, –0.68 to –1.45%, are much closer to zero than the first-month reactions (between –2.20 and –2.48%). Especially during the first month after the announcement, already more than half of the month-zero price drop is reversed, with average returns of +1.5% (CAPM) or +1.9% (FF), associated with p-values of 10 and 6%, respectively.
If a reversal is part of the answer, can it be explained by a revision of the market's initial views on synergy gains or by resolution of uncertainty? The resolution of uncertainty is a plausible scenario, especially for the larger deals. The main takeovers did add substantial uncertainty about the combined cash flows of the company as a whole, and there was abundant discussion and updating in the post-announcement weeks and months that could have resolved much of the uncertainty. Both the initial negative reaction and the subsequent revision for the larger acquisitions could also be magnified by the sharply increased leverage the acquisitions are associated with: investors may regard the company's peaking debt level as suboptimal, with the tax benefit more than offset by, for example, financial-distress issues (Graham and Harvey, Reference Graham and Harvey2001), and on top of this any increase/decrease in the perceived variance of the assets’ value would be magnified by the extra leverage. Empirically, the view that big acquisitions were associated with uncertainties also fits in with the fact that the larger deals triggered quite negative reactions (Panel A in Figure 4).
One could object that, if uncertainty matters and takes a while to disappear, also Heineken should be affected; yet, we saw no such effect in the monthly data. In weekly data, however, Heineken behaves similarly; its average uncertainty cycle is just shorter, perhaps because the transaction sizes tend to be smaller and the concomitant debt issues more modest. In weekly data with a [–1, +1] window (Table 5), we see that Heineken and IIAB-I behave similarly. All three estimates for IIAB-I in the event week are clearly negative, but so are two out of three for Heineken. The difference is that Heineken's price drops are essentially reversed just one week later, with quite significant t-tests, leading to an insignificant three-week CAR consistent with what we saw for the monthly returns. For IIAB-I, we do not see that effect in weekly data, and the CAR remains significantly negative; to see the beginning of reversals, we need to wait for the post-event month. In short, both companies seem to experience transient negative reactions, consistent with a temporary rise in uncertainty.
Table 5 Event Study of Takeover Announcements: Reactions, in Basis Points per Week

Notes: All returns are weekly. The regressee is the bidding company's excess return, and it is again regressed on the risk factors (market excess return in the CAPM, plus SMB and HML in the FF model). Additional regressors are dummies indicating announcements by IIAB-I (superscript I) or Heineken (superscript H). We also provide the cumulative abnormal return (CAR), the sum of the three effects. All effects are expressed as basis points per week. Asterisks signal two-sided significance at 10 (|t| ≤ 1.645), 5 (1.960) or 1% (2.576).
The fact that this effect is statistically clear may still be unexpected because for both companies most deals are small, are not followed by updates on Reuters’ news site, do not come with higher leverage, and are unlikely to have had any meaningful impact on the total company's overall risk in the first place. Also, in unreported regressions, we found no statistical evidence that the more negative reactions tend to be followed by larger reversals. For those reasons, it remains unclear whether or not the resolution of uncertainty explains most of the reversals; market inefficiency cannot be ruled out.
V. Conclusion
From its start as Leuven's Den Hoorn brewery, AB Inbev SA has ended up as the world's largest brewing group by far, but critics say the company overpaid for its acquisitions and overdid the leveraging and subsequent cost cutting, thus harming its shareholders. The 2000–2019 point estimates of cumulative realized returns on IIAB-I are better than those on Heineken stock, which is not what critics would expect, but average returns are not statistically distinguishable from each other or from zero, whether risk-adjusted or not. An event study shows that, unlike Heineken's, the market leader's takeover announcements were met by, on average, a minus 1.3 to 2.5% price reaction in the market. Does that mean overpaying, or do shareholders just need some time to evaluate the transaction and resolve the uncertainty?
We argued that the substantial price drop per transaction is not credible as a permanent assessment of the takeovers’ representative impact. This poor short-term performance is traceable to very negative initial reactions to a few large deals, all of them in 2001–2002 (i.e., before 3G's entry into the company), but even after 2004, the price adjustments remained downward. To reconcile this apparent value destruction with the adequate overall performance, the market's initial negative reactions must have been at least partially reversed in the long run. Especially for the larger deals, it is plausible that the initial reaction reflects a rise of uncertainty about the acquirer's prospects, magnified by a rise in leverage; and the intense discussion and updating in the media may have resolved that uncertainty rather quickly. We do find such reversals; for Heineken, it is a matter of two weeks, but for IIAB-I, it takes months. All this is consistent with the uncertainty interpretation. Most deals are small, though, and it is not obvious how these minor new uncertainties can have a non-trivial impact on a huge corporation.
Lastly, our article raises two issues, in general, of relevance to event studies. The first is the dilemma created by reversals when the market reactions are interpreted as the measure of economic value created by corporate decisions. The longer-run valuation, after the uncertainty has been resolved, does seem to be the most relevant one; but lengthening the event window would lower the regression's power substantially. Second, heterogeneity in the patterns across firms may raise an aggregation-bias problem. In the present article, we discovered the second-week reversal for Heineken and the second-month one for IIAB-I by running separate regressions per firm at both frequencies, but most event studies chose one frequency and computed one average pattern across all firms. To illustrate the danger, Table 6 shows results for panel estimates imposing a common pattern for the two firms. The event effect itself always remains significant, but the evidence for a reversal basically disappears. Mixing heterogeneous reaction patterns hurts one's chances of finding anything significant.
Table 6 Aggregation Issues When Heterogeneities Are Ignored

Notes: The two stocks’ returns are regressed on the market factors and on indicators that an event took place in the period itself or in the preceding one. Data are monthly or weekly. The regressions are a panel with firm-specific intercepts and exposures to risk factors but a common event effect. The reversals, which we know follow different patterns across firms, become insignificant when mixed together.
Appendix: Abnormal Return Models
We employ two measures of risk-adjusted abnormal return, both quite standard.
A. Abnormal Returns 1: Jensen's Alpha
In portfolio theory, the prior is to hold the market portfolio, possibly mixed with T-bills, to adjust risk and return up- or downward. In equilibrium, there should be no incentive to overweight any company, so in event-study tests, one assesses the incentive to overweight the companies under study.
Denote the degree of overweighting by $w_b^x$ (extra weight in breweries), and the weight for the entire market in the agent's portfolio by wm; the weight of the risk-free asset then is implied to be 1 – $w_b^x$
 – wm. Denote returns by R, with subscripts p(ortfolio), b(reweries), m(arket), and f (for riskfree). The return can then be written in an excess-return form, that is, returns over and above the risk-free rate: from Rp = $w_b^x$
 Rb + wm Rm + (1 – $w_b^x$
 – wm) Rf we obtain

A mean-variance optimizer with relative risk aversion η would solve

It turns out that the solution can be written as

where αb and var(eb) are the intercept and residual variance of the “market model” regression,

Since risk aversion η and conditional variance are non-controversially positive, the test for a positive extra weight simplifies to a test on a non-zero alpha. The alpha is usually called Jensen's Alpha, after Jensen (Reference Jensen1969).
B. Abnormal Returns 2: FF Alpha
If the optimal ex-ante $w_b^x$ (and therefore α) must be zero, the Capital Asset Pricing Model (CAPM) follows: E(Rb – Rf) = βb E(Rm – Rf). But this CAPM was soon shown to mis-price, among other things, small stocks and “value” stocks (i.e., with high book-value/market-value ratios). Following Fama and French (FF, Reference Fama and French1992, Reference Fama and French1993, Reference Fama and French2012), one might therefore expand the asset menu with positions in portfolios designed to pick up the anomaly: SMB (“Small minus Big,” i.e., a zero-investment portfolio long in small stocks and short big stocks) and HML (“high (book value) minus Low,” i.e., a zero-investment portfolio long in distressed stocks and short in safe stocks). Mean-variance optimizing a portfolio with these two extra ingredients provides a similar optimal-weight solution, except that alpha now comes from a multivariate regression,


