


I. Introduction
The famous 1976 wine tasting in France that thrust California wines onto the world stage served as the model for a tasting conducted June 8, 2012 in Princeton, New Jersey. Just as the 1976 tasting (“Judgment of Paris” (Taber, Reference Taber2006)) had compared wines from a nascent California industry with those of well-established French winemakers, the 2012 tasting (“Judgment of Princeton” (JOP)) compared wines from another young wine region, New Jersey, with respected wines from Bordeaux. To elucidate and clarify the results from the recent wine tasting we have undertaken an analysis of the tasting grades from the JOP with the objectives of testing for differences among the wines, estimating effects of sitting at the same table, and testing for differences between regions. The results indicate that the New Jersey and French wines do not, on average, differ in quality; and that the judges showed no signs of bias due to table seating.
The analysis published on the Liquid Asset website follows the procedure suggested by Quandt (Reference Quandt2006) and implemented in his WineTaster® software. The analysis presented also includes considerable examination of the judges for consistency and correlation. Our analysis in this paper focuses on the wines and handles judge effects as a nuisance variable. The testing procedure recommended by Quandt (Reference Quandt2006) for comparing the wines is essentially Friedman's test followed by pair-wise comparisons. In their nomenclature, the rank sums are called “points against” and the judges are the blocks. Ranking the scores by judge overcomes some of the problems caused by judges using the scales differently, but at the cost of much of the information in the scores. Ranking provides the order information but much of the information about distance between scores assigned is lost. To preserve this information we present and examine an analysis using a transformation based on standardized scores, as well as a heterogeneous variances model instead of the rank-based Friedman procedure.
Biases induced by the conduct of the tasting could enter into the scoring without the knowledge of the judges or organizers. Any discussion or facial cues from other tasters at the same table could bias a judge's score. The effect of the table at which the judges were seated could create a clustering of scores. Using the seating arrangement, we perform an ad hoc analysis to estimate the variance due to table.
It may be inferred that an underlying objective in conducting the JOP was to determine whether the collection of wines from New Jersey were of significantly lower or higher quality as scored by the expert judges. Comparing individual wines and ranking them does not answer this question directly, especially when the precision of a tasting is insufficient to separate all the wines. We have addressed this question within each flight with a single-degree-of-freedom contrast comparing the origins, which is, comparing the mean of all the New Jersey wines to the mean of all the Bordeaux wines.
II. Method
The data was retrieved from the Liquid Assets web page reporting the tasting (http://www.liquidasset.com/report161.html, last accessed 11 August 2012).Footnote 1 In our presentation the revealed judges' and wines' names are preserved (judges' initials are used in text) as they were presented on the Liquid Assets website. The judges’ scores on the 0–20 point scale were used as the raw data for all the analyses. The graphical analysis presented of the raw data, mean-centered data, ranked data (ranked within judge), and standardized data motivates the statistical analyses. A general linear model approach is taken starting from an assumed two-factor mixed model (with judge and wine as the factors), to two-factor mixed models on transformed data, and ending with a two-factor mixed model with heterogeneous variances for judges. Throughout judge is considered a random effect. The Mixed procedure (Littell et al., Reference Littell, Milliken, Stroup, Wolfinger and Schabenberger2006) of the SAS System was used for the calculations. The restricted maximum likelihood estimation performed by the Mixed procedure was used for all models and the type three tests of fixed effects (analogous to the partial sums of squares) were interpreted. Pair-wise comparisons of all wines within a flight were performed using the unprotected least significant difference (LSD) test. Friedman's test, as recommended by Quandt (Reference Quandt2006), was also performed (also with uncorrected pair-wise comparisons) to permit comparison of the other methods with a rank randomization alternative.
Separate exploratory statistical analyses were performed to: 1) estimate variance components including the effect of table (table at which the judge was seated); 2) compare the mean of New Jersey wines to the mean for the Bordeaux wines. Variance components were estimated using restricted maximum likelihood estimation with all factors considered nested random effects (wine within judge and judge within tables) for the white and red flights separately. The intraclass correlation coefficients were then calculated as the ratio of individual variance components to the sum of all the variances. A comparison of the means of all the wines from each origin was conducted for each flight separately using a single-degree-of-freedom contrast within the context of the different linear models used for comparing individual wines. Confidence intervals on the differences calculated by these contrasts are presented. Because the models have different power, the confidence intervals provide a means of evaluating the ability of the model to detect meaningful differences in the scores.
III. Results and Discussion
To appreciate the variability among judges in both how high they scored the wines and the way in which they used the 20-point scale we inspect Figure 1 for the white wines and Figure 2 for the red wines. From these Figures, it is apparent that some judges scored the wines much higher overall than other judges did. Judges that use different regions of the 20-point scale can have more impact on overall means for each wine, giving them unequal influence on the results. Mean-centering (subtracting the judge's mean score from all their scores) transformation of the scores neatly corrects for this inequality (Figure 3 and Figure 4). After mean centering, the variation in the judges' scores can be readily assessed visually. A two-factor linear model including judge as an effect would essentially be partitioning the variability displayed in these figures into wine effect and residual. A simple two-factor model though would assume homogeneity of variances among judges. Differences in variances of judges’ scores appear to invalidate models assuming equal variances.

Figure 1 Tasting Scores of the 10 White Wines in the Judgment of Princeton Wine Tasting by Wine and Judge

Figure 2 Tasting Scores of the 10 Red Wines by Wine and Judge

Figure 3 Mean-Centered Tasting Scores of the 10 White Wines by Wine and Judge

Figure 4 Mean-Centered Tasting Scores of the 10 Red Wines by Wine and Judge
Rank transformation, or similarly Friedman's test, corrects the inequality in mean scores neatly, but at the same time it discards the information about variability in judges’ scores (Figure 5 and Figure 6). The rank transformation also stabilizes the variance within judges, but fine distinctions in the tasters scoring are lost. For example, F.S. scores the two Cabernet Franc varietal wines substantially lower than most of the other wines (Figure 2). This distinction is lost after ranking (Figure 6).

Figure 5 Ranked Scores of the 10 White Wines by Wine and Judge

Figure 6 Ranked Scores of the 10 Red Wines by Wine and Judge
Also important is that the range of scores is quite different for the different judges. For example, judge J.F. scores all the white wines between 14.5 and 17.5, whereas J.C. scored them from 8 to 15, a greater than two-fold difference in range. Whether the difference in range is due to differences in discriminatory ability, differences in how the judges use the 20-point scale, or differences in taste preferences of the judges is beyond our knowledge, but the fact that some judges separate the wines more is important to our goal. Standardization by dividing each score by the standard deviation of all the scores from the same judge was conducted in an attempt to ensure that each judge contributed equally to the overall score while preserving more of the information in their scores than ranking would. After standardization, the scores have much more uniformity in variances across judges while retaining more than just order information (Figure 7 and Figure 8).

Figure 7 Standardized Scores of the 10 White Wines by Wine and Judge

Figure 8 Standardized Scores of the 10 Red Wines by Wine and Judge
The effect of which table the judge was seated was explored with an ad hoc analysis to allay any fears of bias from this effect. For each flight of wines (whites and reds), variance components were estimated assuming that all effects were random effects and mutually uncorrelated and that judges were nested within tables. The variance component model used was:
 $${\rm score}_{{\rm ijr}} = {\mu} + {\alpha} _{\rm i} + {\beta} _{{\rm ij}} + {\varepsilon} _{{\rm ijr}} $$
where:
μ is the overall mean of the population,
α i is the random effect of table,
β ij is the random effect of judge within a level of table,
ε ijr is the random effect of wine within a level of judge, within a level of table.
The variance components for the white and red wines suggest that little of the variation in scores is explained by the table-to-table variation (Table 1). For the white wines judge-to-judge variation accounted for 37% of the total variance, while for red wines judge-to-judge variation only accounted for 12% of the total. For both reds and whites, wine-to-wine variation explained the majority of the total variation. Being seated at the same table had no appreciable effect on scoring.
Table 1 Variance Components for Wine Tasting Scores of White and Red Wines
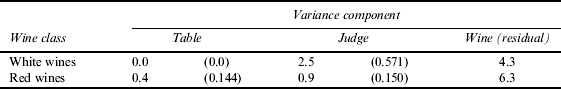
Table, Judge and Wine (residual) were all considered random effects for this nested random effects model. The intraclass correlation coefficients are in parentheses.
For the white wines the omnibus test of equality of means indicates that there was no significant effect of wine regardless of the transformation or statistical model used (Table 2). The unadjusted comparisons are overly liberal at detecting differences in a tasting of this size. The pair-wise comparisons are unadjusted for multiplicity so making 45 comparisons at α = 0.05 we would expect to find two differences significant due to chance alone. None of the linear models detected more than two significant pair-wise differences, which is consistent with the omnibus test indication of no significant effect of wine. An overall conclusion emerges from the results of all the data transformation and modeling techniques: that the average scores for the white wines are not different.
Table 2 Summary of Scores Assigned to the 10 White Wines by Wine and Transformation or Statistical Method

The transformations are; Raw = raw data, Ranked = data ranked within judges, Centered = mean of judge's scores subtracted from each score, and Standardized = scores divided by standard deviation of all scores from that judge. Heterogeneous denotes that a two factor mixed effects model with separate intercepts and variances for each judge was used, while the column denoted Friedman's indicates that Friedman's test was used. Estimates with no letters in common are significantly different at α = 0.05 according to multiple comparisons of all pair-wise differences conducted using the Least Significant Difference test (LSD, without experiment-wise error protection). The omnibus null hypothesis is that the mean scores (or for Friedman's the rank sums) for all wines are equal.
Analysis of the raw or centered scores for the red wines indicated that there were significant differences (Table 3, omnibus test). From this, the unwary analyst could be induced to interpret the pair-wise comparisons such that the top rated wine was significantly better than the bottom three wines, the wine rated second was better than the bottom two wines and the top seven wines were all better than the wine rated lowest. However, the assumptions of these tests are severely violated by the data rendering these results invalid. Given the large number of pair-wise comparisons in this tasting, without correcting for multiplicity the analyses using the rank transformed data, heterogeneous variances model, or Friedman's test would all drastically inflate the type I error in interpreting the pair-wise comparisons. The omnibus test on the ranked data, standardized data, heterogeneous variances model, and Friedman's procedure all indicate that there were no significant differences among the wines. An overall conclusion again emerges from the results of the ranked data transformation, heterogeneous variances model and Friedman's test: the average scores for the red wines are not different.
Table 3 Summary of Scores Assigned to the 10 Red Wines by Wine and Transformation or Statistical Method

The transformations are; Raw = raw data, Ranked = data ranked within judges, Centered = mean of judge's scores subtracted from each score, and Standardized = scores divided by standard deviation of all scores from that judge. Heterogeneous denotes that a two factor mixed effects model with separate intercepts and variances for each judge was used, while the column denoted Friedman's indicates that Friedman's test was used. Estimates with no letters in common are significantly different at α = 0.05 according to multiple comparisons of all pair-wise differences conducted using the Least Significant Difference test (LSD, without experiment-wise error protection). The omnibus null hypothesis is that the mean scores (or for Friedman's the rank sums) for all wines are equal.
We have also reduced the JOP to just two questions: 1) Is the quality of the white wines from New Jersey significantly different from that of the wines from Bordeaux; and 2) The same question for the red wines. A single-degree-of-freedom contrast was used to address these questions and was non-significant (α = 0.05) for both red and white wines. The confidence intervals on the difference between the mean scores for the New Jersey and Bordeaux wines provide a measure of how large the difference would have needed to be in order to be significant based on this tasting (Figure 9 and Figure 10). A difference in the means of the raw scores larger than 1.5 would have been declared significantly different for either white or red wines. It seems unlikely that such a small difference could be considered meaningful and suggests that the tasting was powerful enough that any meaningful differences between the wines from the two origins would have been detected.

Figure 9 Confidence Intervals on the Mean Difference of Wine Tasting Scores of White Wines from Bordeaux or New Jersey95% Confidence Intervals on Effect of Origin of White Wines

Figure 10 Confidence Intervals on the Mean Difference of Wine Tasting Scores of Red Wines from Bordeaux or New Jersey 95% Confidence Intervals on Effect of Origin of Red Wines
The JOP provided a venue for comparing a selected sample of wines from an established wine region known for its excellent quality with wines from a developing wine region aspiring to excellence in wine quality. The tasting revealed that, after accounting for differences among judges, the differences between the wines or the wine regions were too small to detect. These select New Jersey wines were found to be not dissimilar in quality from the excellent Bordeaux wines as ranked at this tasting.


