


I. Introduction
Alcohol and its consumption have a long-lived special position in the market. Therefore, research on the behavior of alcohol consumers and optimal taxation is huge. The majority of this research divides alcohol into three broad groups: beer, wine, and spirits. Literature provides a wide range of demand elasticity estimates. Although the estimates vary according to time and estimation method, or even by price segment, wine variety or color (Cuellar and Huffman, Reference Cuellar and Huffman2008), the own-price elasticities of alcoholic beverages are usually negative (Cook and Moore, Reference Cook, Moore, Culyer and Newhouse2000). Many authors have also recognized beer as the most inelastic among all types of alcohol, whereas wine and spirits are considered more similar (Gallet, Reference Gallet2007). Nevertheless, consumption trends are changing, drinking preferences are not stable over time, and the own-price elasticity of beer is increasing (Boško, Reference Boško2020). The elasticity of income was found to be higher in the case of wine and spirits, with beer being the most income inelastic beverage (Gallet, Reference Gallet2007).
However, alcoholic beverages can be further divided into off-trade (alcohol consumed at home) and on-trade (alcohol consumed away from home). Consumption at home might be sometimes associated with alcoholism, whereas consumption away from home is often linked to recreation and specific events (Vinopal, Reference Vinopal2008). At restaurants, pubs, and bars, the consumer usually pays not only for the beverage itself but also for the experience.
For this reason, reactions to price changes at these two markets might be different, and prices at one market might affect consumption at the other (Collis, Grayson, and Johal, Reference Collis, Grayson and Johal2010; Grosová et al., Reference Grosová, Masár, Kutnohorská and Kubeš2017). Even though the knowledge in this field is constantly evolving, most of the prior research considered alcoholic beverages consumed at on-trade and off-trade as one good or investigated off-trade alcohol in isolation, without allowing for the possibility of substituting for alcohol consumed away from home. Some studies considering only off-trade beverages found income elasticities to be negative, implying that with an increase in income, consumers might likely switch from off-trade to on-trade consumption (Heien and Pompelli, Reference Heien and Pompelli1989).
In this study, we investigate whether these two markets are different in the way in which consumers react to changes in income and price, considering both their own prices and the prices of other alcoholic beverages. Furthermore, we examine the relationship between alcoholic beverages consumed at these two markets; that is, whether consumers are more likely to switch between different beverages but continue to consume them either at home or away from home, or whether instead of changing to consumption of another type of beverage, they shift their consumption between on-trade and off-trade. We analyze the alcohol consumption patterns of the two very different markets. In the case of the Czech Republic, which is typically a beer-drinking country, wine expenditure shares are increasing mainly at the expense of alcoholic spirits (Mitchell, Reference Mitchell2016).
II. Methods and data
Data used for this study came from the Czech Household Budget Survey (HBS), which is regularly conducted by the Czech Statistical Office. Within this survey, a household records detailed information about its expenditures and, for some consumption categories, also quantities consumed throughout the whole year. For the purpose of our analysis, we used household-level data for the period 2011–2016, with 15,878 observations.Footnote 1 All variables expressed in Czech crowns are recalculated at the 2016 price level using CPI. What allows us to analyze on-trade and off-trade substitution is the segmentation of alcoholic beverages among those consumed at home and those consumed at restaurants, bars, or similar places. On-trade and off-trade expenditures are further divided into beer, wine, and spirits.
On average, in the period between 2011 and 2016, Czech households spent 6,153 CZK per year on alcoholic beverages, with 3,300 CZK, 1,730 CZK, and 1,123 CZK on beer, wine, and spirits, respectively (see Table 1). With an average annual household income of 344,000 CZK, expenditures on alcohol represented on average 2.05% of total household expenditures, with 0.54% away from home and 1.51% at home. Still, there was a significant number of households that did not consume alcohol at all. Considering all alcoholic beverages, there were about 3% of such households.Footnote 2
Table 1. Descriptive statistics

Notes: The number of observations is 15,878. Expenditures and prices are adjusted for the 2016 price level (with 24.43 CZK per US$); unit prices and the budget shares are reported for alcohol drinking households, the rest is for all households.
Apart from expenditures, Czech HBS also holds information on the quantity consumed (for the three alcohol groups, in liters). Information on expenditures and quantities allows us to calculate household-specific unit prices, which are calculated as a ratio of expenditures and quantities consumed.Footnote 3 However, these unit prices hold information not only about spatial and time-specific variations but also about households’ quality preferences (Cox and Wohlgenant, Reference Cox and Wohlgenant1986). For this reason, we first adjust unit prices for quality, following a method used by Gao, Wailes, and Cramer (Reference Gao Gao, Wailes and Cramer1995) and by Angulo, Gil, and Gracia (Reference Angulo, Gil and Gracia2001) for alcohol prices in Spain.
The hedonic price function used for estimating the quality effects is defined as

where UP i is the per liter unit price, α i is the intercept, vector X i represents household characteristics that reflect the household's quality preferences, and the last (stochastic) term e i is residual. Quality-adjusted price of ith good for each household is then defined as

Another issue that arises in the analysis is the absence of unit price data for the households that did not consume a commodity in the given period.Footnote 4 For this reason, we first run a regression of unit prices on regional, time, and socio-demographic variables, and any available information on unit prices of other alcoholic beverages consumed by a given household (Heien and Pompelli, Reference Heien and Pompelli1989; Cox and Wohlgenant, Reference Cox and Wohlgenant1986). These regressions are then used to predict missing prices for the non-consuming households.
Apart from missing price information, the non-consuming households cause a selectivity problem, which might cause final elasticities to be biased (Tobin, Reference Tobin1958). Following a censoring treatment method proposed by Heien and Wessells (Reference Heien and Wessells1990), we deal with the issue by including the Inverse Mills Ratio in the final demand system as an instrumental variable.
In the last step of our analysis, we estimate the Quadratic Almost Ideal Demand System (QUAIDS). The quadratic specification was chosen based on the recommendation by Banks, Blundell, and Lewbel (Reference Banks, Blundell and Lewbel1997), suggesting that the Engel curves of alcohol follow a quadratic rather than a linear shape. This is also supported by a Wald test, which rejects the Engel curves for alcohol as linear, indicating their quadratic form for our data.
QUAIDS demand functions in budget share form are specified as

where


in which w i is the budget share of the ith commodity, p j is the price of the jth commodity, and m is the total expenditure on the commodities in the system. In our model specification, p j is the quality-adjusted price of the jth alcohol product, as in Equation (2).
To satisfy additivity, homogeneity, and symmetry conditions, QUAIDS demand functions in budget share require the following restrictions.


Several authors suggest that elasticities differ across different socio-demographic groups (Gallet, Reference Gallet2007). For this reason, we also incorporate socio-demographic characteristics into the final model, following the modification of intercept in the linear function of socio-demographic variables as proposed by Heien and Pompelli (Reference Heien and Pompelli1989).
The system of equations was estimated by MLE in STATA. Final elasticities are estimated using the delta-method, at sample means, following the identities specified in the original paper by Banks, Blundell, and Lewbel (Reference Banks, Blundell and Lewbel1997). Both compensated (Hicksian) as well as uncompensated (Marshallian) price elasticities are computed. However, due to space, we report only uncompensated elasticities.
III. Results
Estimated income elasticities were found to be positive for all three beverages, implying that alcohol is a normal good. At the off-trade, beer was found to be almost unit elastic, with an income elasticity of 0.97, followed by wine and spirits, with income elasticities of 0.85 and 0.70, respectively. See Table 2.
Table 2. Price (uncompensated) and income elasticities
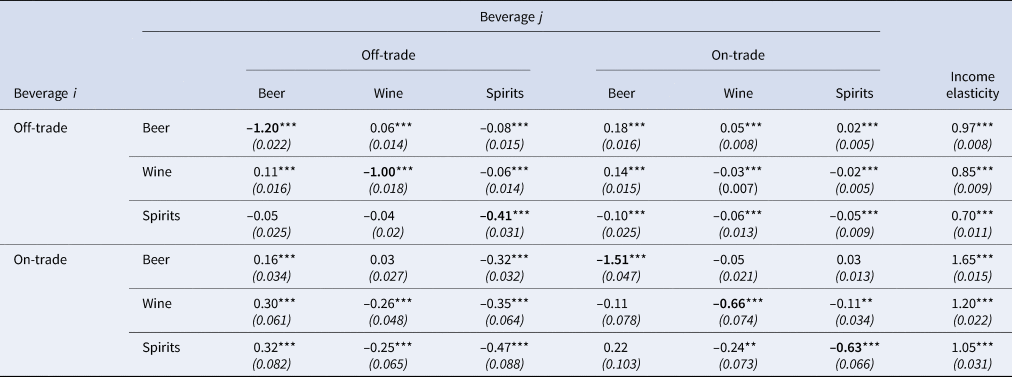
Notes: Standard errors in parentheses, * p < 0.05, ** p < 0.01, *** p < 0.001. Cross-price elasticities of beverage i wrt price of beverage j. Own-prices elasticities are bolded. On-trade beer is the redundant equation in QUAIDS.
Income elasticities of alcoholic beverages consumed away from home were found to be higher than in the case of alcohol consumed at home. Income elasticity is the highest for beer (1.65), followed by wine (1.20) and spirits (1.05). These numbers indicate that when it comes to the consumption of alcohol in restaurants, bars, and other similar places, Czech consumers are highly responsive to income changes. The result that on-trade alcohol is a luxury is not surprising since the consumer pays not only for the alcohol itself but also for the experience, atmosphere, and employees responsible for the guests’ well-being.
As shown in Table 2, at the off-trade, own-price elasticity was found to be the lowest for beer (–1.20), followed by wine (–1.00) and spirits (–0.41). For alcohol consumed in restaurants, pubs, and bars, beer seems to be the most own-price elastic (–1.51). However, the own-price elasticities of wine (–0.66) and spirits (–0.63) are more similar. These estimates suggest that beer and spirits are more own-price elastic in the on-trade market than in the off-trade market, whereas the opposite seems to be valid for wine.
Looking at the cross-price elasticities of beverages consumed at home, wine seems to be a substitute for beer and vice versa. On the other hand, off-trade beer and wine were found to be complementary to off-trade spirits. Interestingly, wine and spirits consumed away from home were found to be weak complements. Therefore, an increase in the price of on-trade wine results in a decrease in its own consumption as well as a slight decrease in the consumption of on-trade spirits, and an increase in the price of on-trade spirits results in a decrease in the consumption of wine consumed away from home.
Our system allows us to examine the cross-price elasticities of the same alcoholic beverages consumed in different environments—that is, at home and away from home—the on-trade beverage always seems to complement its off-trade equivalent and vice versa. This elasticity for wine consumed away from home with respect to the price of wine consumed at home is –0.26, and this response is even stronger for spirits consumed at the on-trade, with the “cross-price” elasticity at –0.47. Although the only beverage that does not appear to follow this pattern is beer, where on-trade and off-trade beer are substitutes with cross-price elasticities of +0.16 and +0.18. These results are in line with previous findings (Collis, Grayson, and Johal, Reference Collis, Grayson and Johal2010; Grosová et al., Reference Grosová, Masár, Kutnohorská and Kubeš2017).
Regarding the remaining cross-price elasticities—between on-trade and off-trade—off-trade beer seems to be a substitute for all on-trade beverages and vice versa. Both wine and spirits consumed away from home were found to be complements to off-trade wine and spirits, and off-trade wine and spirits appear to be complements to wine and spirits consumed away from home. Moreover, results suggest that with an increase in the price of on-trade beer, apart from switching to off-trade beer, consumers also slightly switch to at-home consumption of wine. Lastly, beer consumed away from home and off-trade spirits were found to be complementary.
IV. Conclusion
Despite a huge empirical literature on alcohol demand, the literature aimed at the behavior of alcohol consumers at both off-trade and on-trade markets is scarce, with few estimates of cross-price between-market elasticities. Our study is contributing to this stream of literature by analyzing the demand of Czech consumers for three broad categories of alcohol at both markets. Although the Czech market is relatively small in absolute terms, the Czech Republic ranks among the countries with the highest alcohol consumption per capita in the world (World Health Organization, 2018).
We estimated a coherent demand system, QUAIDS, treating the selectivity due to the high censoring that is particularly important for wine and spirits consumed away from home, paying special attention to the quality-adjusted unit price of alcohol. We find income elasticities range between 0.70 and 0.97 for off-trade alcohol and between 1.05 and 1.65 for the on-trade market, with beer being the most income elastic, followed by wine and spirits, respectively. These results imply that alcohol consumed at home is a necessity, whereas consumption of alcoholic beverages in restaurants, pubs, or bars is categorized as a luxury good. These estimates are generally in line with other studies, as reviewed, for instance, by Nelson (Reference Nelson2013). However, we are less optimistic about concluding that alcohol consumption patterns might be (globally) converging (Holmes and Anderson, Reference Holmes and Anderson2017) since the behavior of alcohol drinkers in the two different markets is quite different.
Own price elasticities of demand reveal that the Czech consumer is the most responsive to changes in the price of beer and least sensitive to changes in the price of spirits; however, at the on-trade, wine and spirits appear to be more similar. Whereas the own-price elasticity of beer and spirits is higher for the on-trade market, the opposite holds for wine, where households were found to be less responsive to changes in the price of wine consumed at restaurants, bars, and pubs.
Regarding the cross-price elasticities of demand, off-trade beer was found to be a substitute for all beverages consumed at home or away from home, and vice versa, except off-trade spirits. Wine and spirits consumed either at home or away from home were found to be mutual complements. Mitchell (Reference Mitchell2016) found that wine might be a more suitable substitute for beer in Eastern European countries, including the Czech Republic, whereas the reverse might be true for spirits—a relationship we can also confirm by our estimates. Although we do support Mitchell's conclusion about wine-beer substitutability as well, this holds only for the consumption at the off-trade (with respect to price changes at both markets), whereas the opposite is true for the consumption at the on-trade market.
Not surprisingly, the most significant relationship was found between on-trade and off-trade beer. This result might be specific to the Czech Republic since beer consumption has its own unique tradition.
Acknowledgments
We are very grateful to Karl Storchmann (the editor), and the anonymous referees, for insightful and helpful comments that have considerably improved this paper. We also wish to thank participants of the 14th Annual Conference of the American Association of Wine Economists held in Tbilisi, Georgia, on August 24–28, 2022 and The Beeronomics 2022 Dublin Conference held in Dublin on June 20–23, 2022 for their helpful comments. This research has been supported by the Czech Science Foundation within the EXPRO Program “Frontiers in Energy Efficiency Economics and Modelling - FE3M” (Grant Number 19-26812X). Secondment was supported by the European Union's Horizon 2020 Research and Innovation Staff Exchange program under the Marie Sklodowska-Curie grant agreement No. 870245 (GEOCEP). Responsibility for any errors remains with the authors.


