


I. Introduction
Virtually all countries tax the domestic consumption of some, if not all, alcoholic beverages (in addition to regulating their consumption using numerous non-price mechanisms, see Meloni et al., Reference Meloni, Anderson, Deconinck and Swinnen2019). However, the rates of taxation, and the types of tax instruments used, vary enormously between countries. Within each country, they also vary between beverages, and often between qualities and styles of each beverage. For a comprehensive view of rates of taxation, one needs to compare across countries not just for each product on its own but also relative to those for other alcohol beverages.
In times past these taxes were an important source of government revenue, but in today's more advanced economies the main justification offered for such taxes is to offset negative externalities that alcoholic drinking imposes on society (Sassi, Reference Sassi2015; Griswold et al., Reference Griswold, Fullman, Hawley and Arian2018). Such externalities vary not only across countries but also across beverage types and across drinking/eating patterns (Baxter, Reference Baxter2019). This ensures the impact of alcohol taxes on different types of households are very uneven, given differences in consumer preferences, which evidently vary greatly both between and within countries (Holmes and Anderson, Reference Holmes and Anderson2017; Anderson, Meloni, and Swinnen, Reference Anderson, Meloni and Swinnen2018; Hart and Alston, Reference Hart and Alston2019, Reference Hart and Alston2020).
The purpose of this article is to provide a comparable set of estimates over time of pertinent tax rates to inform debate about their appropriate sizes and choice of instrument in each nation's policy setting. The findings also will assist modelers of alcohol markets and policies, by providing comparable measures of those tax rates for many countries.
The article begins with an outline of the basic economics of alcohol taxation. It then explains various methodological issues involved in comparing tax rates across countries, beverage types, and tax instruments. Several ways of presenting the rates are outlined before turning to the data themselves. Estimates of those various rates in 2008 and 2018 are presented for a wide range of high- and middle-income countries. These are reported as ad valorem consumer tax equivalents (CTEs) for wine, beer, and spirits, and changes over the past two decades. They encompass not only wholesale sales taxes/excise taxes but also the consumer price effects of tariffs on imports. Value-added or goods-and-services tax (VAT/GST) rates also are reported as a further contribution to beverage retail price differences across countries. The article concludes by drawing implications of the findings for future rates of taxation of alcohol consumption as economies grow richer and develop a wider range of revenue-raising options.
II. The Economics of Taxing Alcohol: The Example of WineFootnote 1
The simplest way of modeling the effects of consumer taxation of wine (or beer, spirits, or any other tradable product) in a small open national economy is to use a partial equilibrium diagram, assume the country is a price-taking exporter, and examine the effects on such things as domestic prices, quantities consumed domestically and exported or imported, and national economic welfare. In Figure 1(a), it is assumed further that there are no externalities associated with producing, consuming, or trading wine, so the marginal private and social benefits (MSBf and MPBf) coincide as do the marginal and social costs of domestic production (MSCf and MPCf). If Pf is the free-trade price, then, in the absence of government intervention, OfQf units are produced, OfCf units are consumed domestically, and CfQf is exported. An ad valorem tax on domestic consumers of 100t percent (or an equivalent volumetric tax) would lower domestic consumption (and raise exports) by Cf’Cf units, raise government revenue by area acmn, but reduce consumer welfare by area admn. Hence there would be a net reduction in national economic welfare of area acd.
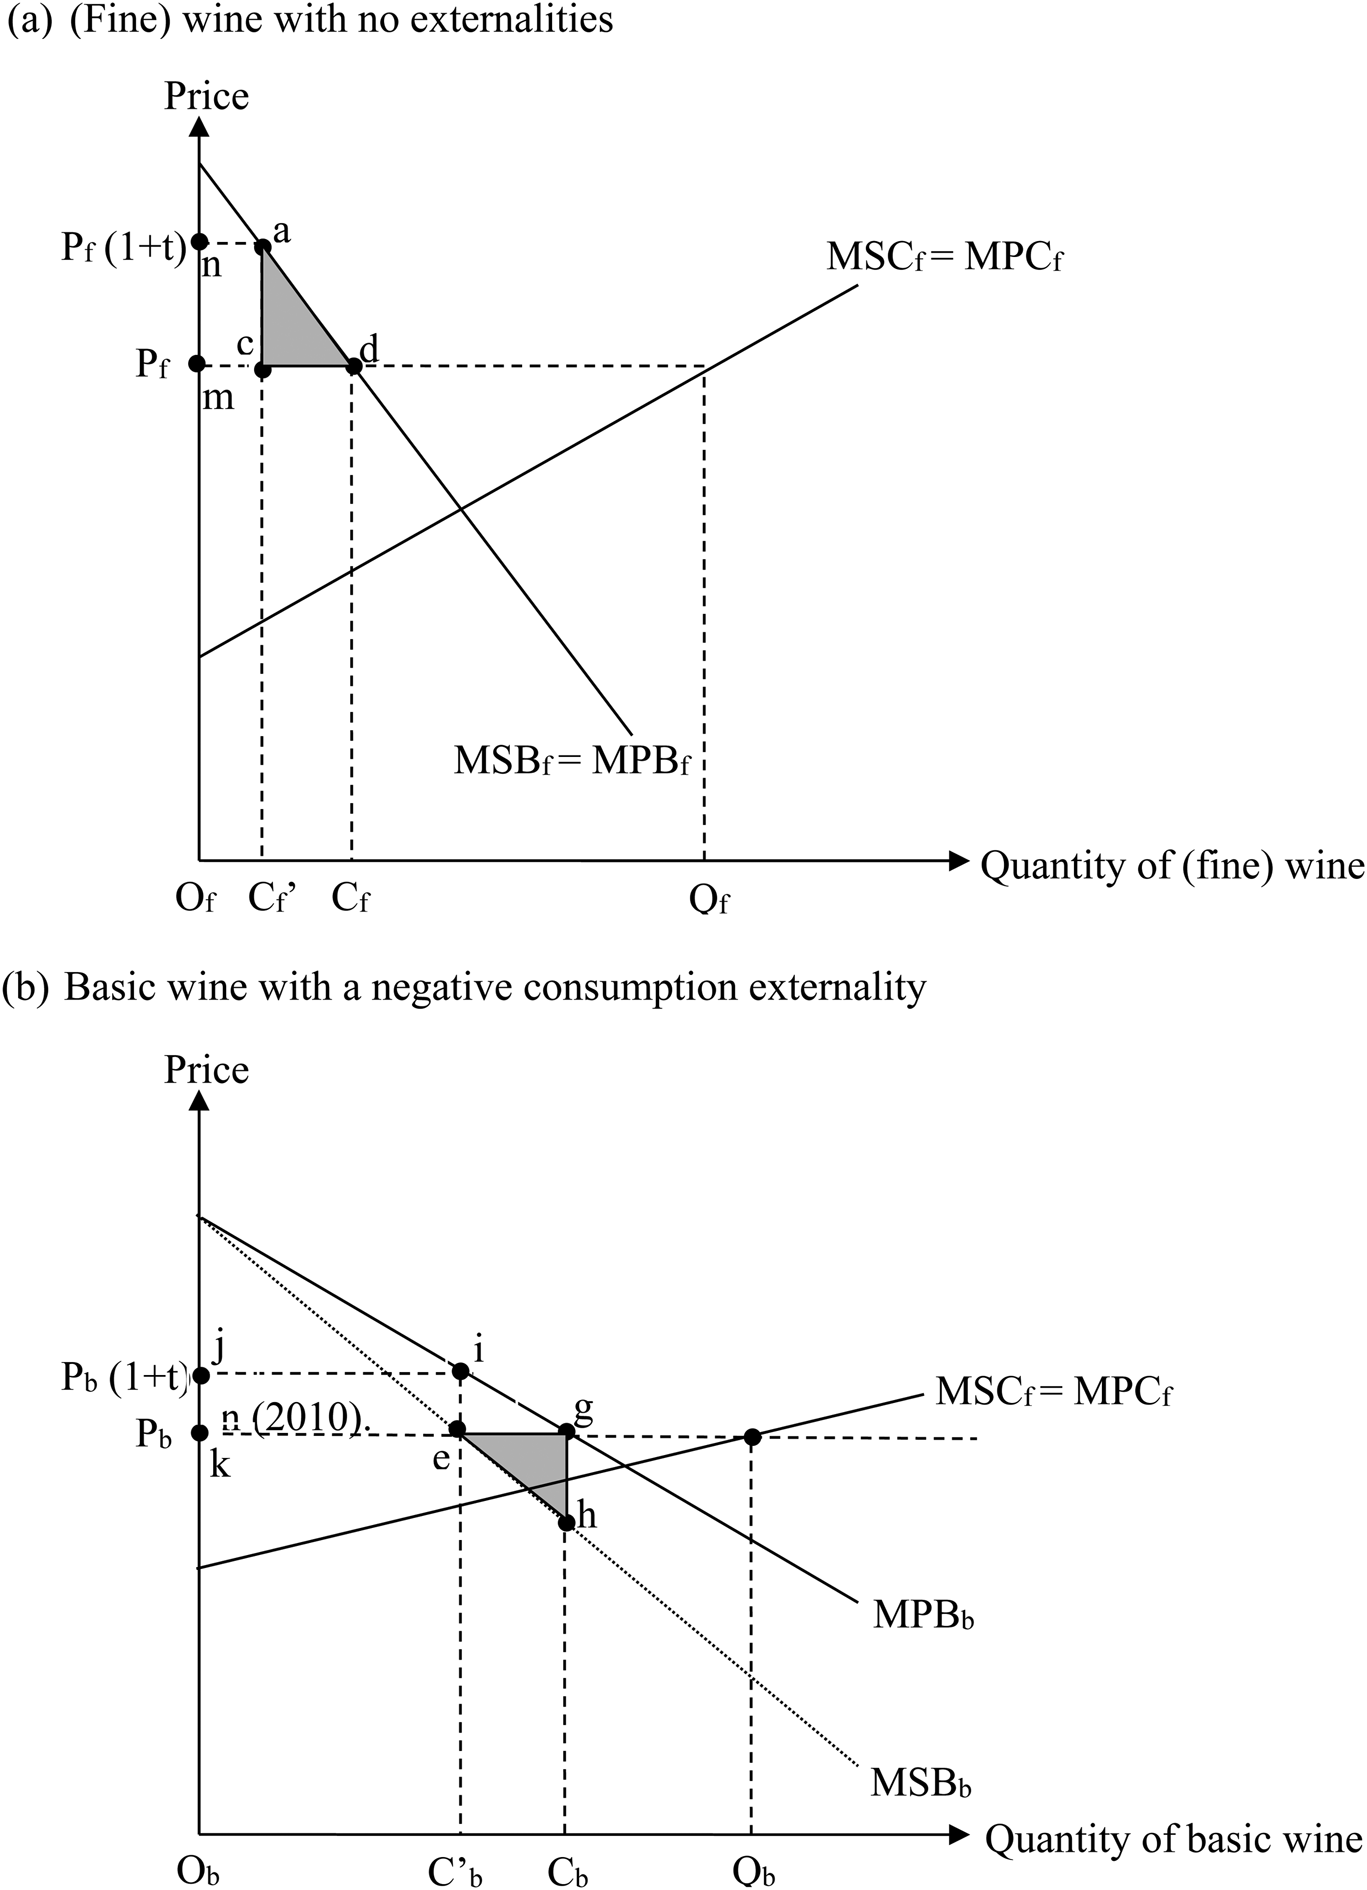
Figure 1 The Market for Wine in a Small, Open, Wine-Exporting Economy
Figure 1(a) may well apply to the fine wine market. Indeed, it may understate the national welfare cost of such taxation if, as suggested by extensive reviews of the health science literature, moderate wine consumption can have net positive health externalities depending on the social setting. That possibility is ignored in Figure 1(a), where the demand curve is assumed to be unaffected by the consumer price of basic wine (zero elasticity of substitution between fine and basic wine).
The market for basic wine, by contrast, is illustrated in Figure 1(b), in which (i) the domestic demand curve (MPBb) is more elastic than in Figure 1(a) because non-premium beer and spirits are assumed to be substitutes for basic wine, especially for binge drinkers simply wanting alcohol (see, e.g., Gallet, Reference Gallet2007; Srivastava and Zhao, Reference Srivastava and Zhao2010; Srivastava et al., Reference Srivastava, McLaren, Wohlgenant and Zhao2014; Yang, Zhao, and Srivastava, Reference Yang, Zhao and Srivastava2016), and (ii) the marginal social benefit curve (MSBb) is increasingly below MPBb because of the negative externalities on society associated with excessive alcohol consumption.Footnote 2 If Pb is the free-trade price for basic wine, then with no government intervention, ObQb units are produced, ObCb units are consumed domestically, and CbQb units are exported in this example. An ad valorem tax on domestic consumers of 100t percent would lower domestic consumption (and raise exports) of basic wine by Cb’Cb units, raise government revenue by area eijk, and reduce consumer welfare by area gijk, but it would reduce the externality on the rest of the society by area ighe. Hence there would be a net improvement in national economic welfare in area ghe from this tax on basic wine.
If the tax on consumption of basic wine also applied to fine wine, the national welfare gain from the taxing of basic wine would be reduced by the welfare loss in the fine wine market, namely area acd in Figure 1(a). If both types of wine were taxed at the same ad valorem rate t (as in several countries, see below), the dollar tax per litre of wine or alcohol would be higher on the higher-priced fine wine and so increase the probability of a net loss from such a wine tax. The likelihood of an overall loss to society is higher the bigger are the ratios of Pf to Pb and Cf to Cb. One way to reduce that loss prospect is to have a lower ad valorem rate for fine wine but, if that is too politically difficult to introduce (e.g., because only richer people drink fine wine—see Srivastava and Zhao, Reference Srivastava and Zhao2010), then a change from a common ad valorem tax to a common volumetric tax would be a more covert way of achieving a similar outcome.Footnote 3
The numerous factors affecting the supply and demand curves, especially the rates of tax on non-wine beverage consumption, vary across countries and over time. There is thus no reason in principle to expect the optimal wine tax rates to be the same across countries, or to change in the same way as national income growth, urbanization, and other structural changes occur at different rates.
Also, the CTE in ad valorem (percentage) terms vary with the price of wine in those many countries with specific (volumetric) tax rates in place. If the specific tax is in local currency units per litre of beverage, the CTE per litre of alcohol also varies with changes in average alcohol content—which has been rising per litre of wine in recent years (Alston et al., Reference Alston, Fuller, Lapsley, Soleas and Tumber2015)—and with changes in exchange rates per U.S. dollar.
Countries also differ in the extent to which they are “small” in the sense of being price takers in the international market for wine or other beverages. Fine wines especially, tend to be differentiated products, so a country's export demand curve for them would be somewhat downward sloping, rather than horizontal at Pf as in Figure 1(a). Altering that assumption would not affect the above qualitative conclusions regarding the optimal consumer tax, but it would affect the outcome quantitatively for producers because the tax would shift more sales to the export market and thereby depress the price received for them. That means a tax reform that replaced a uniform ad valorem tax on all domestic wine consumption with a uniform volumetric tax (whose ad valorem equivalent was, therefore, higher than t for basic wine but lower than t for fine wine in Figure 1) would raise relative returns to producers of fine wine and hence encourage grape growers and winemakers to upgrade the quality of their products.
Consumer prices also could be raised by subsidizing wine exports, which is the equivalent of a consumption tax and a domestic production subsidy at the same rate. In the absence of any positive production externalities, excessive production would be encouraged, adding to the welfare cost of government intervention in this market.
More commonly, countries that are net importers of wine (not shown in Figure 1) can and often do tax their consumers of alcohol with a tariff or non-tariff barrier to beverage imports. Like an export subsidy, an import tariff is the equivalent of a consumption tax and a domestic production subsidy. It is applied before any excise tax is imposed on those imports. Where a nation's climate rules out any likelihood of stimulating domestic wine production, the tariff could serve as an exact substitute for a wine excise or sales tax.
The earlier analysis applies equally to beer and spirits, using Figure 1(a) for craft products and Figure 1(b) for standard products. Since the production of both beer and spirits is not climate-dependent, the use of trade instruments such as an import tariff is likely to encourage excessive production in addition to curtailing domestic consumption.
Most countries also now have a VAT or GST system. That instrument is unlikely to discourage excessive alcohol consumption if the same rate applies to all consumer products, but it is a further contribution to differences across countries in beverage retail price.
III. Empirical Methodology
There are various ways to report consumer taxes on wine and other beverages. Since measures include ad valorem taxes as well as specific taxes (either of the beverage or of alcohol per litre), and since prices to which they apply and the alcohol content per litre of beverage vary between beverage types, it is helpful for comparing across countries and over time to present the wine CTEs in two formats: U.S. dollars per unit of alcohol (to which changes in foreign exchange rates also have an influence), and as a percentage of the wholesale pre-tax price at representative price points and alcohol percentages. It is also helpful to express the taxes in relative terms, so we show as well the ratios of the tax on wine to the tax on beer and on spirits.
Specifically, we express the CTE at the following average wholesale pre-tax prices for still wines: non-premium ($2.50 per litre), mid-range commercial premium ($7.50 per litre), and super-premium ($20 per litre). Taxes are often different for sparkling wine, so their CTE is expressed separately, at $20 per litre. The alcohol content of wine in volume terms is assumed to average 12% in 2008 and 12.5% in 2018. Throughout, wine refers just to grape wine. Since rice wine has a higher alcohol content than grape wine (or beer), it is considered as part of spirits.
The beer and spirits industries are now following the wine industry in offering premium products at much higher prices than for standard products, and the production of craft beer and craft spirits is booming in many countries, albeit from very low bases (Garavaglia and Swinnen, Reference Garavaglia and Swinnen2017; Swinnen and Briski, Reference Swinnen and Briski2017; Cockx, Meloni, and Swinnen, Reference Cockx, Meloni and Swinnen2019, Reference Cockx, Meloni and Swinnen2020). The premium portion of those industries is thus still relatively small in terms of volume of sales, so it is not considered separately in what follows. Rather, the focus is on just standard-quality beer and spirits, at representative wholesale pre-tax prices of $2 and $15 per litre of beverage, respectively. Their alcohol contents in volume terms are assumed to average 40% for spirits and 4% for beer in 2008 and 4.5% in 2018.
When the CTE is defined as the percentage by which the pre-tax wholesale price has been raised by beverage taxes, that ad valorem CTE would be the same at the retail level if the wholesale-to-retail margin (like the VAT/GST) was ad valorem. If, in fact, the ad valorem equivalent of those margins is inversely related to the product price, however, then our wholesale-level ad valorem CTE will be an overestimate of the impact on consumers at the retail level. Similarly, the tax per litre of alcohol is an underestimate of the specific tax at the retail level to the extent that the wholesale-to-retail margin is positively related to the product's price and more so the higher the ad valorem VAT/GST rate.
An ad valorem estimate of the combined set of taxes paid by the retail consumer can be found as follows, assuming the domestic product is a close substitute for the imported product and the wholesale-to-retail margin is ad valorem:

where m is the import tariff, t is the excise tax, and v is the value-added tax. This is the method used to generate Table 3.
IV. Data Sources
The primary sources for excise tax data are the European Commission (2008, 2018) and the OECD (2008, 2018), plus national government websites. Here the focus is on the latest data (2018) and on rates a decade earlier. Data on import tariffs are from the WTO (2019) for 2018 and from the World Bank (2019a) for earlier years. Unfortunately, we do not have access to the tariff equivalent of non-tariff import restrictive measures on these beverages. Export subsidies have been used in the recent past by the European Union (EU)—and in Australia in the inter-war period, see Anderson (Reference Anderson and Aryal2015, Table 20)—but they have been only a minor source of market intervention in the EU and so are ignored here.Footnote 4 Some countries impose ad valorem import tariffs on beverages, while others impose specific taxes per litre of product or per litre of alcohol in the product. The specific rates are converted to ad valorem rates at specified prices and alcohol contents.
Excise taxes are shown in Appendix Tables A1 to A4. Import tariffs are in Appendix Table A5. Shares of each of four wine types in the volume of wine consumed in each country are shown in Appendix Table A6. Those shares are used to calculate the national weighted average tax on overall wine consumption. Shares of wine, beer, and spirits in the total volume of alcohol consumption are provided in Appendix Table A7: they are used to calculate weighted averages of taxes on all alcohol. The VAT/GST and nominal exchange rates are in Appendix Tables A8 and A9, respectively.
V. Results
The full set of CTE estimates for the various beverages in 2008 and 2018, expressed both in dollars and in percentages, are shown in Appendix Tables A1 to A4 for a large sample of 42 high- and middle-income countries. The following points can be drawn from them.
First, wine is taxed slightly less than beer and much less than spirits in this sample of countries. The unweighted average CTE across the 42 countries and over the two years 2008 and 2018 was US$11.40 per litre of alcohol for wine compared with almost $14 for beer and $25 for spirits. As a percentage of the pre-tax wholesale price, wine's CTE averaged 22% behind beer at 29% and spirits at 75% (Table 1).
Table 1 Average Excise Taxes on Wine, Beer, and Spirits, US$ per Litre of Alcohol and Ad Valorem (Percent) Equivalent, 2008 and 2018
(Unweighted Average over 42 Countries and Then the Two Years)

a Weighted average over the four wine types, using as weights the 2009 shares in volume of total wine consumption, from Appendix Table A6.
Sources: Appendix Tables A1–A4.
Table 1 also reveals that taxes on all three beverages have risen over the decade to 2018. The volumetric averages rose by one-ninth in the case of beer and by a little over one-quarter for both spirits and wine. In ad valorem terms, the average taxes on both wine and beer rose by more than one-third.
When the excise taxes are added to import taxes (whose averages changed little between 2008 and 2018), and the value-added tax (which rose slightly over that decade) is then also imposed, the combined taxes averaged around 50% for wine and beer in 2008 and 60% in 2018, and around twice that for spirits. The weighted average across alcohol types of those combined taxes have risen by one-ninth on average over the decade to 2018 (Table 2).
Table 2 Ad Valorem CTE of Excise, Import, and Value-Added Taxesa on the Retail Price of Wine, Beer, Spirits, and All Alcohol, 2008 and 2018
(Unweighted Average over 42 Countries and Then the Two Years)

a The unweighted average of the VAT was 16.7% in 2008 and 18.0% in 2018. See Appendix Table A8.
b Weighted average over the four wine types, using as weights the 2009 shares in volume of total wine consumption, from Appendix Table A6.
c Weighted average over the three alcohol types, using as weights the 2014 shares in volume of total alcohol consumption, from Appendix Table A7.
Sources: Appendix Tables A1–A8.
Averages, though, hide a great deal of diversity in tax rates across and within countries. Northwest European countries have the highest overall rates of taxation of alcohol consumption, while the United States, Germany, Italy, and Japan have among the lowest taxes. The CTE range is from less than 20% to more than 120% (Figure 2). The changes in the past decade also range widely, from small declines in a handful of countries to major increases in Nordic countries (Figure 3).
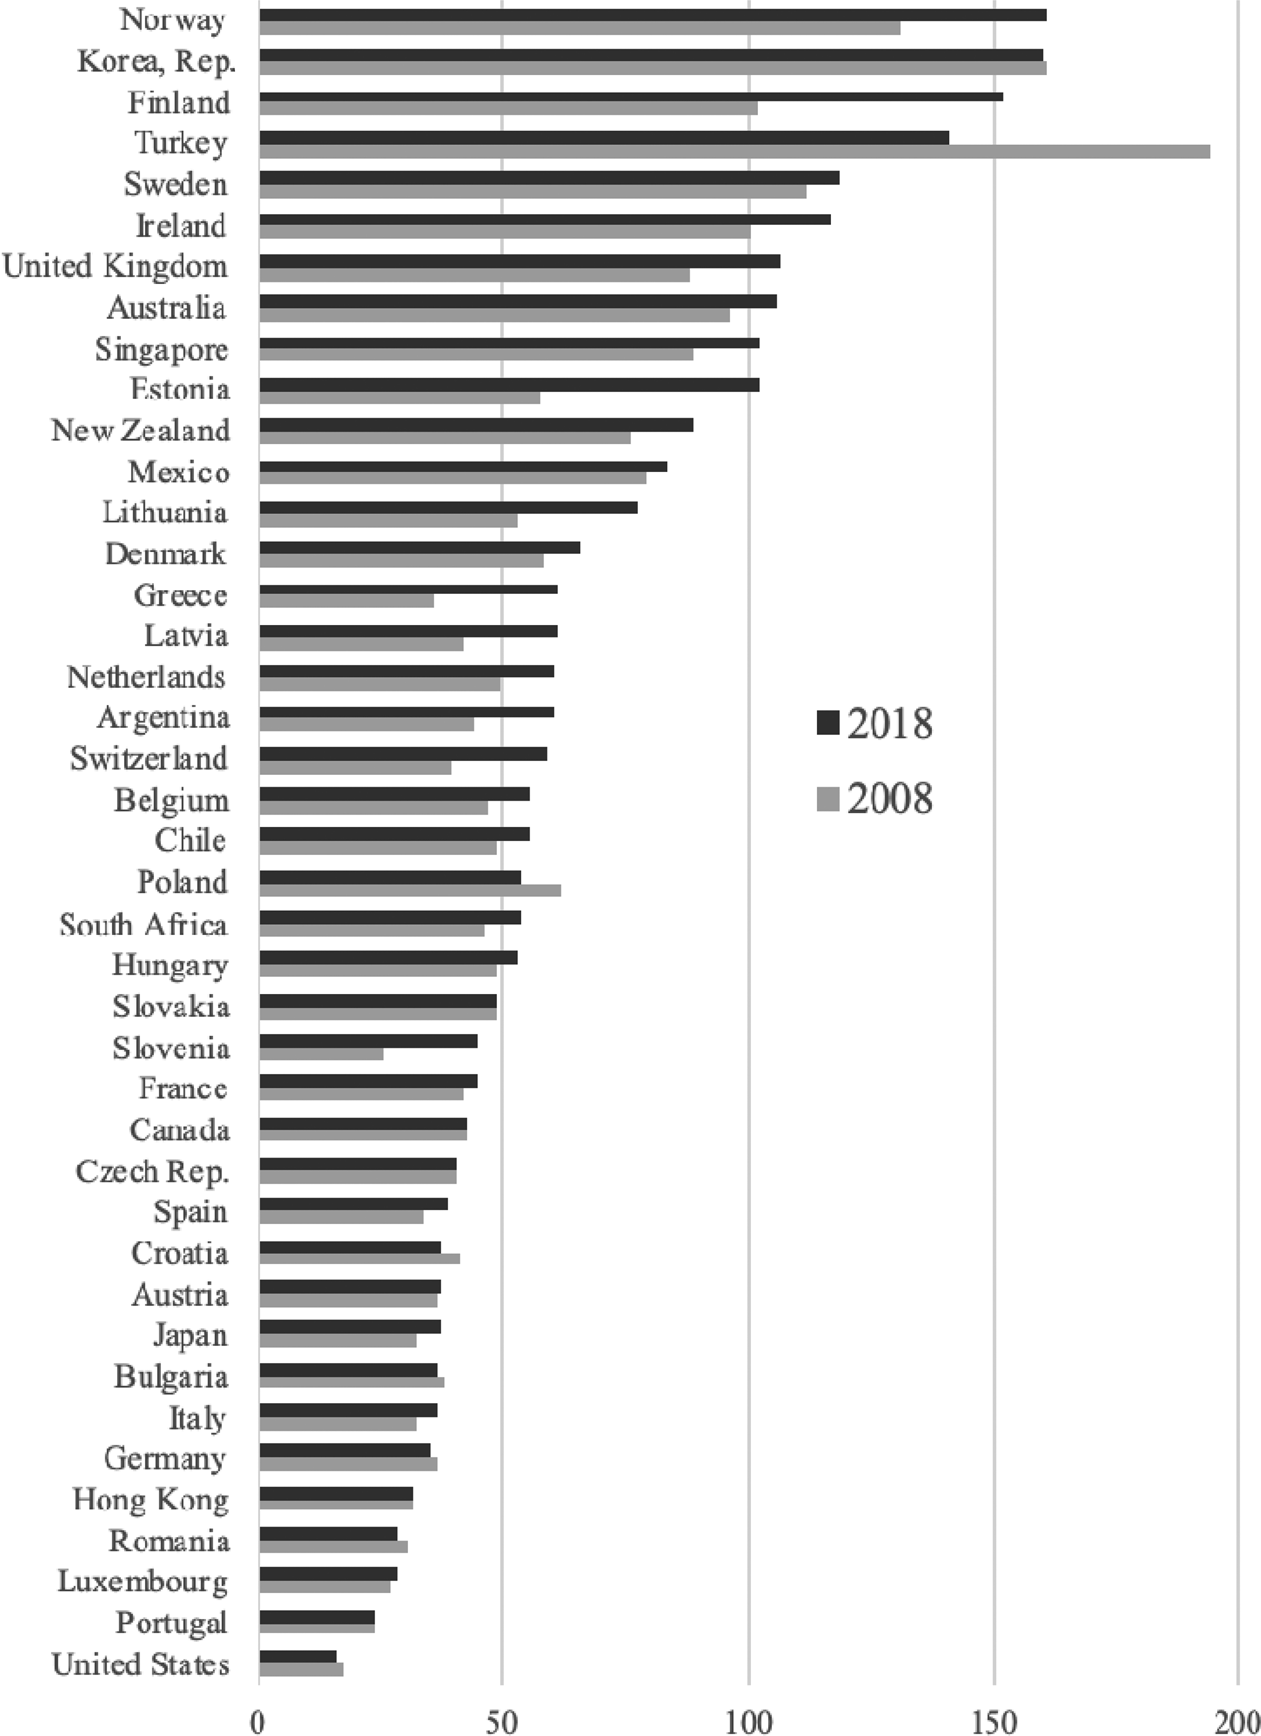
Figure 2 Weighted Average of Combined Ad Valorem CTEa of Excise, Import, and Value-Added Taxes on the Retail Price of All Alcohol (Wine, Beer, and Spirits), 2008 and 2018 (% of Wholesale Pre-Tax Price, Using 2014 Volumes of Alc. Consumption as Weights)
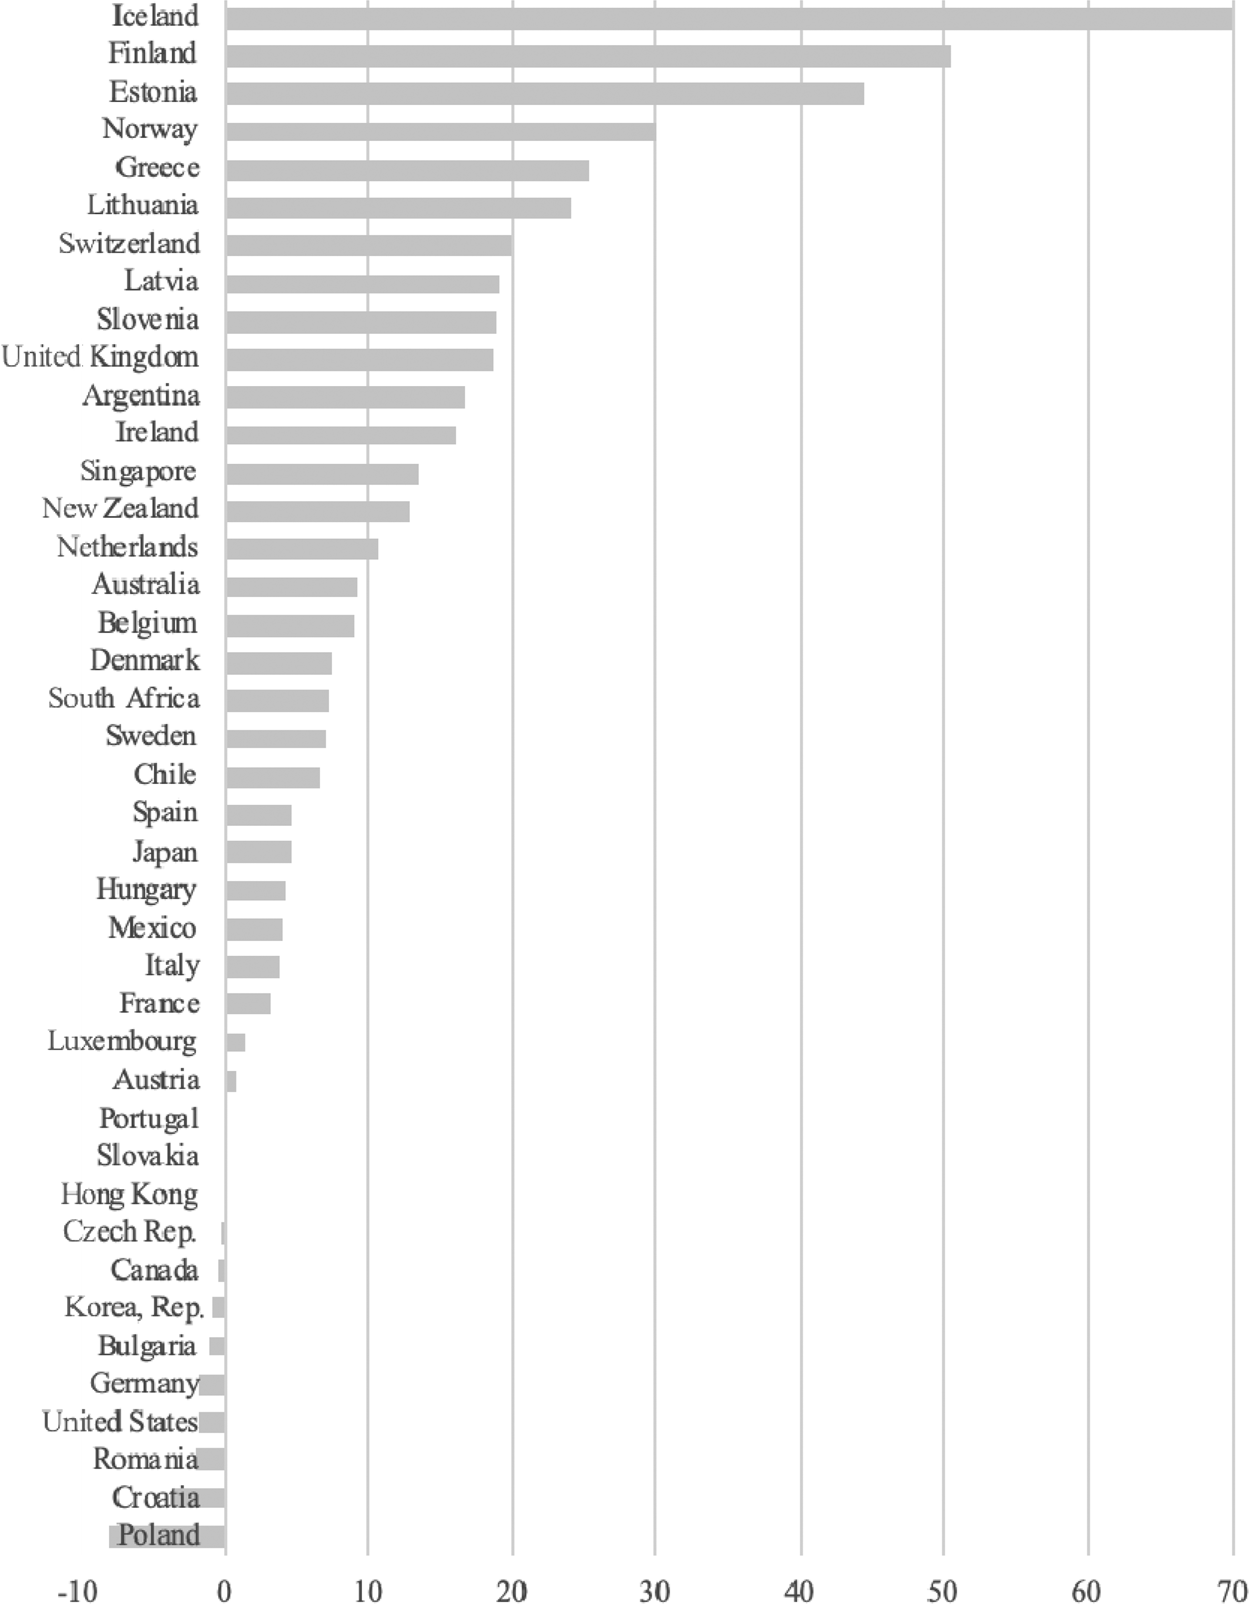
Figure 3 Change in Combined Ad Valorem CTEa of Excise, Import, and Value-Added Taxes on the Retail Price of All Alcohol, 2008 to 2018 (Percentage Points)b
The extent of overall taxation of the three main types of alcoholic beverages is shown for each country and both years in Table 3. Generally, wine is taxed least (at almost zero in Europe's wine-producing countries and not at all in Argentina) and spirits most. The extent of those differences can be seen by the ratios of those taxes, shown in Figures 4 and 5, using the tax on commercial premium wine as an indicator. The wine/beer tax ratio is less than 0.5 for two-thirds of the 42 countries, and the wine/spirits tax ratio is less than 0.5 for the majority of the countries too.

Figure 4 Ratio of Wine/Spirits and Wine/Beer Excise Taxes in US$ per Litre of Alcohol, 2008 and 2018 (at US$ per Litre Product Prices of $7.50 for Wine, $2 for Beer, and $15 for Spirits)

Figure 5 Ratio of Wine/Spirits and Wine/Beer Percentage Ad Valorem Excise Taxes, 2008 and 2018 (at US$ per Litre Wholesale Prices of Average-Priced Wine and $2/Litre Beer)
Table 3 Combined Ad Valorem CTE of Excise, Import, and Value-Added Taxes on the Retail Price of Wine, Beer, and Spirits, 2008 and 2018
(% of Wholesale Pre-Tax Price)

Sources: Appendix Tables A3, A4, A5, and A8.
All the traditional wine-focused countries are in the bottom half of those charts, and mostly it is non-wine-producing countries near the top of those charts (although so is Chile). Since national per capita wine production and consumption volumes are highly correlated, that suggests there is a negative relationship between wine taxes and the share of wine in alcohol consumption. Figure 6 shows that this is indeed the case, even though the extent of correlation is not high.

Figure 6 Correlation Between Wine's Share of Alcohol Consumption Volume and the Average Tax on Wine in US$ per Litre of Alcohol, 2008 and 2018
Finally, there are differences in the rates of tax on sparkling versus still wines, and according to the type of tax. Specifically, four countries taxed their wine consumers with an ad valorem tax in 2018: Chile (20.5%), Mexico (26.5%), Australia (29%), and Korea (33%). As can be seen from Appendix Tables A1 and A2, that means their CET in terms of dollars per litre of alcohol, and hence per bottle, is very high for super-premium still and sparkling wines (nearly three times the 42-country average) and very low for non-premium wines (less than one-half of the 42-country average).
VI. Discussion
The rise in alcohol taxes since 2008 is, in part, due to an alliance of government and temperance interests. Having largely won the anti-tobacco war in many countries, health lobbyists have turned their attention to alcohol. They argue that the negative effects of alcoholic drinking on individual consumers’ health and their social behavior, and the externalities that can impose on their household and on society more generally, require high taxes on alcohol consumption in addition to other regulations.
Governments, meanwhile, are always on the lookout for extra tax revenue. Evidently, industry counter-lobbying has been uneven and/or has been successful in making the case that wine consumption is generally less harmful than other alcohol consumption, as taxes are generally lower on wine than on beer and even more so on spirits and, where the wine rates have risen since 2008, it is mainly in non-wine-producing countries.
Assuming richer people tend to consume premium relative to non-premium wines, ad valorem taxation could be seen as an income redistributive measure. Yet governments have far more efficient tax instruments available for redistributing income. More importantly, by encouraging quantity rather than quality consumption, it is the opposite of what an optimal wine tax structure should be to reduce the negative consumption externalities referred to earlier in the context of Figure 1(b). Ad valorem taxation, as distinct from the specific taxes on the volume of alcohol in a bottle or can, also does not discourage producers from raising the level of alcohol in wine (Alston et al., Reference Alston, Fuller, Lapsley, Soleas and Tumber2015).
As well, ad valorem taxation has obvious implications for producers of lower- versus higher-priced wines. It also encourages (discourages) exports of premium (non-premium) wines from such countries and has the opposite impacts on wine imports.
Designing optimal policies to curb the worst adverse impacts of alcohol consumption clearly is far from straightforward (Pogue and Sgontz, Reference Pogue and Sgontz1989; Kenkel, Reference Kenkel1996). But it is equally clear that ad valorem taxation is not likely to be the first-best tax instrument. It will be interesting to see when and where increased health lobbying is able to bring about a change from ad valorem to specific taxation of alcohol consumption.
Appendix Table A1 Excise Taxes on Alcoholic Beverages per Litre of Alcohol for Wine, Beer, and Spirits, 2008
US$ at the Wholesale Pre-Tax Prices Shown in Column Heads

Appendix Table A2 Excise Taxes on Alcoholic Beverages per Litre of Alcohol for Wine, Beer, and Spirits, 2018
US$ at the Wholesale Pre-Tax Prices in Column Heads

Appendix Table A3 Ad Valorem CTE of Excise Taxes on Wine, Beer, and Spirits, 2008
% of the Wholesale Pre-Tax Prices in Column Heads

Appendix Table A4 Ad Valorem CTE of Excise Taxes on Wine, Beer, and Spirits, 2018
% of the Wholesale Pre-Tax Prices in Column Heads

Appendix Table A5 Ad Valorem CTE of Import Tariffs on Wine, Beer, and Spirits, 2008 and 2018
(% of the Wholesale Pre-Tax Price)

Appendix Table A6 Shares of Wine Types in Total Volume of Wine Consumption, 2009 (%)

Appendix Table A7 Shares of Wine, Beer, and Spirits in Total Volume of Alcohol Consumption, 2014 (%)

Appendix Table A8 VAT/GST Rates, 2008 and 2018 (%)

Appendix Table A9 Nominal Exchange Rates, 2008 and 2018
(LCU per US$)


