


Wine tastings inevitably involve some form of grading or ranking the wines, since the objective of tastings is to determine which wine is best, second best, etc., at least among the tasters on that particular occasion. Much has been written about the care that has to be taken that judges are not influenced by extraneous and irrelevant factors and that they do not influence one another. Ultimately, of course, the views of the judges need to be congealed in a single ranking that expresses the “social preference” among the wines. And therein lies the rub: how to aggregate individual preferences into a social ranking.
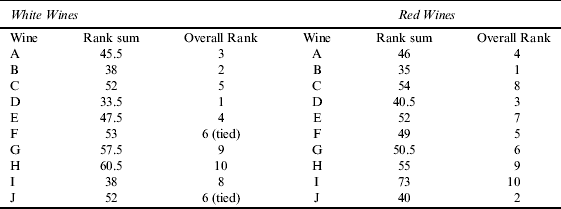
The Judgment of Princeton involved tasting 10 white and 10 red wines; in each case there were six wines from New Jersey and four from France.Footnote 1 Tasters were asked to assign “grades” to the wines ranging from zero (for pure vinegar) to a maximum of 20. The grades were then converted to ranks and the sum of the ranks assigned by the tasters to each wine were then summed; these rank sums then established an overall order among the wines. The rank sums were as follows:
Among the whites, wines C, D, H and J were French, the rest American; among the reds, A, B, G, and J were French, the rest American. A test of significant differences between the sums of rank sums for French and American wines requires us to divide the sum of rank sums in each category by the number of wines in that category and then take the ratio of these results; putting the American wines in the numerator and the French in the denominator yields for the test statistic 0.9916 for the white wines and 1.2575 for the red wines. The result indicates that there is no difference between the American and French white wines, but there is a significant difference between the groups of red wines, with the French wines deemed to be significantly better. It may be noted that this result is largely driven by Wine I, which very few tasters liked; if that wine had been excluded from the tasting, the French and American reds would have shown up much more nearly comparable. But in any event, given that the French wines in the tasting were an order of magnitude more expensive than the New Jersey wines, the latter performed more than creditably.
There is one more problem in relying on sums of ranks to judge the quality of wines. The problem is that this method violates what some people consider to be a desirable property of any method that could be used to convert individual preferences into and aggregate, social preference, namely that the results satisfy the axiom of the Independence of Irrelevant Alternatives; i.e., that if a low ranking alternative is eliminated, the rankings among the remaining alternatives should remain unchanged. It is easy to see that this axiom is violated by the method of ranking and basing our aggregate judgment on the sum of the ranks. It is also violated by an alternative method suggested by Victor Ginsburgh and Israel Zang,Footnote 2 in which tasters simply declare for each wine whether they “like it” or “not like it.” If a taster likes m wines out of n (m less than or equal to n), each of the “liked” wines is assigned a score of 1/m (the wines “not liked” get a score of zero); the aggregate score of each wine is then the sum of these scores over all the tasters. This is a much simpler and less demanding method of scoring wines, but it still violates the axiom. In the case of the white wines in the Judgment of Princeton tasting it induces an aggregate rank order (from best to worst) of A, D, G, B, E, I, H, F, J, C; if wine G were omitted, wines A and D would be tied for first. The extent to which aggregate rank orders depend on the precise method used for deriving them is illustrated by the fact that this rank order has a Spearman Rho correlation with the rank order based on the sum of the ranks of only 0.44. In the case of reds, the GZ method gives a ranking from best to worst as follows: D, C. B, J, F, A, E, H, G, I, which yields a rank correlation of 0.6 with the rank order determined by the more conventional method.
It is noteworthy that most wine ratings, whether Parker's 100-point scale, or the five-point scale used by Asimov in his New York Times ratings, or those of particular restaurants which may use a six or seven point scale, have a spurious implication that these ratings are cardinal measures. Such a view is, of course, incorrect. Grades given to wines can not be added and the differences between two grades have no meaning. This is why we have first converted the grades given in the Judgment of Princeton tastings to ranks. But even worse is another feature of assessments that masquerade as cardinal measures: since there is no natural zero in the scale on which wines are evaluated, nor a natural unit, judges can be wildly different with respect to the values they assign to wines. Thus, among the whites the mean grades given by the various judges ranged from 12.0 to 16.05 and the standard deviations from 1.03 to 2.93. The corresponding means for the reds ranged from 12.7 to 17.4 and the standard deviations from 1.09 to 3.82. As a result, the various judges will have highly uneven impacts on the final total if we should be so inclined as to get an aggregate measure of the wines by adding the individual grades together. In general, a judge who is a “harder” grader will have a smaller impact on the final standing of wines, as will a judge whose grades exhibit a smaller standard deviation.
Table 1 Rank Sums and Overall Ranks
A final difficulty is that all methods are manipulable; i.e., strategic voting is not discouraged. Michel Balinski and Rida Laraki prove a Theorem that there exists no method such that is optimal for each judge to provide honest grades to the wines (Balinski and Laraki, Reference Balinski and Laraki2010).
Consider a taster who likes just two wines. That decision would contribute scores of 0.5 to each of those wines. But if this taster badly wants one of these wines to win, he or she would claim not to like the other one, thus increasing the favorite wine's score by 0.5 and reducing the other wine's by the same amount. A similar situation arises if we rank the wines. A taster's favorite wine will be ranked first by that taster. But then, with respect to the remaining wines, there is no reason for the taster to honestly reveal his or her preferences. He could make a guess as to which of the remaining wines is likeliest to garner high ranks from the other tasters, and could then rank that wine last in his own ranking.
The many complexities of assessing the quality of wines makes such assessments a seemingly daunting enterprise. One would frankly be more skeptical of such an assessment when there is a monetary nexus involved: when the rater has something to gain from the result of the assessment. Conversely, one would be inclined to trust the results of an assessment exercise more when done by people for the sheer love of drinking wine, without the prospect of any “filthy lucre” in the background. Should the difficulties discourage us from doing the best we can in assessing the quality of wines in blind tasting? Absolutely not; at least not for those of us who believe that In vino veritas.

