


I. Introduction
Wine tastings can inspire lively discussion, commercial insight, controversy, and occasional offense. Some have found evidence that tasting results are significantly random (Weil, Reference Weil2001, Reference Weil2005). Others have found that tasting results are influenced by expertise, preferences, and many other factors, including the sex of a taster (Almenberg and Dreber, Reference Almenberg and Dreber2009; Amerine and Roessler, Reference Amerine and Roessler1976; Castriota, Curzi, and Delmastro, Reference Castriota, Curzi and Delmastro2012; Lecocq and Visser, Reference Lecocq and Visser2006; Pecotich and Ward, Reference Pecotich and Ward2010). Even wine competition judges' assessments to some extent appear random (Ashenfelter, Reference Ashenfelter2006; Cliff and King, Reference Cliff and King1997; Hodgson, Reference Hodgson2008; Quandt, Reference Quandt2012). On that foundation, it is not surprising that several analysts have shown that a wine's price is only a rough guide to how it compares to other wines in a flight (Almenberg and Dreber, Reference Almenberg and Dreber2009; Goldstein et al., Reference Goldstein, Almenberg, Dreber, Emerson, Herschkowitsch and Katz2008; Pecotich and Ward, Reference Pecotich and Ward2010).
Data from double-blind wine tastings presented herein deepens our understanding of tasting results and in some respects contradicts the results noted above. In certain respects, t-tests show that tasting results are not random at a 95% level of significance. The subject tasting data come from a group founded by the late wine writer Stephen R. Pitcher and collector David S. Rosen during the late 1980s.Footnote 1 The group remains active and has tasted, ranked, and discussed over 1,200 wines during the past 25 years. The implications of nine recent tastings are the subject of this article.Footnote 2 The group's tasting procedure is described in section II, analysis of the tasting results appears in section III, and conclusions follow in section IV.
II. Double-Blind Tasting Protocol
Each tasting involved six wines and nine to 19 participants, including wine writers, makers, collectors, distributors, and enthusiasts. In advance of each tasting, one participant placed each wine in a plain brown paper bag and removed both the cork and identifying neck foil, if any. A second participant, who did not see the wines as they were bagged, then mixed up the bagged bottles and labeled each with one of the letters A through F. Tastes were poured for each member, from left to right, in each member's six glasses. Along with the pour, each taster received a score sheet on which to make notes about and score each wine.
Next, a sponsoring member provided the group with an overview of the wines. This overview included the wines' variety and the ranges of years, appellations, and prices. In general, each tasting involved one variety from either one or contrasting appellations and a narrow range of years. Prices usually covered a broad range, however, there were no low-cost “ringers” in the subject data. Specific wine makers, vineyards, and prices were never mentioned in opening remarks. That information was disclosed only after all the scores had been tabulated. After the opening remarks, the participants then tasted and scored their wines. Discussion during this tasting period was minimal. Tasters ultimately ranked each wine from most-favored first place to least-favored sixth place and handed their score sheets to one member, who recorded the results.
After all tasters' results were recorded, the recording member calculated each wine's total of ranks, mean of ranks, and the number of rankings in first place, second place, and so on. When that process was complete, the wines were unbagged from last place to first place. Much discussion ensued. Only as each wine was unbagged did the recording member and all other tasters discover the maker, appellation, year, price, and other details of each wine. The tastings were double blind; no taster knew the letter label corresponding to any maker, appellation, year, or price until after the wines were ranked.
III. Randomness, Preferences, and Value
First, if a wine's position in a flight has an effect on its scores, then any conclusions about randomness, preferences, and value must take a wine's serial position into account. Does a wine's serial position have an effect on how it is scored? Is there flight-position bias? If palate fatigue, for example, causes scores on wine F to be more random, or higher or lower, than scores on wine A, then this change must be considered when comparing wines.
Each taster (t) assigns one of six ranks (r) to each wine (w) in each tasting event (e), r t,w,e∈(1, 2, 3, 4, 5, 6). Assigning or sampling without replacement, the mean rank (μ t,.,e) assigned by each taster to its six wines is 3.500, and the variance (σ t,.,e2) in those ranks is 2.917. For each wine in a tasting event, if ranks were random, the expected value of the ranks' mean (μ .,w,e) and variance (σ .,w,e2) are also 3.500 and 2.917. Thus, if flight-position bias exists, then the mean rank of wines in at least two positions (μ .,w,. for two w) must be significantly different from 3.500.Footnote 3 Students' t-tests are employed to test the hypothesis that the observed position means μ .,w,. differ from 3.500. Results, including t-test two-tailed p-values, appear in Table 1. The p-values show that none of the means differ from 3.500 with even a 75% level of significance. Accordingly, a wine's position in the flight (A, B, C, D, E, F) does not appear to affect its mean rank in a tasting.
Table 1 Mean Ranks and Flight-Position Bias

The finding above is consistent with tasting experience. Some tasters proceed from A through F, some from F through A, some jump around, some cleanse between wines with water or bland food, some spit, and most retaste to differentiate between wines that they plan to rank closely. The potential for palate fatigue is something that experienced tasters manage to minimize flight-position bias.
Turning to randomness and preferences, most of the authors noted in the Introduction have made estimates of the randomness in wine ratings. Their results vary, and some support the position that wine ratings, even by judges, are no better than random (Ashenfelter, Reference Ashenfelter2006; Cliff and King, Reference Cliff and King1997; Hodgson, Reference Hodgson2008; Sample, Reference Sample2011; and, most recently Quandt, Reference Quandt2012, concerning the Judgment of Princeton). Variance in the subject data appears to support those results, however, a closer look shows that a general conclusion that wine rankings are substantially random is flawed. As shown by further tests, in the subject data and at a 95% level of significance, some aspects of tasters' rankings do not appear to be random.
Data on group mean rank μ .,w,e, variance in ranks σ .,w,e2, and skewness (γ 1.,w,e) in ranks for each tasting, arranged in order of μ .,w,e from first to last place, are listed in Table 2. The means μ .,w,e rise from left to right and average 3.500. The variances σ .,w,e2 appear shift-invariant. Skewnesses γ 1.,w,e generally turn from positive to negative, appear shift invariant, and average nearly zero. Those results are characteristics of the moments and due to assignment or sampling without replacement.
Table 2 Mean, Variance, and Skewness by First to Last Place

The data in Table 2 have implications for the relative roles of preferences and randomness in tasters' rankings. A simple test suffices to show that the rankings summarized in Table 2 are not entirely random. Returning to r t,w,e∈(1, 2, 3, 4, 5, 6), if rankings were random, then the expected value of μ .,w,e would be 3.500. Random rankings would cause the observed μ .,w,e to cluster about 3.500. The t-statistics in Table 3 show that 28% of the μ .,w,e differ from 3.500 by over two sample-size-adjusted standard deviations.Footnote 4 These results imply strong non-random results for the highest- and lowest-ranked wines in particular.Footnote 5
Table 3 T-Statistics for Mean of Ranks Deviation from 3.5

Before proceeding, the results in Table 3 were compared to the results of a random-ranking Monte Carlo simulation, and those results are summarized in the last line of Table 3.Footnote 6 After 10,000 iterations with random wine rankings, approximately 8% of the t-statistics were greater than 2.0.Footnote 7 Some of the apparently significant tasting results may be illusory, and this is explained after more detailed analysis.
The skewnesses γ 1.,w,e in Table 2 and the significantly non-random results in Table 3 show that the distribution of ranks r t,w,e does not fit the moments of a random distribution. This finding is consistent with tasting experience. Many experienced tasters have some preferences in common; they agree on their relative assessments of a wine's color, clarity, finish, and general quality. While tasters may agree on some things, they are also idiosyncratic and often differ on their assessments of, and preferences concerning, attributes such as nose, varietal character, acid, oak, char, mineral, citrus, sweetness, and balance. They have some uniform preferences but diverge on idiosyncratic preferences that are rooted in the variance in people's taste buds and neurology. For example, one taster may prefer big, oaky, buttery Chardonnay, and another may prefer the austere result of stainless steel. Although both tasters may agree that both wines are well made, they may rank the wines differently due to their idiosyncratic preferences. Neither ranking is random and without regard for any preferences at all.
If all tasters ranked a wine the same, preferences in this case would be uniform alone, and variance σ .,w,e2 would be zero. Variance can only be due to idiosyncratic preference-based rankings and randomness. The distribution of rankings r t,w,e is thus a mixture distribution, and its unobservable components are the degenerate distribution of uniform preferences, the distribution of idiosyncratic preferences, and the distribution of random draws. Consequently, tests applied to the variance of the mixture distribution do not isolate the effects of variance due to the random component alone.
A closer look at rankings r t,w,e dissects where uniform preferences, idiosyncratic preferences, and randomness may reside. Student's t-test was again employed to compare the mean ranks μ .,w,e of the first place to second place, first place to third place, second place to third-place, and so on in each tasting. The results of these two-sample t-tests appear in Table 4.Footnote 8 The data show that the percentage of the tastings in which each wine's mean rank μ .,w=i,e differed from each other wine's mean rank μ .,w≠i,e with a one-tailed 95% level of significance.
Table 4 Paired T-Tests for a Difference in Means, % of wines
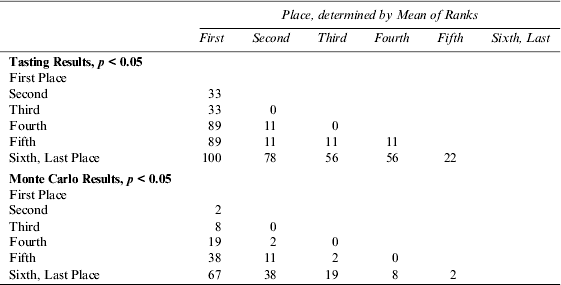
The results in Table 4 show that the chance that a wine's mean rank μ .,w=i,e is significantly different from another wine's mean rank μ .,w≠i,e increases with the difference between their mean ranks. Close calls are more likely to be separated by randomness than first from last place. For example, the mean rank of the first-place wine μ .,w = 1,e was different from the mean rank of the second-place wine μ .,w = 2,e in 33% of the tastings at a 95% level of significance.Footnote 9 The percentages increase from top to bottom and from right to left, the more distance between ranks, the more statistically significant the difference. The means of the first-place and last-place wines were different with 95% level of significance in all the tastings.
In contrast to the t-tests for the tasting results described above, the Monte Carlo simulation results in Table 4 show that randomness could account for a substantial portion of the apparent differences between wines.Footnote 10 Employing a wine's mean rank μ .,w,e to determine the winner, loser, and other positions of wines in a flight, a common wine-tasting procedure, is prone to Type I error false positive results.Footnote 11 Randomness can differentiate any one set of ranks from another and then ordering those sets by their means can yield false differences. The more sets, the more the statistical significance of the differences between sets that are ordered farther apart. Rerunning the Monte Carlo simulation without reordering the wines changed all the simulation results in Table 4 to 14%. This residual 14% is due to the combined effects of sampling without replacement and the remaining probability that a difference in ranks can appear statistically significant.Footnote 12
The Monte Carlo results do not mean that randomness accounts for, as an example, 67% of the difference between the first- and last-place wines. The observed ranks r t,w,e have a mixture distribution, and random rankings are one mixture component. Variance in observed ranks is due to both idiosyncratic preferences and randomness. The distribution of idiosyncratic preference rankings and the mixture weights on both idiosyncratic preferences and randomness are unknown. The observed variance is not decomposed; the contribution of randomness to that variance is unknown. The Monte Carlo results in Table 4 show the substantial portion of variance that could be due to randomness, but they are not an estimate of what is due to randomness. This finding illuminates the criticism and umbrage that ferment in the popular wine press when analysts assert that wine rankings are random (recently Shaw, Reference Shaw2011).
Now, to value. Again, only the price range of the wines may have been disclosed during the opening remarks to the tasting. The tasting protocol was double blind, and no taster knew the price of any particular wine until the group had finished its rankings. The correlation coefficients between price per bottle and each of the total of ranks, the number of first-place ranks, the number of second-place ranks, and so on appear in Table 5.
Table 5 Correlation Between $/Bottle Cost and Rank

First, the correlation between price and Total of Ranks is negative in Table 5 because more-preferred wines receive lower ranks. Consequently, the correlation between price and preference, the inverse of mean rank magnitude, has a weakly positive mean of 0.23. The correlations between price and the numbers of first place, second place, and so on ranks show high variation. Only the third-place wine's correlation to price is uniformly positive, and there is weak evidence that more last-place wines tend to be relatively expensive and first-place wines tend to be relatively less costly. In this respect, bargains seem to exist. Wine prices may be inefficient, or they may to some extent be efficient for idiosyncratic differences between tasters. Wines with certain taste profiles may be priced at a premium and worth it to idiosyncratic tasters who seek and value those profiles. Here again, results are based on correlations between price and a mixture distribution. They are not correlations between price and the nonrandom mixture component distributions.
IV. Conclusions
T-tests show that, in the subject tastings, a wine's position in a flight does not have a significant effect on the wine's mean rank. The distribution of ranks is a mixture distribution and its components are the distributions of uniform preferences, idiosyncratic preferences, and random draws. Evaluations of the variance in the mixture distribution do not isolate variance due to the random component alone. T-tests show that the potential for nonrandom differences between wines' ranks is positively related to the difference in wines' ranks. However, ranking procedures can lead to Type I errors that overstate the significance of differences between wines. The correlation between price per bottle and a wine's ranking is weakly positive on average but may be explained by an efficient market with idiosyncratic wine buyers.


