


INTRODUCTION
Litter quality and production are important for the functioning of forested ecosystems (Berglund & Ågren Reference BERGLUND and ÅGREN2012, Melillo et al. Reference MELILLO, MCGUIRE, KICKLIGHTER, MOORE, VOROSMARTY and SCHLOSS1993). Litterfall determines the input of soil organic matter that generates microclimatic conditions that favour habitats for decomposers (da Silva et al. Reference DA SILVA, PINHEIRO, CHAGAS-JR, MARQUES and BATTIROLA2018, Handa et al. Reference HANDA, AERTS, BERENDSE, BERG, BRUDER, BUTENSCHOEN, CHAUVET, GESSNER, JABIOL, MAKKONEN, MCKIE, MALMQVIST, PEETERS, SCHEU, SCHMID, VAN RUIJVEN, VOS and HÄTTENSCHWILER2014) and maintains carbon stocks and nutrient fluxes that sustain soil fertility (Aryal et al. Reference ARYAL, DE JONG, OCHOA-GAONA, MENDOZA-V and ESPARZA-OLGUIN2015, Lu & Liu Reference LU and LIU2012). Leaves represent up to around half of above-ground net primary productivity in tropical forests, but this proportion varies with climate and seasonality (Aryal et al. Reference ARYAL, DE JONG, OCHOA-GAONA, MENDOZA-V and ESPARZA-OLGUIN2015, Zhang et al. Reference ZHANG, YUAN, DONG and LIU2014), forest type and species composition (Handa et al. Reference HANDA, AERTS, BERENDSE, BERG, BRUDER, BUTENSCHOEN, CHAUVET, GESSNER, JABIOL, MAKKONEN, MCKIE, MALMQVIST, PEETERS, SCHEU, SCHMID, VAN RUIJVEN, VOS and HÄTTENSCHWILER2014, Rentería & Jaramillo Reference RENTERÍA and JARAMILLO2011). In tropical forest with dry season(s), litterfall correlates negatively with precipitation (Aryal et al. Reference ARYAL, DE JONG, OCHOA-GAONA, MENDOZA-V and ESPARZA-OLGUIN2015, Zhang et al. Reference ZHANG, YUAN, DONG and LIU2014). In the dry season, when litterfall is high, leaves tend to have low nutrient concentrations to reduce nutrient loss (Bernier et al. Reference BERNIER, HANSON, CURTIS and Hoover2008, Lorenz & Lal Reference LORENZ and LAL2010).
Nitrogen and carbon concentrations and C:N ratio are leaf chemical traits that are correlated to litter quality and decomposition rates (Jackson et al. Reference JACKSON, PELTZER and WARDLE2013, Zanne et al. Reference ZANNE, OBERLE, DUNHAM, MILO, WALTON and YOUNG2015). Leaf structural traits, such as leaf area (LA) and specific leaf area (SLA), reflect the investment of energy to optimize photosynthesis and to protect the leaves against herbivory (Poorter & Bongers Reference POORTER and BONGERS2006, Wright et al. Reference WRIGHT, REICH, WESTOBY, ACKERLY, ZDRAVKO, BONGERS, CAVENDER, CHAPIN, CORNELISSEN, DIEMER, FLEXAS, GARNIER, GROOM, GULIAS, HIKOSAKA, LAMONT, LEE, LEE, LUSK, MIDGLEY, NAVAS, NIINEMETS, OLEKSYN, POORTER, POOT, PRIOR, PYANKOV, ROUMET, THOMAS, TJOELKER, VENEKLAAS and VILLAR2004). Leaf traits and nutrient cycles at the ecosystem level depend on species composition that changes during succession (Chazdon Reference CHAZDON2014).
Succession in general starts with pioneer species that have leaves that tend to be highly palatable, with high N concentration but with short lifespan (Kazakou et al. Reference KAZAKOU, VIOLLE, ROUMET, PINTOR, GIMENEZ and GARNIER2009, Pérez-Harguindeguy et al. Reference PÉREZ-HARGUINDEGUY, DIAZ, CORNELISSEN, VENDRAMINI, CABIDO and CASTELLANOS2000). As succession advances, these species are replaced by shade-tolerant species that are characteristic of mature forests (Aide et al. Reference AIDE, ZIMMERMAN, PASCARELLA, RIVERA and MERCADO-VEGA2000, Saldarriaga et al. Reference SALDARRIAGA, WEST and THARP1988). These species grow slowly, have leaves with low N concentration, high C:N ratio (Kazakou et al. Reference KAZAKOU, VILE, SHIPLEY, GALLET and GARNIER2006, Pérez-Harguindeguy et al. Reference PÉREZ-HARGUINDEGUY, DIAZ, CORNELISSEN, VENDRAMINI, CABIDO and CASTELLANOS2000), and low SLA (Bakker et al. Reference BAKKER, CARREÑO and POORTER2011). These changes in leaf quality during succession influence the decomposition of the litter (Bakker et al. Reference BAKKER, CARREÑO and POORTER2011, Matsuki & Koike Reference MATSUKI and KOIKE2006). To provide a realistic description of the decomposition process, several studies have used double exponential equations to separate the volatile and stable parts of the leaf litter (Corbeels Reference CORBEELS, Kirshbaum and Muller2001, Wieder & Lang Reference WIEDER and LANG1982, Xu & Yuan Reference XU and YUAN2017). Other studies have analysed leaf traits in successional stages of tropical evergreen forest (Boukili & Chazdon Reference BOUKILI and CHAZDON2016, Hölscher et al. Reference HÖLSCHER, KÖHLER, LEUSCHNER and KAPPELLE2003, Lohbeck et al. Reference LOHBECK, POORTER, PAZ, PLA, VAN BREUGEL, MARTÍNEZ-RAMOS and BONGERS2012). In semi-evergreen forests, information is available about changes in litterfall and nutrient transfer during succession (Aryal et al. Reference ARYAL, DE JONG, OCHOA-GAONA, MENDOZA-V and ESPARZA-OLGUIN2015, Read & Lawrence Reference READ and LAWRENCE2003), and changes in decomposition rates (Xuluc et al. Reference XULUC, VESTER, RAMÍREZ, CASTELLANOS and LAWRENCE2003), but these are not related to changes in leaf traits. Therefore, the primary goal of this study is to contribute to our understanding of the changes in leaf traits, litterfall production and decomposition rates that occur during secondary succession in a semi-evergreen tropical forest in South-Eastern Mexico. We hypothesize that leaf traits in secondary forest are characterized by high N and SLA associated with high photosynthetic efficiency, opposed to the leaves in mature forest with low N and SLA that are considered as conservative strategies. These changes in leaf traits are correlated to slower leaf decomposition in mature forests, and we expect that the high investments in nutrient-rich leaves in secondary forests are partially maintained in the tree through foliar nutrient resorption before leaf abscission.
METHODS
Study site
The study site is located in the buffer zone of the Calakmul Biosphere Reserve (CBR), Campeche, South-East Mexico. The experimental plots were established in 2012 in two communities: Cristobal Colon and El Carmen (Aryal et al. Reference ARYAL, DE JONG, OCHOA-GAONA, ESPARZA-OLGUIN and MENDOZA-VEGA2014, Reference ARYAL, DE JONG, OCHOA-GAONA, MENDOZA-V and ESPARZA-OLGUIN2015). The area is of karstic origin with rolling limestone hills and ridges that range from about 100 to 360 m asl (Vester et al. Reference VESTER, LAWRENCE, EASTMAN, TURNER, CALMÉ, DICKSON, POZO and SANGERMANO2007). The soils in the uplands are dominated by lithosols and rendzinas; the lowland plains are characterized by small differences in relief, in which so-called bajos (small depressions) occur, which are dominated by vertisols where water accumulates during the rainy season (Bautista et al. Reference BAUTISTA, PALACIO, QUINTANA and ZINCK2011, Turner Reference TURNER2001, Vester et al. Reference VESTER, LAWRENCE, EASTMAN, TURNER, CALMÉ, DICKSON, POZO and SANGERMANO2007) and often dry out in the dry season.
The climate of the region is tropical sub-humid with rainfall varying between 900 to 1400 mm y−1 (with major portions of the rainfall from June to October) and mean annual temperature of around 26°C (García et al. Reference GARCÍA, PALACIO and ORTIZ2002). Three seasons can be distinguished: October–January, the season dominated by cold and rainy fronts coming from the north, February–May, dry and relatively cool, and June–September, with tropical rain storms and relatively hot (Figure 1).
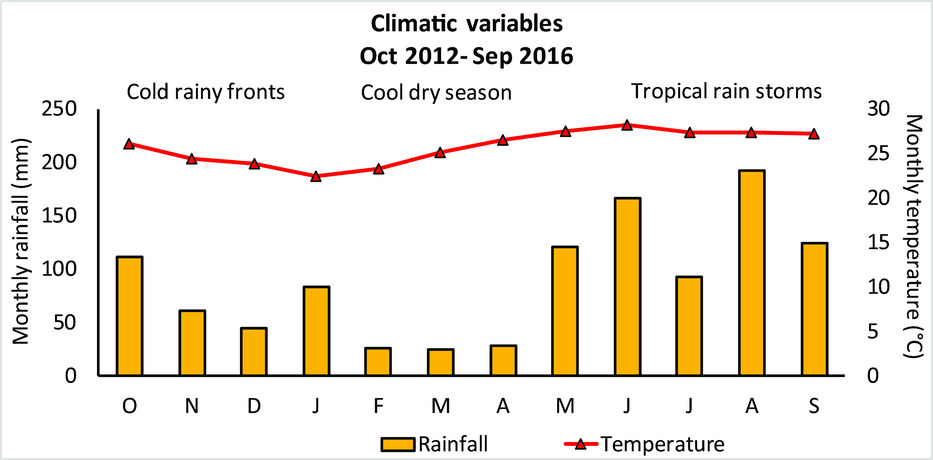
Figure 1. Average monthly temperature and precipitation for the study region between 2012 and 2016, obtained from the meteorological station, Xpuhil, Calakmul, Campeche, Mexico. Data courtesy of the Comisión Nacional de Agua (CONAGUA), Campeche.
Semi-evergreen tropical forest is the dominant ecosystem in the region (Rzedowski Reference RZEDOWSKI1978, Turner Reference TURNER2001), of which large parts have been converted to slash-and-burn agriculture, creating a mosaic of agricultural lands mixed with secondary forests in various stages of development (Aryal et al. Reference ARYAL, DE JONG, OCHOA-GAONA, ESPARZA-OLGUIN and MENDOZA-VEGA2014), and patches of remnant mature forests. The characteristic species of young secondary forest (YSF) are Lonchocarpus guatemalensis, Bursera simaruba, Hampea trilobata, Lonchocarpus rugosus and Thevetia ahouai. The medium-aged secondary forest (MSF) is dominated by Lonchocarpus guatemalensis, Croton icche, Guettarda combsii, Coccoloba reflexiflora and Eugenia ibarrae. The most abundant species in advanced secondary forest (ASF) are Croton arboreus, Lonchocarpus guatemalensis, Bursera simaruba, Guettarda combsii and Eugenia winzerlingii. In mature forests (MF) Pouteria reticulata, Gymnanthes lucida, Piper yucatanense, Eugenia ibarrae, Nectandra salicifolia and Manilkara zapota dominate (adapted from Aryal et al. Reference ARYAL, DE JONG, OCHOA-GAONA, ESPARZA-OLGUIN and MENDOZA-VEGA2014, Reference ARYAL, DE JONG, OCHOA-GAONA, MENDOZA-V and ESPARZA-OLGUIN2015; full names in Appendix 1).
Experimental design
The experiments were set up in 16 permanent forest monitoring plots, with four plots in each of four stages of succession: young (YSF, around 8 y old), medium-aged (MSF around 15 y), advanced secondary forests (ASF, around 25 y) and mature forests (MF, not cleared for more than 100 y). In a separate study, a forest inventory was carried out in the same plots, that is used here to determine tree species composition (Aryal et al. Reference ARYAL, DE JONG, OCHOA-GAONA, ESPARZA-OLGUIN and MENDOZA-VEGA2014).
Leaf traits
We collected leaves from the 15 most abundant tree species in each plot, with a total of 61 species (out of 149 species present in all plots). These species represented between 63% and 92% of all standing trees >5 cm diameter at breast height (1.3 m). The collected leaves were photosynthetically active with no signs of herbivory. For small trees, we collected leaves from the crown, and for medium and tall trees we sampled those leaves partially or completely exposed to vertical sunlight (Cornelissen et al. Reference CORNELISSEN, LAVOREL, GARNIER, DÍAZ, BUCHMANN, GURVICH, REICH, TER STEEGE, MORGAN, VAN DER HEIJDEN, PAUSAS and POORTER2003). The following leaf structural traits were determined for each collected leaf. (For species with compound leaves, leaflets were used as a sample unit, Poorter et al. Reference POORTER, VAN DER PLASSCHE, WILLEMS and BOOT2004.)
The LA was measured by scanning fresh leaves with an EPSON Perfection V300 and the area represented by each leaf surface estimated with Adobe Photoshop (0.1 mm). The SLA was calculated, dividing LA by dry weight. One leaf of each tree was ground (excluding the midrib) (Cornelissen et al. Reference CORNELISSEN, LAVOREL, GARNIER, DÍAZ, BUCHMANN, GURVICH, REICH, TER STEEGE, MORGAN, VAN DER HEIJDEN, PAUSAS and POORTER2003), sieved through a 0.5-mm mesh and C concentration, N concentration and C:N ratio determined with a Perkin-Elmer CHNO/S 2400 analyser.
The leaf traits measured for each species were extrapolated to the plot level, where the trait value of each species was multiplied by the relative importance of this species in each plot (the relative importance of each species was derived from the inventory data and calculated as the sum of the relative basal area and relative abundance of this species). The weighted trait values were summed within a plot and divided by the percentage of the total relative importance of all species for which a trait value was determined, to obtain the ecosystem-level leaf trait value of the particular plot.
Litterfall
In each plot, litterfall was collected monthly from October 2012 to September 2016 in 12 circular litter traps of 0.5 m2 (Cuevas & Medina Reference CUEVAS and MEDINA1986), placed in each monitoring plot. All the traps were placed at a height of about 1 m from the ground surface. The litter samples were collected in paper bags and transported to the laboratory for processing. The samples were oven-dried at 70°C for 3 d to obtain stable dry weight and separated into leaves, twigs and bark, fruits and flowers. These components were weighed separately.
Nutrient concentration of litterfall and litter on the forest floor
Carbon and nitrogen concentration and the C:N ratio of litterfall, collected in October 2015, February, June and September 2016, were analysed with a Perkin-Elmer CHNO/S 2400 analyser, to determine intra- and inter-annual variation of litter quality.
To evaluate possible differences in C and N concentration in the litter layer of the successional stages, four random samples from the forest floor were collected in October 2016 within each plot, and each sample was separated in three layers: Oi, the organic horizon characterized by relatively intact plant material, Oe, the organic horizon characterized by partly decomposed organic matter, and Oa, the organic horizon of fully decomposed organic matter (humus). The samples were subsequently dried, weighed and a subsample of each layer was analysed for carbon and nitrogen concentration and C:N ratio with a Perkin-Elmer CHNO/S 2400 analyser.
Decomposition experiments
The litterbag method was used to analyse the decomposition process (Cuevas & Medina Reference CUEVAS and MEDINA1986). Litterbags were made from polyethylene of 150×150 mm with 1-mm mesh size on the bottom part of the bag and 2 mm at the upper part to allow access to the litter by macrofauna during the decomposition process (Karberg et al. Reference KARBERG, SCOTT, GIARDINA and Hoover2008). We established two decomposition experiments in each of the 16 plots. For the first experiment, we used the litterfall collected within the plot (mixed and cut into pieces) and 10 g of which was put into each litterbag, and then placed in the same plot where the leaves were collected. For the second experiment, we used a standard litter from a single, widespread species (Piscidia piscipula; 10 g in each litterbag) which was placed in all plots as a control.
Thus, a total of 34 litterbags were placed in each of the 16 plots. Half of these litterbags contained the mixed litterfall from that particular plot (plot litter), and the other half the standard litter of Piscidia piscipula. One litterbag of each experiment and each plot was re-collected weekly during the first month, fortnightly during the next 2 mo and monthly for the next 9 mo to complete a year, from October 2015 to September 2016, with a total of 17 collection dates. This collection pattern allowed us to detect and separate the fast decomposition of soluble parts from the slower decomposition of the more stable elements.
The litterbags were carefully removed from the soil to avoid loss of litter and put into a paper bag. In the laboratory, the outer parts of the litterbags were carefully cleaned with forceps to eliminate soil particles, emerging fine roots, seedlings and other material that was attached to the bags. The remaining litter was oven-dried at 70°C for 48 h and weighed to 0.001 g. Subsamples of litter collected in each plot at months 0, 4, 8 and 12 were ground in a mill to pass through a sieve to assess C concentration, N concentration and C:N ratio with a Perkin-Elmer CHNO/S 2400 analyser.
Subsamples of all litter components (litterfall, litter from litterbags and forest floor) were combusted in a furnace at 550°C for 4 h, to determine ash content (Ostertag et al. Reference OSTERTAG, MARÍN, SILVER and SCHULTEN2008) and all weights were corrected according to the per cent of ash to obtain ash-free weights.
Decomposition rates
To estimate the decomposition rates we tested three models, the single exponential model (Eq. 1; Olson Reference OLSON1963); a modification of the single exponential model, where time is added as an independent variable (Eq. 2; Kelly & Beauchamp Reference KELLY and BEAUCHAMP1987) and the double exponential model, which separates the decomposition rates of the volatile and stable parts of the leaf mass (Eq. 3; Wieder & Lang Reference WIEDER and LANG1982):
 $$\begin{equation}
{M_t} = {M_0}{e^{\left( { - kt} \right)}} + \ \varepsilon \\
\end{equation}$$
$$\begin{equation}
{M_t} = {M_0}{e^{\left( { - kt} \right)}} + \ \varepsilon \\
\end{equation}$$
 $$\begin{equation}
{M_t} = {M_0}{e^{( - k{t^p})}} + \varepsilon \\
\end{equation}$$
$$\begin{equation}
{M_t} = {M_0}{e^{( - k{t^p})}} + \varepsilon \\
\end{equation}$$
 $$\begin{equation}
{M_t} = A.{M_0}{e^{\left( { - {k_1}t} \right)}} + (1 - A){M_0}{e^{(-{k_2}t)}} + \varepsilon
\end{equation}$$
$$\begin{equation}
{M_t} = A.{M_0}{e^{\left( { - {k_1}t} \right)}} + (1 - A){M_0}{e^{(-{k_2}t)}} + \varepsilon
\end{equation}$$
Where, M0 is the initial mass, Mt is the remaining mass at a certain time, t is time (mo), Ɛ is the random error; k, k 1 and k 2 are the unknown decay constants estimated from the data, and p the time-dependent relative decomposition rate, A represents the fraction of stable leaf mass and (1−A) the volatile fraction, where k, k1, k2, p, A and (1−A) are parameters, estimated from the leaf litter weights in the 17 litterbags collected during the 1-y experiment.
In all cases, equation 2 and 3 gave the best fit. Of these two models, we selected the double exponential model (eq. 3), when k1 (decomposition rate constant of the stable fraction of the leaf) and A (the proportion of stable leaf mass) were significant, otherwise we applied the modified simple exponential model (eq. 2) with the time-dependent relative decomposition parameter t.
Statistical analysis
To test how the successional stage was related to leaf traits, we applied a discriminant analysis with all selected standardized leaf traits as independent variables with the program XLSTAT. We applied a Pearson correlation coefficient to assess possible correlations among the leaf traits, and between the leaf traits and remaining litter in the litterbags after 1 y of decomposition (RemLeaf).
Differences between successional stages, months and years of collected leaf litterfall, C concentration, N concentration and C:N ratio were tested with a repeated-measures ANOVA and differences between groups (stages, months and years) were determined with the Tukey HSD test (P < 0.05).
Statistical differences of litter decomposition rates between the four successional stages were tested with a repeated-measures ANOVA and we applied the Tukey HSD (P < 0.05) to test for significant differences between stages, using the monthly remaining weight as dependent variables.
Differences between stages in C concentration, N concentration and C:N ratio of litter from the litterbags were tested with a repeated-measures ANOVA and a Tukey HSD post hoc test (P < 0.05).
Differences in C concentration, N concentration and C:N ratio of fresh leaves, litter from litter traps and forest floor were analysed with a factorial ANOVA and a Tukey HSD post hoc test (P < 0.05) was applied to identify significant differences between either successional stages or pools with the program Statistica 8.
RESULTS
Leaf traits
SLA was lowest in mature forest and did not differ among the earlier stages, and likewise, foliar N concentration was also lowest and C:N highest in mature forest (Table 1). This reduction in N concentration reflects the lower leaf nutrient quality in MF. Leaf area and C concentration presented no significant differences among stages (in Appendix 1 we present the stages and average leaf traits of all the species we collected and analysed).
Table 1. Ecosystem-level leaf traits with SE in four successional stages of semi-evergreen forests around the Calakmul Reserve, Campeche, Mexico; YSF = young secondary forest; MSF = medium-aged secondary forest; ASF = advanced secondary forest and MF = mature forest. LA = leaf area, SLA = specific leaf area, C = carbon concentration, N = nitrogen concentration and C:N = carbon nitrogen ratio. Lowercase letters denote significant differences between successional stages (ANOVA, Tukey HSD, P < 0.05).

The discriminant analysis separated MF completely, whereas the selected leaf traits did not allow a complete separation of the secondary stages. The first axis of the discriminant analysis explained about 94% of the variation between the stages, mainly due to the differences in SLA and C and N concentrations (Figure 2).
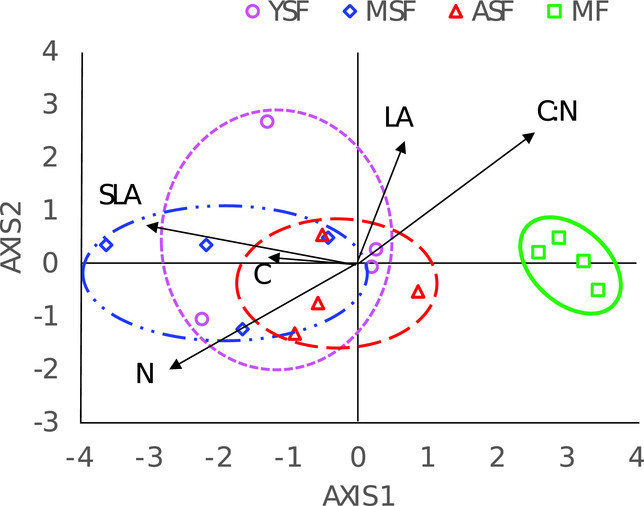
Figure 2. Discriminant analysis to separate successional stages of semi-evergreen forests around the Calakmul Reserve, Campeche, Mexico, with the following leaf traits as explanatory variables: SLA = specific leaf area, LA = leaf area, C = carbon concentration, N = nitrogen concentration and C:N ratio. YSF = young secondary forest; MSF = medium-aged secondary forest; ASF = advanced secondary forest; MF = mature forest.
SLA and foliar N concentration were negative correlated with the mass of leaf litter remaining in litter bags after 1 y (RemLeaf; Table 2), whereas C:N ratio was positively correlated with RemLeaf; in other words, lower SLA and N, and higher C:N ratio values slowed down decomposition.
Table 2. Pearson correlation coefficients between standardized leaf traits (calculated at plot level) and remnant litter of semi-evergreen forests around the Calakmul Reserve, Campeche, Mexico. LA = leaf area, SLA = specific leaf area, C = carbon concentration, N = nitrogen concentration, C: N = carbon nitrogen ratio and Remleaf = litter remaining in litterbag after 1 y. Significant correlations are indicated as * for P < 0.05 and ** for P < 0.01.

Litterfall
The average annual leaf litterfall presented significant differences among the successional stages (F = 7.19, P < 0.001), with the highest litterfall in MSF (5.7 Mg ha−1 y−1), followed by ASF (5.6 Mg ha−1 y−1) and lowest in YSF with (4.4 Mg ha−1 y−1). Leaf litter production varied between years (Table 3) and within a year (Figure 3). The lower litter production in mature forest was partially compensated by higher flower and fruit production (data not presented). Analysing differences in litter production for each year separately we observed for the first (F = 7.4, P < 0.001) and the third year (F = 3.55; P < 0.05) significant differences among successional stages.
Table 3. Annual leaf litterfall (Mg ha−1) with SE in young (YSF), medium-aged (MSF), advanced (ASF) secondary forests and mature forest (MF) of semi-evergreen forests around the Calakmul Reserve, Campeche, Mexico. Uppercase letters indicate statistical differences between successional stages within a specific year, lowercase letters indicate statistical differences between years within a successional stage (ANOVA, Tukey HSD, P < 0.05).

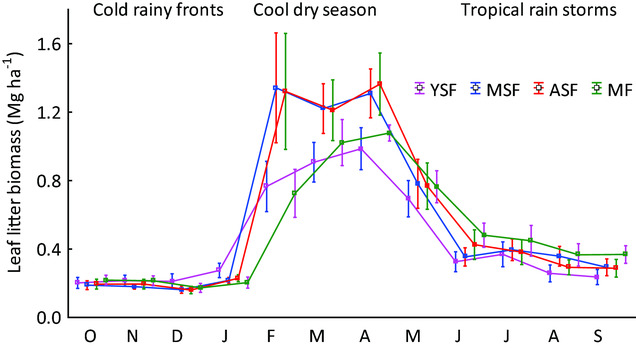
Figure 3. Average monthly litterfall in four successional stages of semi-evergreen forests around the Calakmul Reserve, Campeche, Mexico. Uncertainty bars show the 95% confidence interval of the monthly litterfall of the four plots in each successional stage (four plots, 4 y of data). YSF = young secondary forest; MSF = medium-aged secondary forest; ASF = advanced secondary forest; MF = mature forest.
Litterfall in all successional stages was highest from February to May, comprising between 65% and 75% of annual litterfall, which period coincides with the dry season. This peak was highest in medium and advanced successional stages, but less pronounced in young secondary and mature forest (Figure 3).
The C and N concentrations of the litterfall varied significantly within a year with the highest concentration during the rainy season (September), when litterfall was lowest, and lowest at the onset of the rainy season (June), when litterfall started to drop down. The C:N ratio showed an opposite trend to N, with highest values (46.6) in June, when N was lowest (1.11) and lowest C:N values (27.1) in the rainy season, when N was highest (1.98, Table 4).
Table 4. Intra-annual variation of C and N-concentration and C:N ratio in leaf litter with SE collected in semi-evergreen forests around the Calakmul Reserve, Campeche, Mexico. Significant differences between months are indicated with a small letter (ANOVA, Tukey HSD, P < 0.05).

Litter decomposition
The rate of litter decomposition of the control species (standard litter) did not differ significantly between the successional stages, indicating that environmental conditions did not influence decomposition rates between the stages. The loss of leaf mass of the litter mixture was significantly lower in mature forest, compared with the three successional stages and were all significantly lower than the decomposition rates of the control species (Figure 4). In most cases model 3 was selected, except when k1 or A was insignificant (Appendix 2). Both model 2 and 3 showed better fits to the data (Appendix 3). Model 3 separated well the fast decomposition of the volatile parts (Appendix 4).

Figure 4. Remaining leaf mass and their standard error during the 1-y leaf litter decomposition experiment in semi-evergreen forests around the Calakmul Reserve, Campeche, Mexico. Letters next to the models reflect the statistical difference between the decomposition trend of plot litter (PL) in MF compared to all secondary stages (MF different from all secondary stages) and the standard litter (SL, different from all plot litter). YSF = young secondary forest; MSF = medium-aged secondary forest; ASF = advanced secondary forest; MF = mature forest.
C and N concentrations in the remaining litter changed during the decomposition experiment, with no statistical differences among successional stages. Particularly the N concentration in the remaining litter fluctuated significantly during the decomposition process, decreasing sharply between months 2 and 4 of the experiment. In the last two measurements, N concentration increased slowly in all stages, possibly due to a variation in the litter mixture in the bags, or fungus contamination that could not be removed. The C concentrations dropped in all stages, as expected, with the highest loss in the first 2 mo and lower loss in subsequent periods (Figure 5a, b).
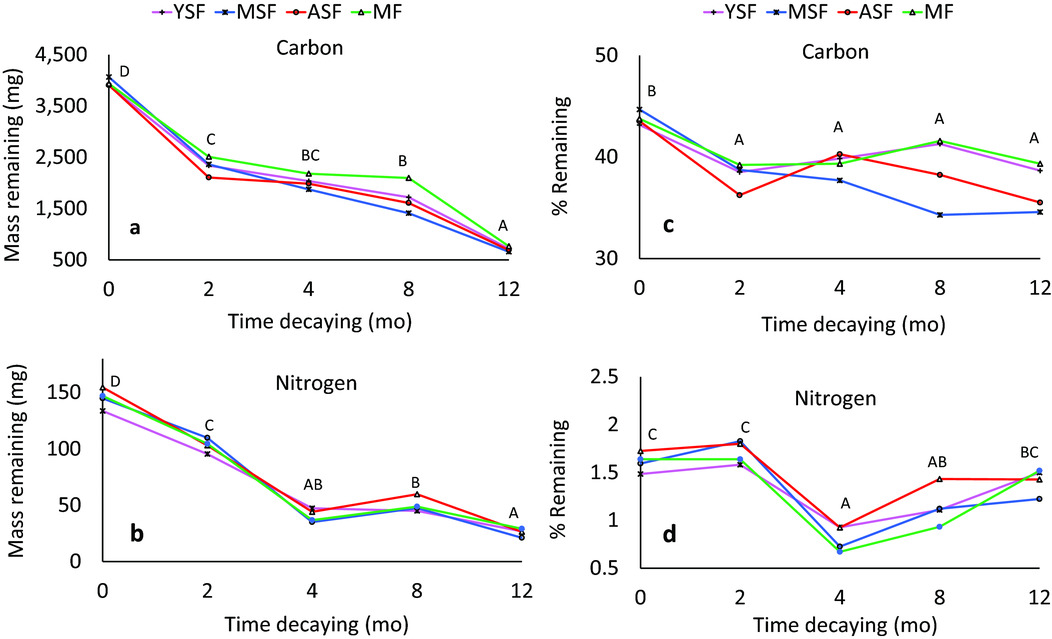
Figure 5. Carbon (C) and Nitrogen (N) mass (in mg) and concentration (in %) during the decomposition of the litter mixture in four successional stages of semi-evergreen forests around the Calakmul Reserve, Campeche, Mexico. Figure 5a = C mass, 5b = N mass, 5c = C concentration, 5d = N concentration. Capital letters in each figure indicate significant differences between dates (Tukey, P < 0.05). YSF = young secondary forest; MSF = medium-aged secondary forest; ASF = advanced secondary forest; MF = mature forest.
Net loss of both C and N mass was initially fast in all stages. Loss of C mass was highest during the first 2 mo, whereas the proportion of N mass loss was highest in the subsequent 2 mo (Figure 5c, d). Remnant N mass fluctuated a little between months 4 and 8 in MSF and ASF, similar to the increase in N concentration.
C concentration of litter in the traps was significantly higher than the C concentration of the various horizons on the forest floor due to loss of C during decomposition, as expected. C concentration showed a downward trend from litter in traps, little decomposed litter on the forest floor (Oi) and was lowest for highly decomposed material (Oe and Oa, Figure 6a). The N concentration of fresh leaves collected from the trees on average exceeded that of litter collected in the litter traps of the same month. There were significant differences in N concentrations of fresh leaves between different stages, with highest concentrations in MSF and lowest in MF, but we did not find any differences in N concentrations between successional stages for the litter collected from traps and litter on the forest floor (Figure 6b). C:N ratio decreased slowly from fresh leaves to litterfall and litter on the forest floor, although some variation was observed in young secondary forest (Figure 6c).
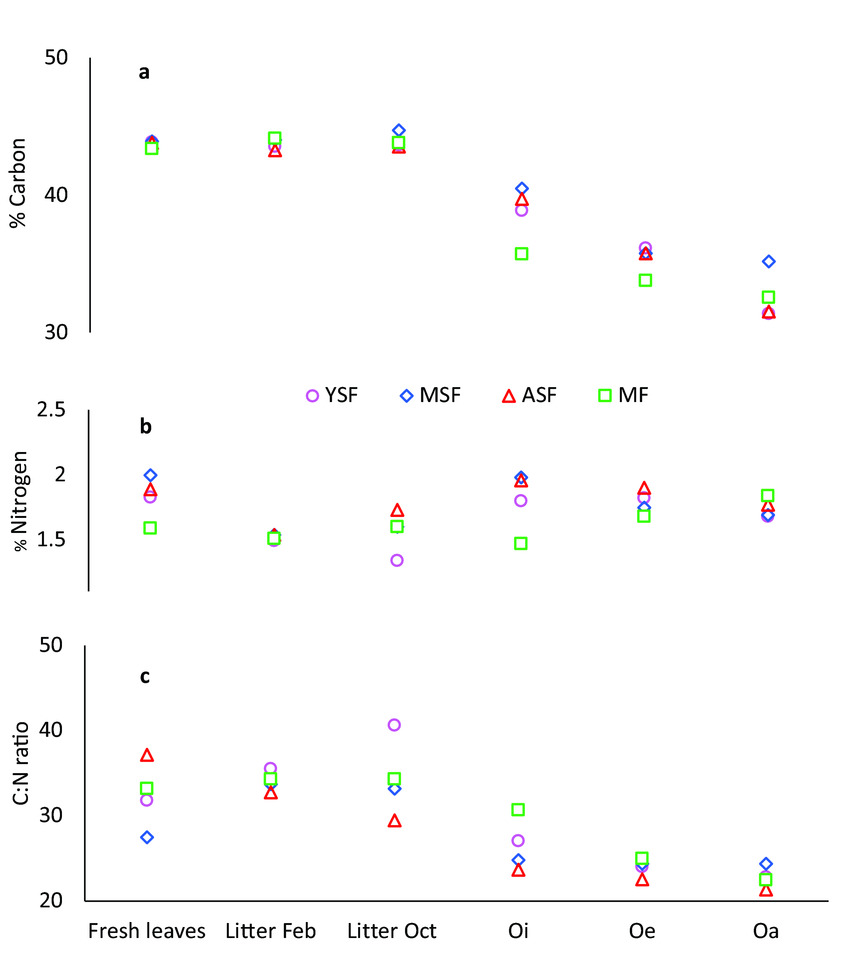
Figure 6. Carbon (a) and Nitrogen (b) concentration and C:N ratio (c) in fresh leaves, litter collected in February (Litter Feb) and October (Litter Oct) and litter from the forest floor in semi-evergreen forests around the Calakmul Reserve, Campeche, Mexico. Oi = fresh litter; Oe = litter in decomposition; Oa = highly decomposed organic material. YSF = young secondary forest; MSF = medium-aged secondary forest; ASF = advanced secondary forest; MF = mature forest.
DISCUSSION
Leaf traits and their relation to the rate of decomposition
SLA and N concentration showed significant differences between secondary and mature forest, with lower values of SLA and N concentrations in mature forest, as has been observed in other studies (Matsuki & Koike Reference MATSUKI and KOIKE2006). C concentrations in leaf litter from secondary forests were somewhat higher than in mature forest, but with no significant differences. Moura et al. (Reference MOURA, ALTHOFF, OLIVEIRA, SOUTO, SOUTO, MENEZES and SAMPAIO2016) also found higher C concentrations in intermediate secondary forests. The differences observed in SLA and N concentration can be attributed to the leaf economic spectrum (LES), which explains that vascular plants trade-off rapid resource acquisition against resource conservation (Jackson et al. Reference JACKSON, PELTZER and WARDLE2013, Poorter & Bongers Reference POORTER and BONGERS2006). Secondary species (with resource acquisitive leaves) have high SLA and N concentration in leaves. In contrast, dominant species of MF generally have lower SLA and N concentration (considered as resource conservative) of leaves (Bakker et al. Reference BAKKER, CARREÑO and POORTER2011, Kazakou et al. Reference KAZAKOU, VILE, SHIPLEY, GALLET and GARNIER2006, Pietsch et al. Reference PIETSCH, OGLE, CORNELISSEN, CORNWELL, BÖNISCH, CRAINE, JACKSON, KATTGE, PELTZER, PENUELAS, REICH, WARDLE, WEEDON, WRIGHT, ZANNE and WIRTH2014, Quested et al. Reference QUESTED, ERIKSSON, FORTUNEL and GARNIER2007). The leaves of species in mature forests also tend to stay longer on the tree than leaves of species from early secondary stages (leaf lifespan, LL), which is also considered part of the LES (Wright & Westoby Reference WRIGHT and WESTOBY2000), although we were not able to assess this.
The positive correlation between SLA and N concentration implies that species with higher photosynthetic capacity have higher N concentration and possibly a shorter LL (Hikosaka & Osone Reference HIKOSAKA and OSONE2009, Poorter & Bongers Reference POORTER and BONGERS2006, Matsuki & Koike Reference MATSUKI and KOIKE2006, Wright et al. Reference WRIGHT, REICH, WESTOBY, ACKERLY, ZDRAVKO, BONGERS, CAVENDER, CHAPIN, CORNELISSEN, DIEMER, FLEXAS, GARNIER, GROOM, GULIAS, HIKOSAKA, LAMONT, LEE, LEE, LUSK, MIDGLEY, NAVAS, NIINEMETS, OLEKSYN, POORTER, POOT, PRIOR, PYANKOV, ROUMET, THOMAS, TJOELKER, VENEKLAAS and VILLAR2004). Species with a high photosynthetic capacity tend to grow fast, produce leaves with high nutrient concentrations (in our case N), and have few defences against herbivory and microbial activity (Finerty et al. Reference FINERTY, DE BELLO, BÍLÁ, BERG, DIAS, PEZZATTI and MORETTI2016, Jackson et al. Reference JACKSON, PELTZER and WARDLE2013, Poorter et al. Reference POORTER, VAN DER PLASSCHE, WILLEMS and BOOT2004). Such leaf characteristics were observed in the younger stages of succession in our study, where SLA and N were the leaf traits that separated secondary forests from mature forests. The leaf traits were not able to separate the early, intermediate and advanced secondary stages, possibly due to the fact that the changes in species composition takes more years (Aryal et al. Reference ARYAL, DE JONG, OCHOA-GAONA, ESPARZA-OLGUIN and MENDOZA-VEGA2014) before it will be noted in the ecosystem-level leaf traits.
Since there were no differences among successional stages in decomposition rates of the standard litter, this suggests that litter quality, rather than microclimatic effects, was the main factor driving differences in decomposition rate of the litter between secondary forests and mature forest (Li et al. Reference LI, TIAN, ZHANG, XU, WANG and KUZYAKOV2017, Szefer et al. Reference SZEFER, CARMONA, CHMEL, KONEČNÁ, LIBRA, MOLEM, NOVOTNÝ, SEGAR, ŠVAMBERKOVÁ, TOPLICEANU and LEPŠ2017). The leaf traits SLA and foliar N concentration correlated positively and C:N ratio negatively with decomposition rates, consistent with other studies (Bakker et al. Reference BAKKER, CARREÑO and POORTER2011, Freschet et al. Reference FRESCHET, AERTS and CORNELISSEN2012, Pérez-Harguindeguy et al. Reference PÉREZ-HARGUINDEGUY, DIAZ, CORNELISSEN, VENDRAMINI, CABIDO and CASTELLANOS2000, Taylor et al. Reference TAYLOR, PARKINSON, PARSONS and FEB1989). The relation between the decomposition rate and N concentration can be attributed to the fact that N concentration directly impacts microbial activity, and thus the decomposition process (Berg & McClaugherty Reference BERG and MCCLAUGHERTY2008, Cleveland & Liptzin Reference CLEVELAND and LIPTZIN2007, Seneviratne Reference SENEVIRATNE2000).
In this study we collected the leaves that were partially shaded and partially exposed to vertical sunlight (Cornelissen et al. Reference CORNELISSEN, LAVOREL, GARNIER, DÍAZ, BUCHMANN, GURVICH, REICH, TER STEEGE, MORGAN, VAN DER HEIJDEN, PAUSAS and POORTER2003, Dawkins & Field Reference DAWKINS and FIELD1978), as these conditions reflect the dominant condition of the forest environment and are well suited for the purpose of our study (Poorter & Bongers Reference POORTER and BONGERS2006). This may reduce the capacity to compare our results with other studies that have quantified changes in SLA and foliar nutrient concentrations of species across chronosequences of secondary succession (Lohbeck et al. Reference LOHBECK, LEBRIJA-TREJOS, MARTÍNEZ-RAMOS, MEAVE, POORTER and BONGERS2015), as these authors collected leaves from completely sun-exposed shoots in the upper canopy (Pérez-Harguindeguy et al. Reference PÉREZ-HARGUINDEGUY, DIAZ, GARNIER, LAVOREL, POORTER, JAUREGUIBERRY, BRET-HARTE, CORNWELL, CRAINE, GURVICH, URCELAY, VENEKLAAS, REICH, POORTER, WRIGHT, RAY, ENRICO, PAUSAS, DE VOS, BUCHMANN, FUNES, QUÉTIER, HODGSON, THOMPSON, MORGAN, TER STEEGE, VAN DER HEIJDEN, SACK, BLONDER, POSCHLOD, VAIERETTI, CONTI, STAVER, AQUINO and CORNELISSEN2013).
Variation in litterfall and associated nutrient transfer from trees to forest floor
Leaf litterfall varied between years, between months and between successional stages. The average annual leaf litterfall increased from young to intermediate stages of recovery, and decreased slightly in mature forest. These differences are not significant in separate annual cycles, stressing the importance of collecting litterfall data over longer periods, as pointed out by various authors (Drake et al. Reference DRAKE, DAVIS, RAETZ and DELUCIA2011, Hughes et al. Reference HUGHES, KAUFFMAN and JARAMILLO1999, Ostertag et al. Reference OSTERTAG, MARÍN, SILVER and SCHULTEN2008). The decrease in litterfall in mature forest is partly due to changes in stand structure and species composition (Moura et al. Reference MOURA, ALTHOFF, OLIVEIRA, SOUTO, SOUTO, MENEZES and SAMPAIO2016, Ohtsuka et al. Reference OHTSUKA, SHIZU, NISHIWAKI, YASHIRO and KOIZUMI2010) producing leaves with longer livespans (Matsuki & Koike Reference MATSUKI and KOIKE2006), and partly due to a transfer of metabolic investments from leaves to reproductive parts (Ryan et al. Reference RYAN, BINKLEY and FOWNES1997). Seasonal fluctuations in litterfall were correlated with seasonal fluctuations in precipitation, as has also been observed in other studies (Kotowska et al. Reference KOTOWSKA, LEUSCHNER, TRIADIATI and HERTEL2016, Sayer & Tanner Reference SAYER and TANNER2010). This fluctuation is less pronounced in mature forests, possibly due to having leaves with longer LL.
Nutrient concentrations in leaf litter varied among seasons, with highest C concentrations and N concentrations in the rainy season and lowest at the end of the dry season. Read & Lawrence (Reference READ and LAWRENCE2003) also pointed out that nutrient concentrations in litter are highest during the wet season. N concentrations of fresh leaves in secondary forests were higher than those in litter from traps, indicating that part of the N in fresh leaves was mobilized to other plant tissues before leaf abscission (Chavez et al. Reference CHAVEZ, GONZALEZ, ETCHEVERS, OYAMA and GARCÍA-O2015), a process known as foliar nutrient resorption (FNR), confirming our hypothesis that these high investments in nutrient-rich leaves in secondary forests are partially preserved before abscission. Neither C nor N concentrations in litter from traps showed differences among the successional stages. C concentration decreased gradually from litter in the traps to the humus horizon on the forest floor, as observed in other studies (Berg & McClaugherty Reference BERG and MCCLAUGHERTY2008, Ono et al. Reference ONO, HIRADATE, MORITA and HIRAI2013).
Changes in C and N concentrations and mass during decomposition
Rapid loss of litter C mass within the first 2 mo was probably caused by microbial use of easily assimilated carbohydrates (glucose, cellulose and hemicellulose; Berg & McClaugherty Reference BERG and MCCLAUGHERTY2008), i.e. positive priming (Li et al. Reference LI, TIAN, ZHANG, XU, WANG and KUZYAKOV2017). During these first 2 mo, N concentrations remained at the same level in all successional stages, but N started to mineralize rapidly after 2 mo, when almost all of the volatile C had disappeared (derived from the results of the two-component decomposition model used in our analysis, Appendix 4). The remaining more-complex C components, like lignin, tannins and polyphenols, were less attractive for the microbial community (Berg & McClaugherty Reference BERG and MCCLAUGHERTY2008), which explained the much slower rate of C loss in the subsequent period.
In terms of mass loss, initially the proportion of C loss (around 40%) was much higher than the proportion of loss of leaf mass (around 30%), whereas N mass initially decreased in a similar proportion as leaf mass. In the subsequent period, when the labile C mass had disappeared, the proportion of N loss increased significantly (around 50% and more in 2 mo). After 4 mo, the proportion of C mass loss was similar to the loss of leaf mass, whereas N mass fluctuated a little, possibly due to an increase in fungus contamination of the samples (Berg & McClaugherty Reference BERG and MCCLAUGHERTY2008, Xuluc et al. Reference XULUC, VESTER, RAMÍREZ, CASTELLANOS and LAWRENCE2003).
The combination of ecosystem-level leaf structural and chemical traits is a good predictor of the successional stage the forest is in, and explains well the differences in decomposition rates. All the results indicate that leaf dynamics and associated nutrient cycling differ significantly between secondary forests and mature forest. This is very important, taking into consideration that it may take more than 120 y for these forests to recover (Aryal et al. Reference ARYAL, DE JONG, OCHOA-GAONA, ESPARZA-OLGUIN and MENDOZA-VEGA2014). This means that the related ecosystem functions also take a long time to re-establish. This has a major impact on conservation and restoration strategies and on estimates of carbon and nitrogen dynamics at the ecosystem level.
ACKNOWLEDGEMENTS
We are grateful for the help of the Ejido members of Cristobal Colon and El Carmen II who let us work in their parcels, and especially to Antonio Ramirez, Demetrio Alvarez, who also helped with the fieldwork. Special thanks to Gabriel Chan, Hugo Ruiz, Natalia Labrín, Elsy Cahuich and Yanin Serrano, without whom the field and laboratory work would not have been accomplished. The paper improved substantially from constructive comments of the editor and an anonymous reviewer. Financial assistance was provided through the collaborative agreement between ECOSUR and the US Forest Service through grant no 12-IJ-112423306-054. The Mexican Council of Science and Technology (CONACyT) provided a scholarship to the first author and ECOSUR provided financial support and infrastructure for field and laboratory work.
Appendix 1. Leaf traits of 61 species of secondary and mature semi-evergreen tropical forests of Calakmul, Campeche, Mexico. LA = leaf area (in cm2); SLA = specific leaf area (in cm2 g−1); C = carbon concentration (in % of leaf mass); N = nitrogen concentration (in % of leaf mass); C:N = ratio between C and N. YS = young secondary forest; MS = medium-aged secondary forest; AS = advanced secondary forest; M = mature forest.

Appendix 2. Parameter values of the three decomposition models. Non-significant results of model 3 are not presented. Decomposition rate constants are based on loss of litter mass. Model 3 was selected when the results were significant for k1 and A, else we used model 2, which always showed significant results of both parameters.
 $${M_t} = {M_0}{e^{\left( { - kt} \right)}} + \ \varepsilon {\rm(1)} $$
  $${M_t} = {M_0}{e^{( - k{t^p})}} + \varepsilon {\rm(2)}$$
  $${M_t} = A.{M_0}{e^{\left( { - {k_1}t} \right)}} + (1 - A){M_0}{e^{({-k_2}t)}} + \varepsilon{\rm(3)}$$

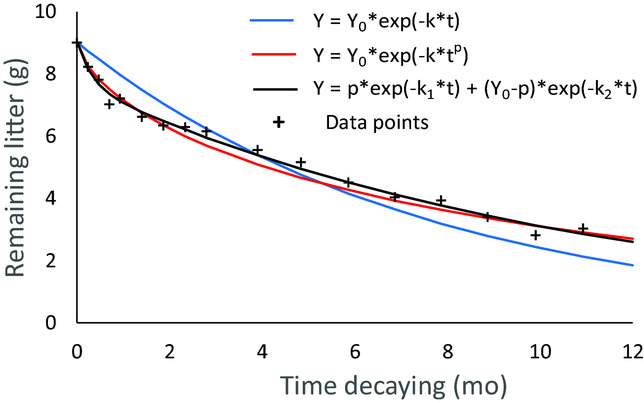
Appendix 3. Example of the results of the three models applied to the decomposition data of the treatment in plot CC02 corresponding to young secondary forest. The figure demonstates the better fit of models 2 and 3, compared with the widely used model 1, which underestimated the initial and overestimated the final decomposition in all cases.
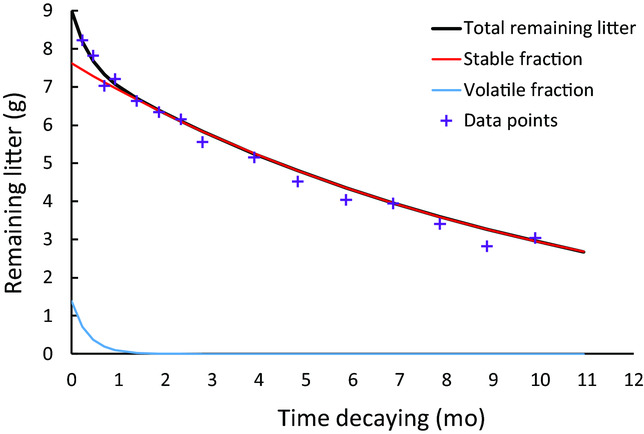
Appendix 4. Decomposition of volatile (blue line) and stable (red line) fraction of leaf litter, plot CC02, applying equation no 3. Note the rapid loss of the volatile fraction (less than 2 mo).


