INTRODUCTION
In tropical phenological research, several factors have been considered as possible causes for flowering. Moisture availability, photoperiodic control and shared pollinators have received particular attention (Borchert et al. Reference BORCHERT, RENNER, CALLE, NAVARRETE, TYE, GAUTIER, SPICHIGER and VONHILDEBRAND2005, Wright & Calderon Reference WRIGHT and CALDERON1995). In seasonal forests of the tropics, phenology is usually strongly correlated with the dry season (Reich & Borchert Reference REICH and BORCHERT1984, Wright & van Schaik Reference WRIGHT and VANSCHAIK1994). For instance, flowering and fruiting of the different tree species are synchronous in seasonal forests of Bolivia (Justiniano & Fredericksen Reference JUSTINIANO and FREDERICKSEN2000) and in Amazonia (Haugaasen & Peres Reference HAUGAASEN and PERES2005). Consequently, the interspecific synchrony should increase with increasing rain fall seasonality. Wolda (Reference WOLDA1988) stated that potential pollinators also seem to react in a more periodical rhythm in seasonal forests than in ever-wet forests. This indicates that the competition for pollinators should increase temporally with increasing rainfall seasonality. In perhumid sites in contrast, selection may favour temporally segregated flowering to minimize interspecific overlap for flowering times and thus competition for limiting pollinators (Wright & Calderon Reference WRIGHT and CALDERON1995). These findings confirm that interspecific synchrony of flowering and fruiting patterns should increase with rain-fall seasonality in tropical montane rain forests.
Unlike the marked temperature-related periodicity in temperate forests, in tropical rain forests phenological dynamics tend to be continuous and become more periodic or even episodic in response to increasing annual drought (Reich Reference REICH1995), decreasing precipitation (Borchert Reference BORCHERT1994, Reich & Borchert Reference REICH and BORCHERT1984, Urrego & del Valle Reference URREGO and DEL VALLE2001), or changes in solar irradiance (Hamann Reference HAMANN2004). As seasonal variation in day length is the only environmental signal that is constant from year to year, photoperiodicity is considered to be in control of the phenological patterns of many tree species in tropical rain forests (Borchert et al. Reference BORCHERT, RENNER, CALLE, NAVARRETE, TYE, GAUTIER, SPICHIGER and VONHILDEBRAND2005, Morellato et al. Reference MORELLATO, TALORA, TAKAHASI, BENCKE, ROMERA and ZIPPARO2000). Day length is of course a function of solar declination (Borchert et al. Reference BORCHERT, RENNER, CALLE, NAVARRETE, TYE, GAUTIER, SPICHIGER and VONHILDEBRAND2005, Renner Reference RENNER2007). Irradiance may also shape flowering patterns (Yeang Reference YEANG2007), but irradiance in turn is mainly a function of solar declination, being attenuated to varying extents in different localities (Zimmerman et al. Reference ZIMMERMAN, WRIGHT, CALDERÓN, APONTE PAGAN and PATON2007). In recent papers on tree phenology, more emphasis is given to the bimodal peaks of insolation in the inner tropics as a consequence of the Earths path around the sun and its tilt, with the sun passing directly over all equatorial localities twice a year. These peaks of maximum insolation coincide with the equinoxes (Borchert et al. Reference BORCHERT, RENNER, CALLE, NAVARRETE, TYE, GAUTIER, SPICHIGER and VONHILDEBRAND2005, Renner Reference RENNER2007).
By monitoring the same tree species at two nearby sites that experience differences in seasonality, we may investigate whether photoperiodic control or climatic factors are the key drivers in the phenology of trees. Accordingly, we presume that flowering will be synchronous between species and sites when photoperiodic control is the only factor which induces flowering. Different flowering patterns for the same species at both sites, in contrast, would indicate climatically driven phenology mechanisms. According to these considerations our study tested two hypotheses: (1) Synchronisation of flowering and fruiting phenology is higher at study sites with pronounced rainfall seasonality compared with sites within perhumid forests. (2) Proximate causes for flowering in closely situated seasonal and perhumid sites are either photoperiodicity or climatic factors.
METHODS
Study areas
The study area is located in the Cordillera Real in southern Ecuador. Within this region we selected two nearby sites situated at the same altitude of 1900–2300 m but with different climate conditions: The San Francisco site (SF, 03°59′–04°00′S, 79°03′–79°05′W), located east of the western Cordillera, is characterized by perhumid conditions throughout the entire year and a mean annual precipitation of 2200 mm, whereas the El Bosque site (EB, 04°16′–4°10′S, 79° 06′–79° 10′), west of the Cordillera, has a more pronounced dry season (Figure 1). The forests at both study sites can be classified as evergreen montane forest (Balslev & Øllgaard Reference BALSLEV, ØLLGAARD, Aguirre, Madsen, Cotton and Balslev2002). The direct distance between the two sites is approximately 30 km. A detailed characterization of the vegetation in the forest of the scientific station Estación Científica San Francisco is given by Bussmann (Reference BUSSMANN2001), Homeier et al. (Reference HOMEIER, DALITZ and BRECKLE2002) and Paulsch (Reference PAULSCH2002). Richter (Reference RICHTER2003) compared locations east (Zamora) and west (Vilcabamba) of the Podocarpus National Park and found that seasonal amplitudes of climate parameters are smaller in the east than in the west. The mean temperature is about 2–3 °C lower in the east.
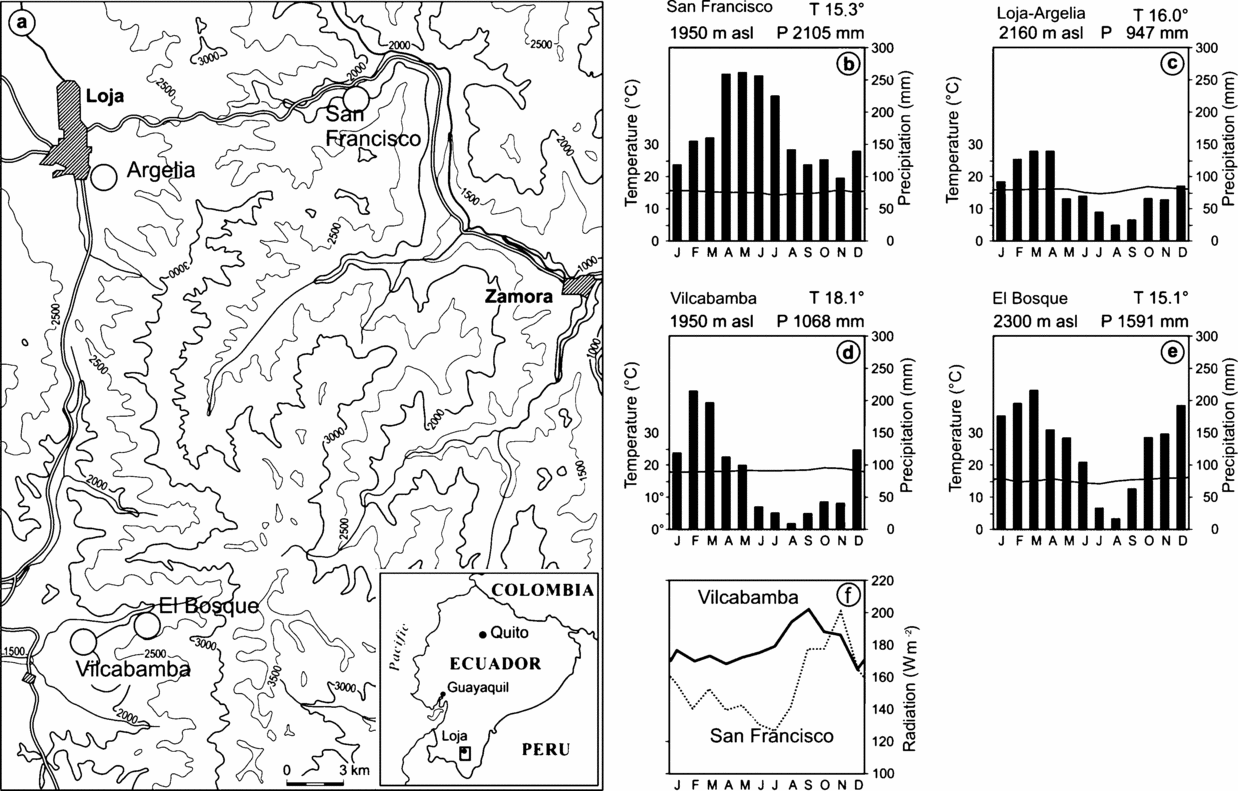
Figure 1. Location of the study sites and climate conditions in the research area (a). The perhumid site San Francisco SF is located east of the western Cordillera, all other sites at the western site are seasonal in rain fall. The phenological observations were conducted at San Francisco (b) and El Bosque (e). Juglans neotropica was studied at Argelia (c). The phenological data from San Francisco were cross-correlated to the respective climate data (T = mean monthly temperature, P = mean annual precipitation), those from El Bosque and Argelia were cross-correlated to the Vilcabamba (d) climate data. Radiation data only were available for the study sites Vilcabamba and San Francisco (f).
Climate
Climate data underlying this paper are derived from digital weather stations (SF, EB and Vilcabamba) detecting wind, soil/air temperature, humidity, rainfall (tipping bucket rain gauge) and solar irradiance. Additional data are from Loja Argelia, a conventional station of the national meteorological service (INAMHI). Figure 1 shows considerable differences in radiation and precipitation between the study sites at SF east and EB, Loja and Vilcabamba west of the western Cordillera. It is notable that the rainfall course at the perhumid site is opposite in phase to those of the seasonal sites. The changes between the drier and the rainy season as well as between periods with higher and lower radiation at SF coincide relatively well with the equinoxes. In comparison, at the seasonal site in the west (Vilcabamba, below EB) these parameters change more gradually and, primarily, the rainfall peak is seasonally displaced. The main dry season (less than 100 mm mo−1) in EB is from June to September, in contrast to SF where in no month is there less than 100 mm precipitation and the main rainy season is from April to July. In SF, the period with maximum radiation is during the driest months from September to November, slightly delayed compared with the maximum input in Vilcabamba (July to November). The reason for these highly differing regional climate features lies in the altitude and the orientation of the mountain chain, which runs from north to south and reaches 3650 m. The mountains block the rainfall promoted by trade winds and superimposing easterlies (tropical mid-tropospheric jet streams) on the wet escarpment, which frequently results in desiccating katabatic (foehn) winds in the west.
Tree species and phenological data
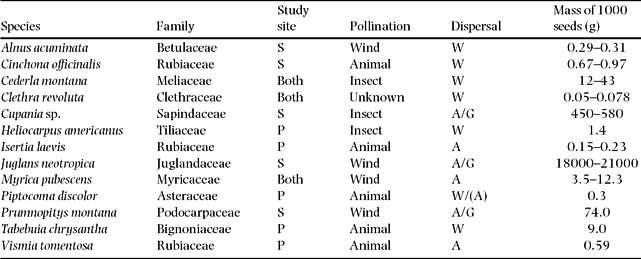
Eight species were studied at SF and eight species at EB. The two sites had three species in common. The 13 selected native species (nomenclature follows Jørgensen & León-Yanéz Reference JØRGENSEN and LEÓN-YÁNEZ1999) represent a broad range of successional stages from early successional to mid-successional species, wind to animal pollination syndromes, small (<1 g per 1000 seeds) to large seed size (>10 kg per 1000 seeds) and wind to animal seed dispersal modes. Table 1 summarizes the ecological characteristics of the studied species.
Table 1. Ecological characteristics of the 13 study species at the two study sites (S = seasonal, P = perhumid or at both sites). Sources for pollination data: Chazdon et al. (Reference CHAZDON, CAREAGA, WEBB and VARGAS2003), Smith et al. (Reference SMITH, MORI, HENDERSON, STEVENSON and HEELD2004), Regal (Reference REGAL1982), Wolff et al. (Reference WOLFF, BRAUN and LIEDE2003). Source for dispersal data: Stimm et al. (Reference STIMM, BECK, GÜNTER, AGUIRRE, CUEVA, MOSANDL, WEBER, Beck, Bendix, Kottke, Makeschin and Mosandl2008). Dispersal mode: W = Wind, A = Animal, G = Gravity.
Juglans neotropica was studied at La Argelia close to Loja (Figure 1b). As this site had the same climatic rhythmicity, the same altitude as well as the same aspect west of the Cordillera, we treated Juglans neotropica together with the other species of El Bosque (Figure 1d). For every species and site, we selected five adult individuals with well-developed crowns, good shape and healthy stems, following the recommendations of Fournier & Charpantier (Reference FOURNIER and CHARPENTIER1975). Data were acquired from the forest floor using binoculars, recording the intensity of the flowering and fruiting of each tree at 2-wk intervals using a percentage scale (100% = maximum density of flowers or fruit recorded during the observation period). Flowering was recorded as completely developed and open inflorescences; fruiting was defined as presence of mature fruit. In total, 80 trees were observed over a period of 2.5 y from 31 May 2001 until 6 January 2004 with an overlap period of 2 y at the two study sites. All trees were monitored at 2-wk intervals from 31 May 2001 to 20 July 2003 at SF, and from 8 July 2001 to 6 January 2004 at EB.
Data analysis
In order to detect possible interspecific synchronization of phenophases at each site (hypothesis 1), we conducted a time series analysis with SPSS 12.00. For the calculation of the cross-correlation, the time lag was predefined as zero. The analogy to the Bonferroni method of correcting errors which occur for multiple comparison of means (Rice Reference RICE1989) is the Portmanteau test for time-series analysis (Legendre & Fortin Reference LEGENDRE and FORTIN1989). For this study we applied the corresponding statistic, which is implemented in the program SPSS (Wong & Ling Reference WONG and LING2003).
For the comparison of the phenological chronosequences with the meteorological data and the solar declination (hypothesis 2) an additional time-series analysis was carried out. The maximum cross-correlation coefficients for a time span of 12 mo backwards and in advance are presented together with the respective time-lags. A prerequisite for cross-correlation analysis is that all analysed time parameters have the same dimensions. Therefore, all phenological and climatological data were transformed to monthly values. According to Borchert et al. (Reference BORCHERT, RENNER, CALLE, NAVARRETE, TYE, GAUTIER, SPICHIGER and VONHILDEBRAND2005), we used the open source program of Lammi (www.geocities.com/jjlammi) for the calculation of solar declination. Declination is defined as the position of the sun at noon (solar time) north and south of the celestial equator (measured in degrees). When the sun appears north of the celestial equator it has a positive declination, in the south it has a negative declination. The declination equals 0 during the equinoxes. For testing the hypothesis that the initiation of flowering is more frequent during the months around the equinoxes than on average over the whole year, we conducted a t-test for heteroscedastic samples. The following formula was used for the calculation of the weighted mean flowering initiations per year and tree (fiyear) during the defined periodic time slot e-b:
where, e−b = the duration of the time slot (d), e = the end of the time slot within the year (fixed date), b = the begin of the time slot within the year (fixed date). n = the number of sample trees, fi = Number of all flowering initiations for the sample tree i within all time slots during the observation period.
RESULTS
Synchronization of phenological patterns (hypothesis 1)
As shown in Figure 1, the SF site is humid throughout the year, with monthly precipitation not falling below 100 mm. Radiation is negatively correlated to the precipitation, which indicates a strong influence of cloudiness. At the perhumid site, flowering (Figure 2a) and fruiting (Figure 2b) occur throughout the year. The main flowering peak as an average of all individuals and species is in the rainy season from February to May and maximum fruiting occurs during the drier season from September to December. The seasonality of phenophases at the plant-community level is low. However, on the species level, the phenological behaviour is annual for seven of the eight study species. The species of the perhumid site can be arranged into four different groups with temporally segregated phenophases (Figure 3). Clethra revoluta, Heliocarpus americanus and Isertia laevis are typical pioneer species, which flower significantly synchronously during the main rainy season and fruit significantly synchronously during the drier season (Table 2). The phenophases of Piptocoma discolor and Tabebuia chrysantha, in contrast, are negatively correlated to the Clethra-Heliocarpus-Isertia group (significant only for Piptocoma). These species bloom during the drier season with culmination in August and September, and fruiting between August and February. Cedrela montana and Vismia tomentosa are the first species in the year to cease flowering and commence fruiting significantly synchronously. Fruiting occurs during the rainy season for Cedrela montana and Vismia tomentosa. Myrica pubescens shows supra-annual phenophases with one peak in October and another about 6 mo later in May. The fruiting period is relatively long.
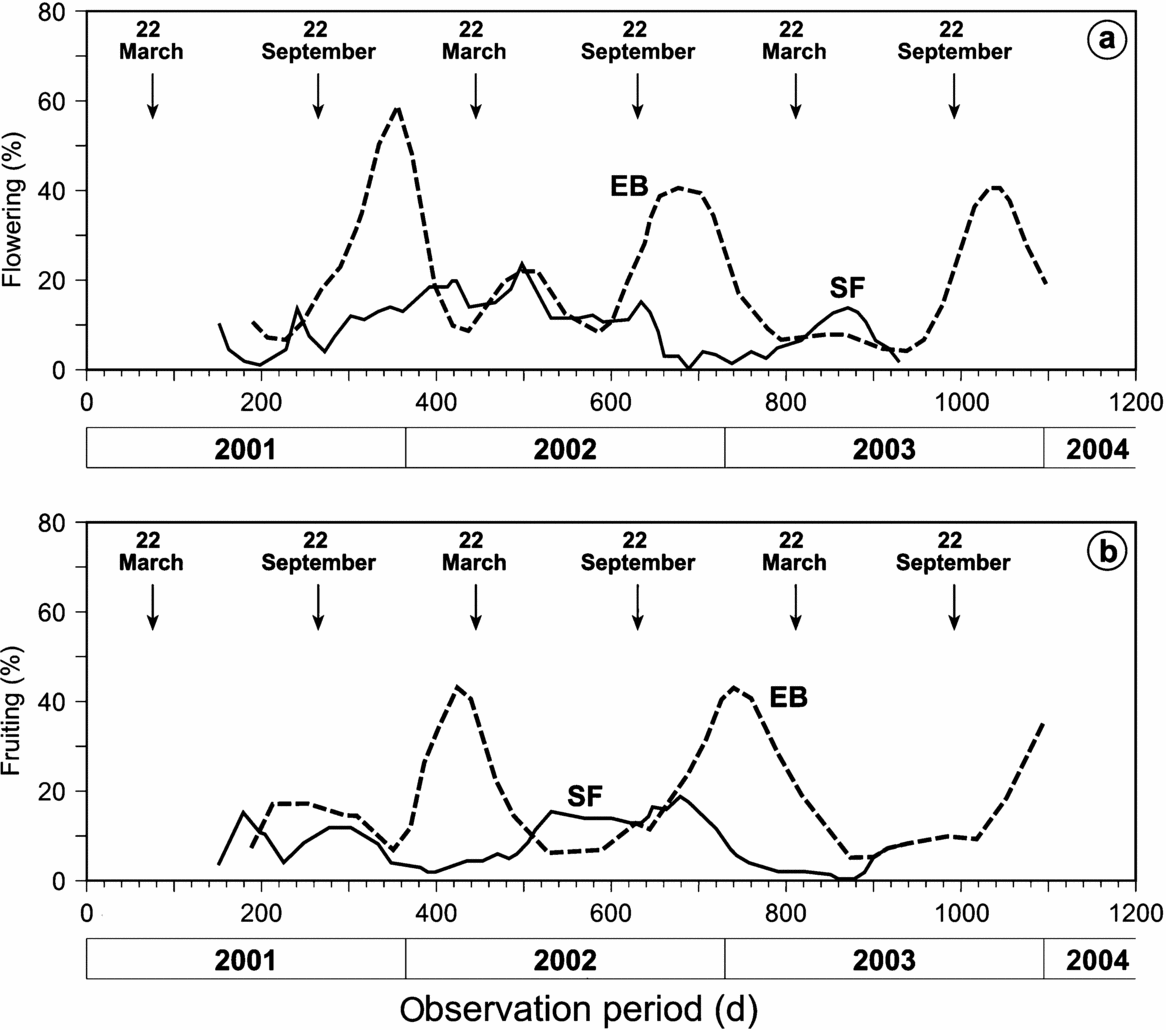
Figure 2. Mean flowering (a) and fruiting (b) intensity of all individuals (n = 40 per site) of the studied species in the seasonal site El Bosque (broken lines) and the perhumid site San Francisco (solid lines). The arrows represent the Spring and Autumn equinoxes.
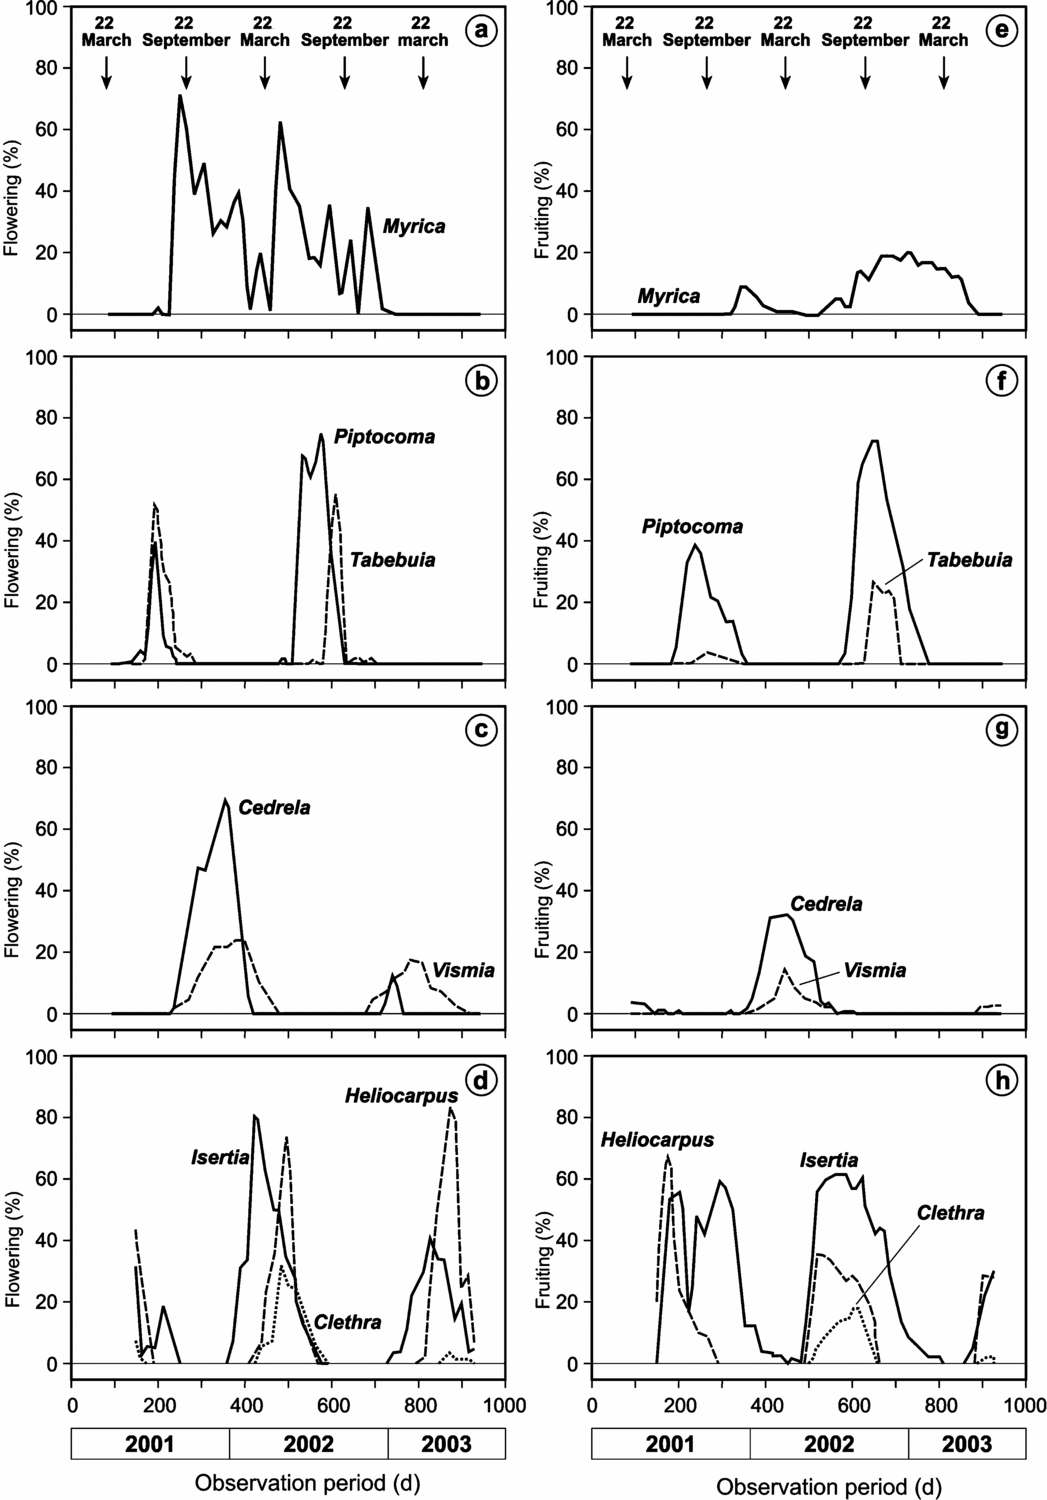
Figure 3. Flowering (a–d) and fruiting intensity (e–h) of Myrica pubescens, Piptocoma discolor, Tabebuia chrysantha, Cedrela montana, Vismia tomentosa, Heliocarpus americanus, Isertia laevis, Clethra revoluta (top to bottom) in the perhumid site San Francisco from 1 January 2001. The arrows represent the spring and autumn equinoxes.
Table 2. Synchronization of phenological patterns in the perhumid forest San Francisco. Moving correlation coefficients of flowering patterns are shown above the diagonal, those for fruiting below. The moving correlation coefficients were calculated for time lag = 0. Values with asterisks are significant at the level P < 0.05.

The dry season in El Bosque (EB) is pronounced (Figure 1). Interestingly, the radiation is only negatively correlated to the precipitation from October to December, with the maximum values measured shortly after the autumn equinox. At the closest meteorological station in Vilcabamba (c. 5 km distance), mean monthly precipitation exceeds 100 mm only during February to April. In general, the percentages for flowering and fruiting are much higher in EB than in SF (Figure 2). Flowering percentages are very high for all species except for Clethra revoluta. Most of the species reach culmination in fruiting between February and April and cease between May and November. The fruiting percentages are very high here as well. However, a few species show different patterns from the main flowering and fruiting seasons, providing pollen and fruit during times when general offer is low (Table 3). For instance, Cupania sp. shows significant contrasting behaviour to the major group, with fruiting culminating between July and October while the fruit production of the other species is at its minimum. The two supra-annual species, Myrica pubescens and Cinchona officinalis, are the only species that flower and fruit throughout almost the entire year (Figure 4), being interrupted only by a very short period of reduced flowering in March. It can be assumed that in contrast to the perhumid site, the seasonality of both flowering and fruiting is very high and the temporal segregation is very low for all species with few exceptions.
Table 3. Synchronization of phenological patterns in the seasonal forest El Bosque. Moving correlation coefficients of flowering patterns are shown above the diagonal, those for fruiting below. The moving correlation coefficients were calculated for time lag = 0. Values with asterisks are significant at the level P < 0.05.

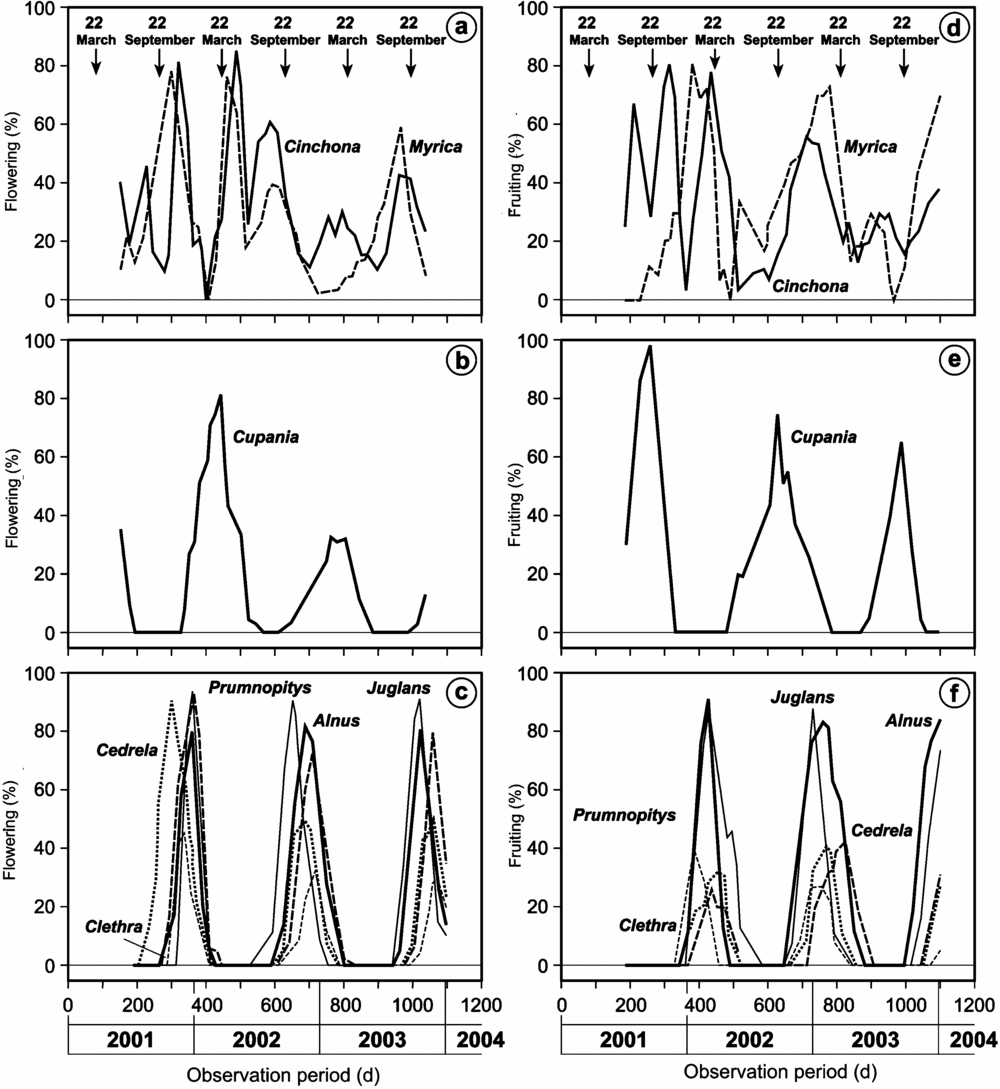
Figure 4. Flowering (a–c) and fruiting (d–f) intensity of Cinchona oficinalis, Myrica pubescens, Cupania sp., Prumnopitys montana, Juglans neotropica, Alnus acuminata, Cedrela montana, Clethra revoluta (top to bottom) in the seasonal site El Bosque from 1 January 2001. The arrows represent the spring and autumn equinoxes.
Climate or photoperiodic control as possible proximate causes (hypothesis 2)
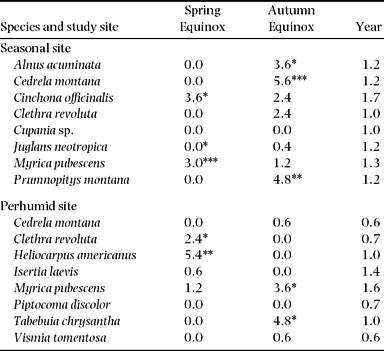
For 8 of 13 species, the initiation of flowering occurs more frequently during the equinoxes (± 30 d) than at an average during the rest of the year (Table 4). A very high frequency for these periods was shown by Cedrela montana, Heliocarpus americanus, Tabebuia chrysantha and Prumnopitys montana. It is notable that some species flower with a higher frequency during the spring equinox and others during the autumn equinox. Of the three species in common to both sites, Cedrela montana is the only one which initiated flowering at the same equinox at both study sites. Myrica and Clethra have preferences for different equinoxes in the two study sites. More individuals of Myrica pubescens initiated flowering around the autumn equinox in San Francisco and around the spring equinox in El Bosque Clethra revoluta showed contrasting patterns, with flowering beginning around the spring equinox in SF and around the autumn equinox in EB.
Table 4. Weighted mean flowering initiations per year and tree during the period around the spring equinox (22 March ± 30 d) and the autumn equinox (22 September ± 30 d) in comparison with the whole year (n = 5 for each species and study site). Due to different time spans of the equinoxes (60 d) and the year (365 d), the number of flowering events during the equinoxes were weighted to annual values. Significant differences between equinox and annual values are indicated by asterisks.
There is evidence that drier and humid seasons at SF change during the equinoxes, along with high and low radiation phases (Figure 5). This is in contrast to the EB site, where these parameters are not in antiphase to each other and have a different rhythm during the year. The cross-correlation coefficients and respective time lags (mo, in parentheses) for declination and precipitation confirm this finding (Tables 5 and 6), amounting to −0.531 (5) in EB and −0.560 (0) in SF. The cross-correlation coefficients for the declination and radiation are −0.503 (−3) and −0.530 (7), respectively. Thus, precipitation in EB and SF are 5 mo out of phase and radiation 2 mo, as presented in Figure 1.
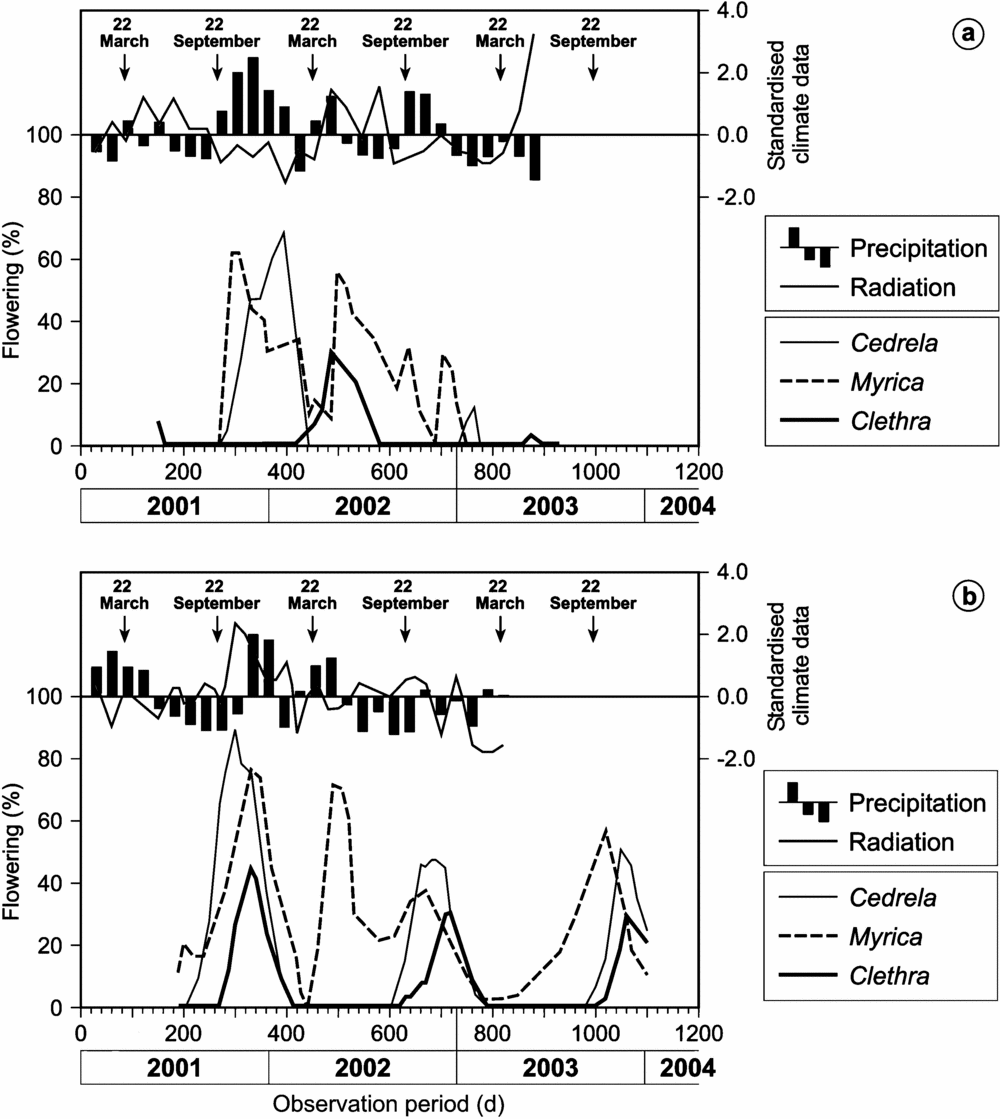
Figure 5. Flowering intensity of the three tree species in common (lower x-axis with days from 1 January 2001) at the perhumid site San Francisco (a) and the seasonal site El Bosque (b) in relationship to radiation and precipitation (upper x-axis with standardized climate data). The arrows represent the spring and autumn equinoxes.
Table 5. The highest cross-correlation coefficients and respective time-lags (in parentheses) between phenophases (Flower = Flowering, Fruit = Fruiting) of species in common at both study sites (Cedrela montana, Clethra revoluta and Myrica pubescens) and meteorological parameters in the seasonal study site El Bosque. Significant values at P < 0.05 are indicated by asterisks.

Table 6. The highest cross-correlation coefficients and respective time-lags (in parentheses) between phenophases (Flower = Flowering, Fruit = Fruiting) of species in common at both study sites (Cedrela montana, Clethra revoluta and Myrica pubescens) and meteorological parameters in the perhumid study site San Francisco. Significant values at P < 0.05 are indicated by asterisks.

The only factor which is correlated significantly with the flowering patterns of Myrica at both study sites and without time-lag is radiation. The flowering of Clethra correlates significantly with several factors. For instance, the declination showed no phase displacement but the correlation is positive in EB and negative in SF. Furthermore, the radiation and the temperature phases are several months displaced with the flowering phases, but the cross-correlation coefficients between precipitation in EB and SF have opposite signs. This corresponds to an arithmetic phase displacement of 6 mo for annual periodic patterns. As a time lag of 6 mo corresponds arithmetically to a change of the correlation coefficient's algebraic sign, the precipitation is the most related factor to induce flowering of Clethra revoluta. Despite the contrasting climate patterns at the two study sites, the flowering patterns of Cedrela are almost synchronized at both sites, which is indicated by their arithmetically different time lags and different algebraic signs (Table 5 and 6). This is denoted by the cross-correlation coefficients between flowering and declination at both sites.
DISCUSSION
Seasonality and interspecific synchronization of phenological patterns (hypothesis 1)
Some species in this study flower during the drier season and fruit at the beginning of or during the rainy season. This phenological behaviour for tropical trees has been confirmed by many authors: Bach (Reference BACH2002) for Australia, Grombone Guaratini & Rodriguez (Reference GROMBONE GUARATINI and RODRIGUEZ2002) for south-eastern Brazil, Homeier (Reference HOMEIER2004) for the San Francisco area, Krishnan (Reference KRISHNAN2002) for India and Sun et al. (Reference SUN, KAPLIN, KRISTENSEN, MUNYALIGOGA, MVUKIYUMWAMI, KAJONDO, MOERMOND and KA-KAJONDO1996) for Rwanda. Knowles & Parrotta (Reference KNOWLES and PARROTTA1995) found that most zoochoric species fruit during wet seasons and most anemochoric species fruit in the dry season in Trombetas, Pará State, Brazil. However, this cannot explain why fruiting percentages of wind-dispersed species like Alnus acuminata or Piptocoma discolor are higher during or at the beginning of the rainy season. This observed pattern could be advantageous for wind-pollinated species, as it would result in seed set during the rainy season allowing for better germination and survival conditions for the young seedlings.
However, as Bawa et al. (Reference BAWA, KANG and GRAYUM2003) described for La Selva, Costa Rica, and Ramirez (Reference RAMIREZ2002) for the central plain of Venezuela, there are also some species which flower during the rainy season or in the transition period between the wet and the dry season (Van Dulmen et al. Reference VAN DULMEN, LINSENMAIR, DAVIS, FIALA and SPEIGHT2001 for eastern Colombia). These patterns could also be observed for Clethra revoluta, Heliocarpus americanus and Isertia laevis at the San Francisco site. Rain fall seasonality can shape phenological patterns (Reich & Borchert Reference REICH and BORCHERT1984, Wright & van Schaik Reference WRIGHT and VANSCHAIK1994). Wright & Calderon (Reference WRIGHT and CALDERON1995) subsume these findings as the water-stress hypothesis. However, it is well established that biological interactions and phylogenetic relations have great influence on phenology too. For instance, competition for pollination or pollinator attraction (Hamann Reference HAMANN2004), competition for seed dispersers, avoidance of herbivory or fruit and pollination syndromes (Castro-Díez et al. Reference CASTRO-DIEZ, MONTSERRAT-MARTI and CORNELISSEN2003, Lobo et al. Reference LOBO, QUESADA, STONER, FUCHS, HERRERÍAS-DIEGO, ROJAS and SABORÍO2003, Mitani Reference MITANI1999, Sun et al. Reference SUN, KAPLIN, KRISTENSEN, MUNYALIGOGA, MVUKIYUMWAMI, KAJONDO, MOERMOND and KA-KAJONDO1996) can lead to temporally segregated phenophases. This phenomenon is described as shared-pollinator hypothesis (Wright & Calderon Reference WRIGHT and CALDERON1995). We argue that the low synchrony of phenological patterns in San Francisco tends to support the shared-pollinator hypothesis, while the observed synchronized patterns in the seasonal El Bosque site support the water-stress hypothesis. Thus, hypothesis 1 of our study has to be accepted. Temporary redundancy is one of four ecological attributes for the identification of keystone species (Peres Reference PERES2000). Anderson et al. (Reference ANDERSON, NORDHEIM, MOERMOND, GONE BI and BOESCH2005) confirm that unusual fruiting patterns of single species contribute to fruit abundance during periods of community-wide fruit scarcity. Thus, the contrasting phenology of Cupania sp. (and to a lesser extent the supra-annual species Cinchona officinalis and Myrica pubescens) and the other species of the seasonal site could possibly be an effect of ecological niche building.
Comparison of phenophases at the two sites and possible proximate causes (hypothesis 2)
There have only been a few studies in the tropics that compared the phenological behaviour of the same species at different sites, although the comparison of phenology within and among forests can contribute to a better understanding of phenological diversity (Sakai Reference SAKAI2001). Environmental factors are usually thought to function as external cues for organisms to time their reproduction (Hamann Reference HAMANN2004). If it were solely photoperiodic control that induces flowering, the timing at the species level should be identical in time and space and should occur mainly around the equinoxes (Borchert et al. Reference BORCHERT, RENNER, CALLE, NAVARRETE, TYE, GAUTIER, SPICHIGER and VONHILDEBRAND2005). Asynchronous flowering during all years and sites would tend to indicate climatic factors as the triggering signal.
An argument for photoperiodic control is the observed bimodal shape of flowering peaks for all species together in EB (Figure 2). Additionally, the flowering initiation for many species around the equinoxes (Figure 5, Table 5), i.e. when day-length changes are fastest supports this hypothesis. Some authors did not find intraspecific differences in phenology when comparing sites in Latin America with different ecological conditions (Van Dulmen et al. Reference VAN DULMEN, LINSENMAIR, DAVIS, FIALA and SPEIGHT2001 for Amazonia in Colombia; Lobo et al. Reference LOBO, QUESADA, STONER, FUCHS, HERRERÍAS-DIEGO, ROJAS and SABORÍO2003 for sites in Costa Rica and Mexico) as we did for Cedrela and Myrica pubescens. These species show relatively high temporal and spatial synchrony, in contrast to Clethra which showed only high temporal synchrony and the clear preference for flowering during the equinoxes, although not during the same equinoxes at both sites. Therefore, the same photoperiodic signal cannot be the driver for flowering of Clethra at both sites. The significant correlation with precipitation regimes supports the idea that rainfall-related factors initiate flowering of Clethra revoluta. The statistical analysis also revealed that flowering of Myrica pubescens is triggered by radiation. Only the flowering patterns of Cedrela montana showed significant correlation with solar declination at both sites, which makes photoperiodic control the most probable triggering factor. The reduced values for mean flowering initiations per year and tree (Table 4) of Cedrela in San Francisco can possibly be attributed to external factors that impeded the full development of flowers in the year 2002. Thus, there is evidence that photoperiodic control, as well as climatic factors, is a phenological driver at each of the study sites. Hypothesis 2 must therefore be rejected.
Wright & van Schaik (Reference WRIGHT and VANSCHAIK1994) stress that maximum seasonal irradiance may induce production of leaves and flowers. They mention changes in cloud cover, day length and solar angle as causes for seasonal variation. Borchert (Reference BORCHERT1983) found that in seasonally dry ecosystems, increased light intensity can result in a temporal water deficit in branch tips, which could in turn enhance bud development. Nomura & Kikuzawa (Reference NOMURA and KIKUZAWA2003), however, suggest that under the very wet conditions of montane forests, this theory may not be applicable. Bendix et al. (Reference BENDIX, ROLLENBECK, GÖTTLICHER and CERMAK2006b) mention different cloudiness regimes for the study areas, accenting a clear division of cloud patterns between the west and the east sides of the western Cordillera chain. We suppose that rainfall and cloudiness can interfere with the equinox signal for flowering in the study areas. Possibly the very frequent cloud cover in San Francisco could attenuate the flowering signals of day length or radiation over the entire year, although in the seasonal site, cloudiness interferes mainly during the rainy season which coincides only with the equinox in March but not in October. This is also confirmed by Bendix et al. (Reference BENDIX, HOMEIER, CUEVA ORTIZ, EMCK, BRECKLE, RICHTER and BECK2006a) and Cueva Ortiz et al. (Reference CUEVA ORTIZ, HOMEIER, BRECKLE, BENDIX, EMCK, RICHTER and BECK2006) These phenomena may be supported by Renner (Reference RENNER2007) and Yeang (Reference YEANG2007), who state that radiation, precipitation and solar declination are closely linked in the tropics. Our findings confirm these results, indicating that a multiple theory approach would allow for better prediction of tree phenology in the tropics rather than a single theory.
We suggest that long-term studies or the application of experimental approaches could help to separate the different signals from each other. The presence of multiple triggering factors in one ecosystem, and the fact that rainfall regimes and radiation are extremely varied within short distances (Bendix Reference BENDIX2004, Richter Reference RICHTER2003) contributes to the coexistence of organisms with different key drivers for phenophase induction. This, in turn, can partly explain the extraordinary biodiversity of the ecosystems in the southern Ecuadorian Andes.
ACKNOWLEDGEMENTS
Thanks go to Nature and Culture International and Joy Horton from Colinas Verdes for infrastructure and logistic support in ‘El Bosque’. We are grateful to Dr Paul Emck and Thorsten Peters for providing climate data. The authors thank the Minsterio del Ambiente del Ecuador for the research permit and finally the German Research Community DFG for the financing.


