INTRODUCTION
Species richness and species turnover along environmental gradients are key topics in community ecology and biogeography (Terborgh Reference TERBORGH1971, Whittaker & Niering Reference WHITTAKER and NIERING1965). For example, edaphic conditions, microclimate and species interactions structure vegetation composition at the local scale (Blundo et al. Reference BLUNDO, MALIZIA, BLAKE and BROWN2012). These factors often change rapidly along altitudinal gradients. Therefore, montane ecosystems constitute an excellent natural laboratory to investigate the influence of environmental gradients on species assemblages (Muenchow et al. Reference MUENCHOW, BRENNING and RICHTER2012). The importance of these factors naturally depends on the climatic, geologic, topographic and historical setting of an ecosystem (Blundo et al. Reference BLUNDO, MALIZIA, BLAKE and BROWN2012). For instance, soil conditions govern the composition of tropical rain forests (Tuomisto et al. Reference TUOMISTO, POULSEN, RUOKOLAINEN, MORAN, QUINTANA, CELI and CANAS2003). To a lesser extent, edaphic conditions also play a role in montane and tropical dry forests (Peña-Claros et al. Reference PEÑA-CLAROS, POORTER, ALARCON, BLATE, CHOQUE, FREDERICKSEN, JUSTINIANO, LEANO, LICONA, PARIONA, PUTZ, QUEVEDO and TOLEDO2012, Soethe et al. Reference SOETHE, LEHMANN and ENGELS2008). Climate is probably more important in structuring vegetation in wet montane forests (Ashton Reference ASHTON2003, Beck et al. Reference BECK, BENDIX, KOTTKE, MAKESCHIN and MOSANDL2008), and water availability primarily determines tropical dry forest communities (Espinosa et al. Reference ESPINOSA, CABRERA, LUZURIAGA and ESCUDERO2011, Muenchow et al. Reference MUENCHOW, FEILHAUER, BRÄUNING, RODRÍGUEZ, BAYER, RODRÍGUEZ and VON WEHRDEN2013a).
Arid to semi-arid ecosystems compose large parts of the tropics, yet tropical research primarily focuses on more humid ecosystems. In South America, a large body of literature is available for the Andes and the Amazonian lowlands (Pitman et al. Reference PITMAN, WIDMER, JENKINS, STOCKS, SEALES, PANIAGUA and BRUNA2011). The dry western coastal areas of South America, however, remain largely neglected (Espinosa et al. Reference ESPINOSA, CABRERA, LUZURIAGA and ESCUDERO2011). Different El Niño Southern Oscillation (ENSO) phases bring occasionally rainfall and higher fog intensities (Dillon & Rundel Reference DILLON, RUNDEL and Glynn1990, Muenchow et al. Reference MUENCHOW, BRÄUNING, RODRÍGUEZ and VON WEHRDEN2013b). Within this setting, coastal mountains represent islands of vegetation that contrast with the barren desert (Dillon et al. Reference DILLON, NAKAZAWA, LEIVA, Haas and Dillon2003, Schulz et al. Reference SCHULZ, ACEITUNO and RICHTER2011). The fog-dependent vegetation formation found on these mountains is locally termed lomas (Dillon et al. Reference DILLON, NAKAZAWA, LEIVA, Haas and Dillon2003; Figure 1). Fog deposition is a crucial driver of diversity in many tropical coastal and mountainous ecosystems by increasing hydrological and chemical input (González et al. Reference GONZÁLEZ, FARINA, PINTO, PEREZ, WEATHERS, ARMESTO and MARQUET2011, Liu et al. Reference LIU, MENG, ZHANG, LIU and LI2004, Rollenbeck et al. Reference ROLLENBECK, BENDIX and FABIAN2011).

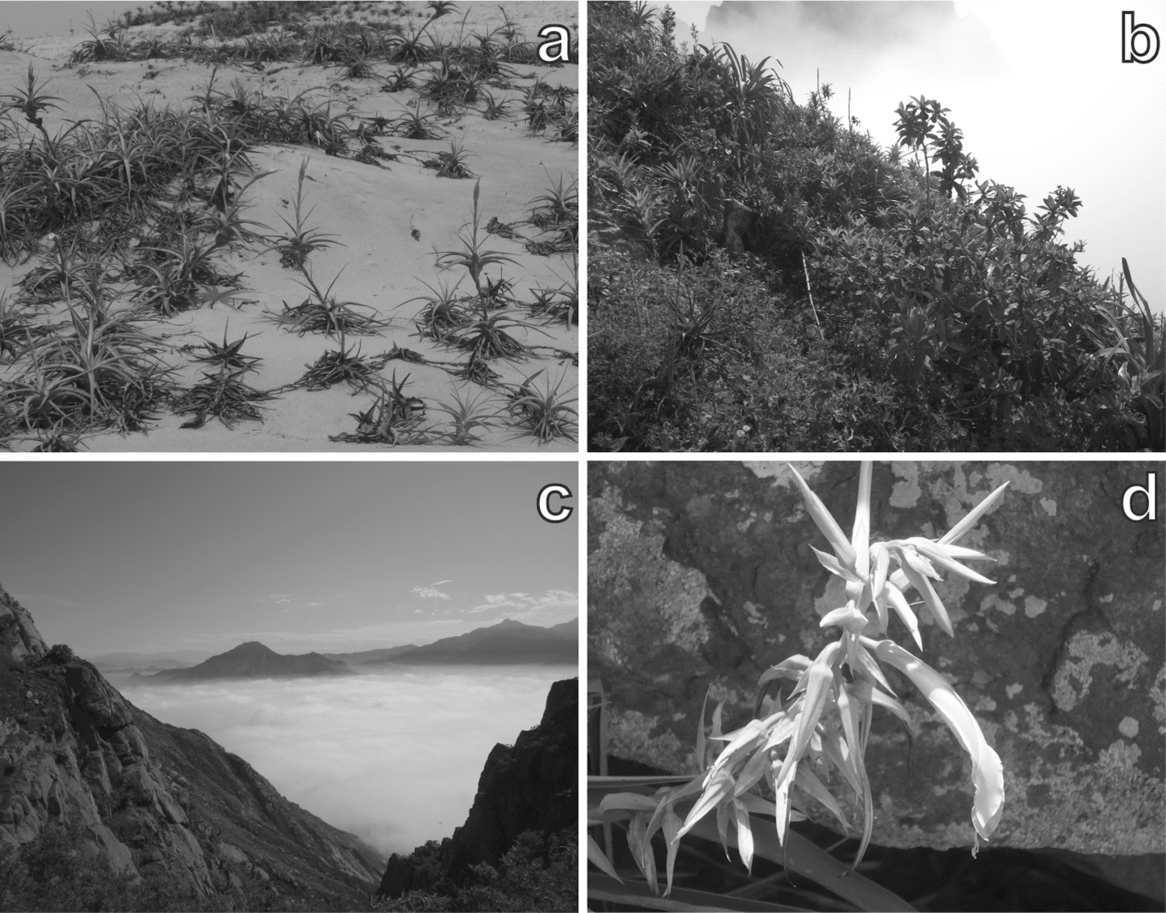
Figure 1. Photos from the study mountain, Mount Campana. Tillandsia species residing in sandy habitat (a). Characteristic vegetation structure of a plot (657 m asl) located in the bromeliad belt (b). The temperature inversion at c. 700 m asl photographed from Mount Campana (c). Pitcairnia lopezii (Bromeliaceae) – a species endemic to Mount Campana (d).
Although numerous studies have revealed a relationship between altitude and species composition, only one study on fog oases considered topographical and remotely sensed variables to explain species richness (Muenchow et al. Reference MUENCHOW, BRÄUNING, RODRÍGUEZ and VON WEHRDEN2013b). Secondly, soil properties are well known to structure vegetation composition in tropical ecosystems such as rain forests (Laurance et al. Reference LAURANCE, LAURANCE, ANDRADE, FEARNSIDE, HARMS, VICENTINI and LUIZAO2010), montane forests (Soethe et al. Reference SOETHE, LEHMANN and ENGELS2008), tropical dry forests (Peña-Claros et al. Reference PEÑA-CLAROS, POORTER, ALARCON, BLATE, CHOQUE, FREDERICKSEN, JUSTINIANO, LEANO, LICONA, PARIONA, PUTZ, QUEVEDO and TOLEDO2012) and savannas (Sarmiento et al. Reference SARMIENTO, SILVA, NARANJO and PINILLOS2006). Although water is the main limiting factor in dry ecosystems, nutrients are sometimes equally important in structuring vegetation (Ronnenberg & Wesche Reference RONNENBERG and WESCHE2011). Yet, the effects of soil properties on the floristic composition of fog oases are still uninvestigated.
Accordingly, we hypothesized that: (1) the floristic composition follows the altitudinal gradient of a Peruvian fog oasis in a non-linear fashion due to different fog moisture levels; (2) edaphic variables explain as much of the vegetation composition as topographic variables, because both sets of variables are likely to follow the humidity–altitude gradient.
METHODS
Study area
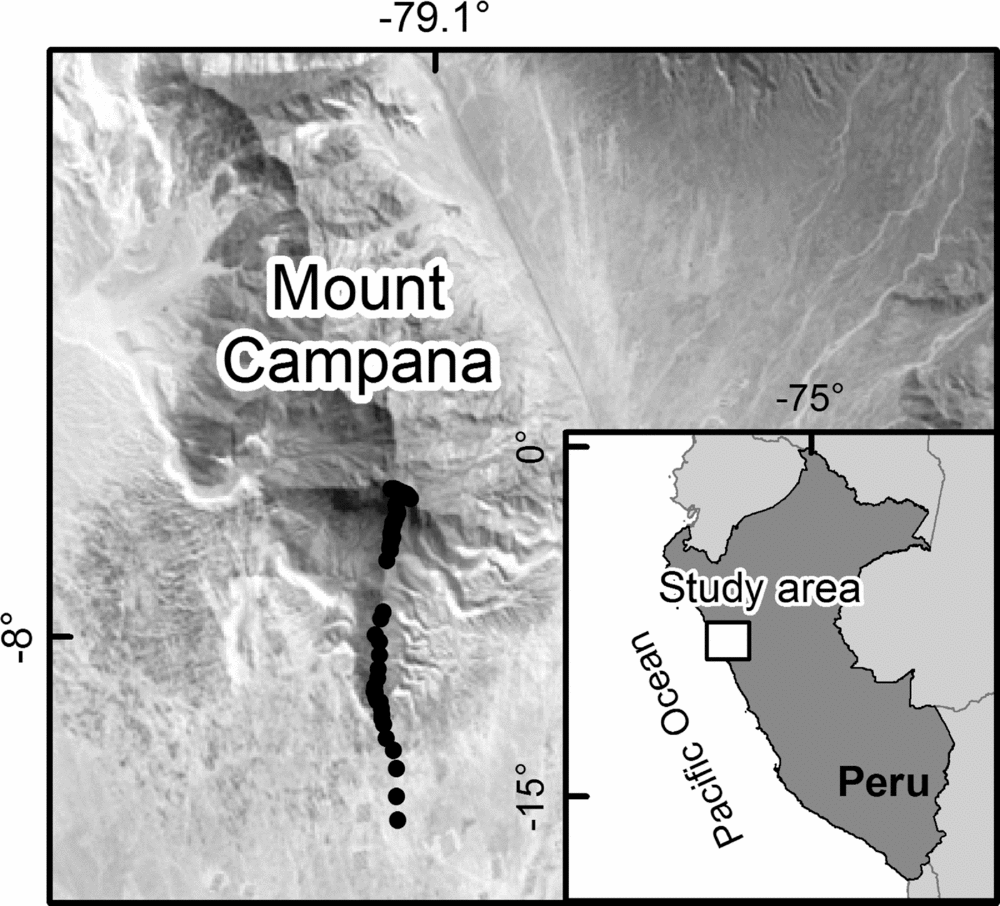
The study area, Mount Campana, is located in North Peru close to Trujillo (Figure 2). The mountain is mainly composed of granitic material (Rodríguez Reference RODRÍGUEZ1996) forming steep slopes and delivering sharp-edged weathering products. Sand-transporting trade winds accumulate dune fields at the base of the southern slope. Cattle trampling is clearly evident on the slopes. Other human activities include litter pollution in the course of the expansion of the city of Trujillo, burning and removal of vegetation, particularly Tillandsia (Figure 1a) as well as woody species. Annual precipitation varies between 7 and 150 mm y−1 along the studied transect (Sagástegui et al. Reference SAGÁSTEGUI, MOSTACERO and LOPEZ1988) and is restricted to the austral winter months (July–October). Additionally, ENSO causes climate variability. During the austral winter, fog precipitation is common and increases the water availability for plants. In addition, El Niño and La Niña increase water availability on a regular basis (Dillon & Rundel Reference DILLON, RUNDEL and Glynn1990, Muenchow et al. Reference MUENCHOW, BRÄUNING, RODRÍGUEZ and VON WEHRDEN2013b). To date, 230 plant species (168 phanerogams, 62 cryptogams) have been recorded on Mount Campana (Sagástegui et al. Reference SAGÁSTEGUI, MOSTACERO and LOPEZ1988), making this the most diverse fog oasis along the western coast of South America (Dillon & Rundel Reference DILLON, RUNDEL and Glynn1990, Rundel & Dillon Reference RUNDEL and DILLON1998).

Figure 2. Landsat image (path: 9; row: 66; acquisition date: 27 September 1987; derived from: https://lpdaac.usgs.gov/) showing the study area. Black dots represent sampling units along the altitudinal transect in the study area on Mount Campana.
Vegetation sampling, soil analysis and variable assessment
Vegetation was sampled along an altitudinal transect (200–950 m asl) on the fog-exposed, southern slope of Mount Campana. Plots of 4 × 4 m (Figure 1b) were aligned at intervals of 15 m altitudinal difference. In accordance with two reconnaissance surveys we intensified the sampling frequency in the main vegetation belt (545–770 m asl) by reducing the interval to 7.5 m altitude difference reaching a plot total of 66. The vegetation survey was carried out during the flowering period of an exceptional La Niña year (September 2011; http://www.cpc.ncep.noaa.gov/products/analysis_monitoring/ensostuff/ensoyears.shtml). We recorded the percentage cover of all vascular plant species at each site. Nomenclature follows the Missouri Botanical Garden Tropicos online database (http://www.tropicos.org/).
Bulk soil samples were collected between 15 and 30 cm depth in each plot. The fine-earth fraction was calculated as the relative percentage by weight of material <2 mm in diameter and skeletal content. Soil pH was measured in a solution of 5 g soil to 12.5 ml CaCl2, and electrical conductivity in a solution of 5 g soil to 25 ml distilled water. Carbonate and nitrogen concentrations were analysed according to Schlichting et al. Reference SCHLICHTING, BLUME and STAHR(1995) via a LecoTrueSpec C/N-analyser. Sand fractions were obtained by sieving after dispersion. The remaining silt and clay contents were analysed in a micrometrics SediGraph 5120. Beforehand, organic matter was destroyed if exceeding 5% mass volume by 10% H2O2 solution, and the electrical conductivity reduced to less than 50 μS by repeated washing in distilled water. Water-soluble P was measured according to Page et al. Reference PAGE, BLACK, MILLER and KLUTE(1982) using a spectrophotometer (DR 5000 UV-VIS; Schlichting et al. Reference SCHLICHTING, BLUME and STAHR1995). Exchangeable cations (Ca, Mg, K and Na) were extracted with NH4Cl, and further analysed by atomic absorption spectrometry (Thermo AAS-Spectrometer SOLAAR M6). To meet assumptions of normality, we log-transformed electrical conductivity, organic matter as well as the root content and took the square root of phosphorus concentration.
Altitude was extracted from a digital elevation model (ASTER GDEM, derived from: https://lpdaac.usgs.gov/). The Normalized Differenced Vegetation Index (NDVI) was calculated from a Landsat scene (path: 9; row: 66; acquisition date: 27 September 1987; derived from: https://lpdaac.usgs.gov/).
Statistical analyses
Biodiversity of vascular plants was determined by Whittaker's three diversity measures (Whittaker Reference WHITTAKER1972): alpha diversity is the species number per plot, gamma diversity is the total species number over all plots and beta diversity is the ratio of gamma diversity and mean alpha diversity minus one. Moreover, we performed a Detrended Correspondence Analysis (DCA; Hill & Gauch Reference HILL and GAUCH1980) on the presence–absence matrix of species. Calculating the length of the first axis in standard deviations, we obtained a second measure of beta diversity. A length of four standard deviations corresponds to a complete species turnover.
To identify the change of the floristic composition along the altitudinal gradient (hypothesis 1), we applied the rank-based, non-metric multidimensional scaling (NMDS). NMDS aims to reduce the difference between the distances of the original matrix and its counterparts found in ordination space. This difference is expressed as stress. Low stress values (<15) indicate a good fit (Kruskal Reference KRUSKAL1964). Another measure of fit is the coefficient of determination between the distances of the original species dataset and the distances of the synthetic ordinal dataset. We used the Bray–Curtis distance of our species table and a random starting configuration to initialize the ordination. Post hoc, soil variables significant in accordance with our modelling were fitted into the ordination space.
We employed model-based clustering to quantify the vegetation belts along the altitudinal gradient. This approach has already yielded promising results in another study (Muenchow et al. Reference MUENCHOW, BRÄUNING, RODRÍGUEZ and VON WEHRDEN2013b). It has two fundamental advantages over classical cluster techniques commonly applied in vegetation science (Wesche & Wehrden Reference WESCHE and WEHRDEN2011): (1) the number of cluster classes is objectively chosen by the Bayesian Information Criterion (BIC) for the expectation–maximization (EM) algorithm in a hierarchical manner (Fraley & Raftery Reference FRALEY and RAFTERY2002); (2) it avoids the zero-inflated species matrix by using environmental predictors instead. We chose altitude and NDVI as predictors in the model-based clustering. Subsequently, we used the altitudinal range of each cluster class to identify vegetation belts. Additionally, we searched for the species occurring exclusively and most frequently in the respective cluster classes.
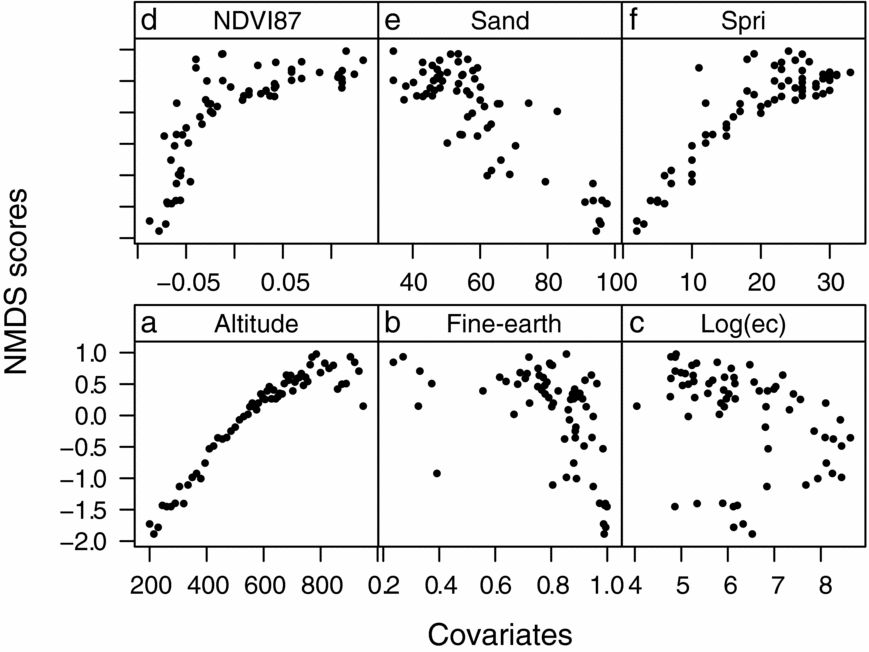
We modelled the vegetation composition as a function of soil covariates. As a first step, we extracted the NMDS scores of the first axis, which already explained 85% of the observed variance, and thus represented the main floristic gradient. Secondly, we used these scores as response variable in a multiple regression analysis (Muenchow et al. Reference MUENCHOW, FEILHAUER, BRÄUNING, RODRÍGUEZ, BAYER, RODRÍGUEZ and VON WEHRDEN2013a). There is a non-linear relationship between the response and the <2-mm soil fraction (Figure 3, hypothesis 1). Consequently, the fine-earth fraction entered the modelling in the form of a polynomial function of the second order. Moreover, the relationship between the fine-earth fraction and electrical conductivity changes along the altitudinal gradient, which required the addition of an interaction term. Comparing the full model and a model without the interaction term, the F-Statistic confirmed the interaction to be significant at the 5% level. The succeeding model selection followed the hypothesis testing approach, dropping one variable at a time until only significant terms remained in the model. The final model was of the form:
 \begin{eqnarray}
\textit{Scores}_i &\sim &{\rm N}(\mu _i ,\sigma^2 ) \nonumber\\
\mu_i &=& \alpha + \beta_1 \times s_i + \beta_2 \times \textit{log}.ec_i + \beta_3 \nonumber\\
&&\times\, \textit{fine}\,\textit{earth}\,\textit{fraction}_i +\beta _4 \nonumber\\
&&\times\, \textit{fine}\,\textit{earth}\,\textit{fraction}_i^2+ \beta _5 \nonumber\\
&&\times\, \textit{fine}\,\textit{earth}\,\textit{fraction}_i \times \textit{log}.ec_i
\end{eqnarray}
where Scores are the NMDS scores of the first axis, i is the ith observation, β is the estimated slope of the corresponding covariate, α is the intercept, log.ec is the logarithm of electrical conductivity and fine-earth fraction × log.ec refers to the interaction between the fine-earth fraction and electrical conductivity. Model inspection showed no violation of the model assumptions. We assessed the relative variable importance by comparing the relative adjusted R 2 change associated with dropping one term at a time.

Figure 3. Scatterplot displaying all variables used in the statistical analyses plotted against the NMDS scores of the first axis. Each dot represents a visited plot on Mount Campana. Altitude (a), fine-earth fraction (b), the logarithm of electrical conductivity (c), the Normalized Difference Vegetation Index obtained in 1987 (d), the sand fraction (e), and plant species richness per plot (f).
Furthermore, we were interested in which topographic covariates can serve as a surrogate for soil properties (hypothesis 2). Accordingly, we performed variation partitioning (Borcard et al. Reference BORCARD, LEGENDRE and DRAPEAU1992). The results of two multiple linear regressions entered the variation partitioning. Regression 1 corresponds to the final model described above. Regression 2 used altitude and its square term, as there is a unimodal relationship with the response (NMDS scores of the first axis; Figure 4a). A permutation test (999 runs) produced significance levels of the pure fractions altitude and soil.

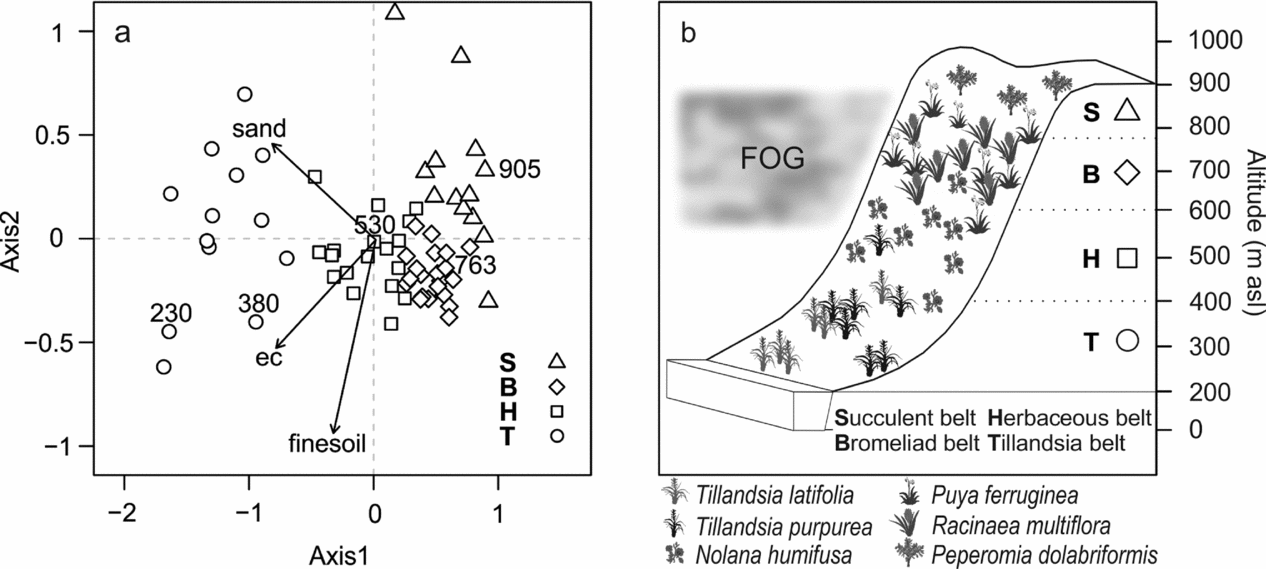
Figure 4. Altitudinal vegetation belts of the Mount Campana. NMDS ordination and cluster classes according to the model-based clustering (Table 1). Only those soil variables were fitted that were rendered significant in a regression analysis. Numbers above symbols represent altitude in m asl (a). Conceptual model of vegetation belts as derived from the model-based clustering. Species’ families can be found in Appendix 1 (b). ec, Electrical conductivity.
All statistical analyses were conducted in the open-source software R (http://www.r-project.org/) using its packages lattice (Sarkar Reference SARKAR2008), mclust (Fraley & Raftery Reference FRALEY and RAFTERY2002), raster (http://CRAN.R-project.org/package=raster) and vegan (http://CRAN.R-project.org/package=vegan).
RESULTS
Description of vegetation and soil along the altitudinal gradient
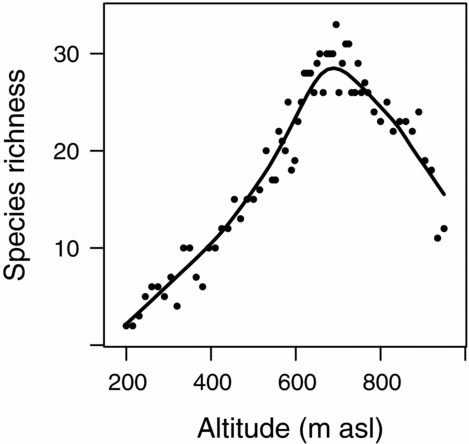
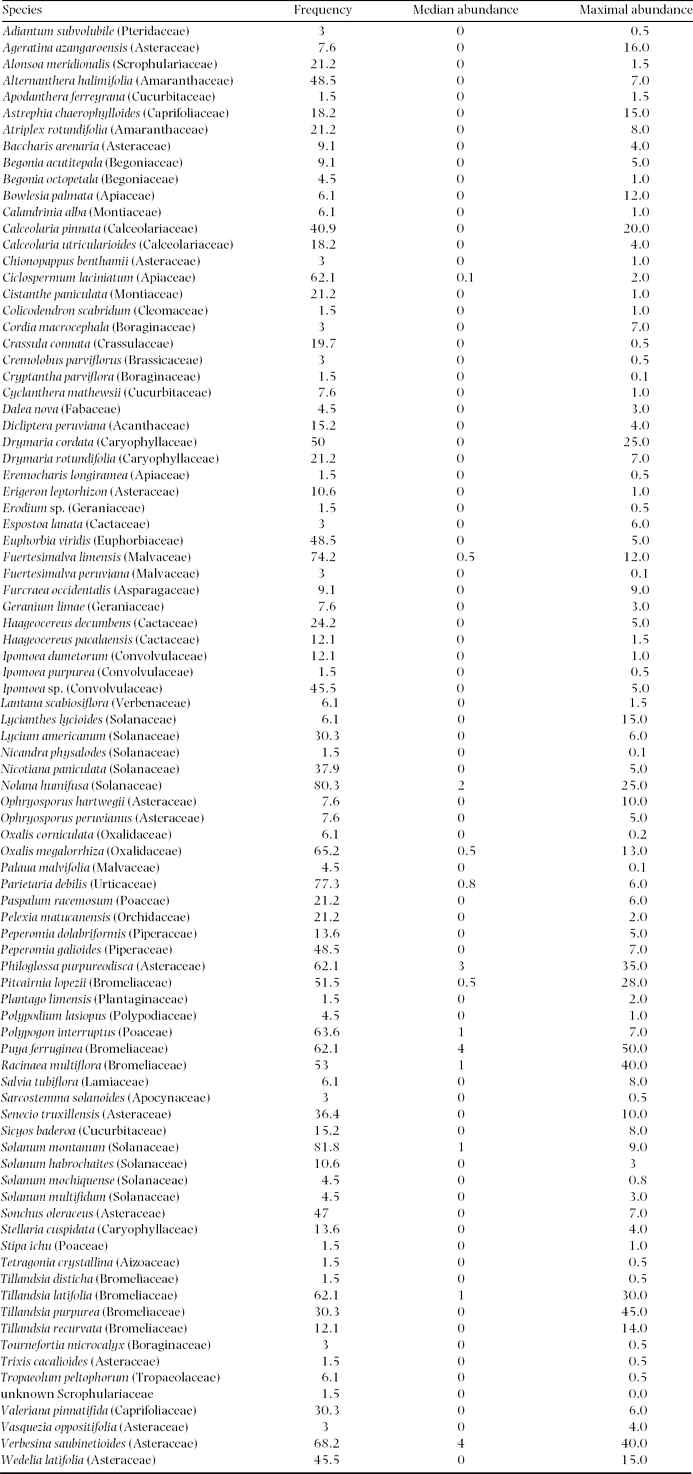
We recorded 88 vascular plant species over the whole elevation gradient (Appendix 1). Plant species richness varied between 2 and 33 per plot (mean = 19). Showing more than one complete species turnover in the DCA (4.15), beta diversity was intermediate, which is also in accordance with Whittaker's beta (4.87). Species richness followed a unimodal pattern along the altitudinal gradient with highest values around 700 m asl (Figure 5).

Figure 5. Species richness along the altitudinal gradient of the Mount Campana. A line smoother was added to aid visual inspection.
Some soil variables also exhibited the mid-domain effect such as electrical conductivity and organic matter. Contrasting, other soil properties showed a decreasing trend (e.g. sand fraction and fine-earth fraction) or barely any relationship with altitude (e.g. sodium and phosphorus concentrations).
Floristic gradient
The NMDS ordination was clearly able to distinguish the different vegetation belts along the altitudinal gradient (hypothesis 1, Figure 4). The length ± SD of the first two axes were 2.8 ± 1.7 and 0.78 ± 0.3 respectively. The first axis showed a tight relationship with altitude and to a lesser degree with electrical conductivity. The second axis reflected mainly the fine-earth and the sand fractions (Figure 4). The NMDS achieved a stress of 9.5. The R 2 between the distances of the original dataset and the distances in ordinal space was 93%.
Vegetation belts and corresponding soil characteristics
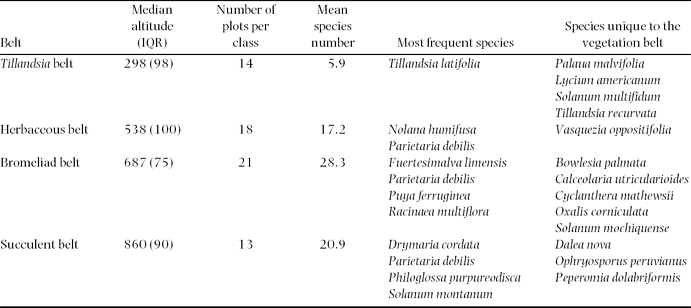
The model-based clustering detected four cluster classes (Table 1; Figure 4): a Tillandsia belt, a herbaceous belt, a bromeliad belt and a succulent belt. Sandy soils dominated the lowermost Tillandsia belt, which showed the lowest mean alpha diversity. Ascending upwards Tillandsia species were replaced by carpets of Nolana humifusa (Solanaceae; Table 1; Figure 4). Soils showed the first signs of humification and a brownish colour due to iron oxide release from primary minerals. The highest alpha diversity levels were reached in the bromeliad belt (Table 1; Figure 4). The coloured and perennial bromeliads Racinaea multiflora and Puya ferruginea dominated this belt (Figure 1b). Woody shrubs were prevalent, and trees remained almost absent. The highest portions of clay, soil organic matter and cations were found in this vegetation belt, indicating the most advanced soil development (Cambisols). By contrast, initial soils with a high portion of skeletal content dominated the uppermost succulent belt. Accordingly, alpha diversity decreased and drought-adapted species such as the succulent Peperomia dolabriformis (Piperaceae) regained dominance (Table 1; Figure 4).
Table 1. Model-based cluster classes. Only species with frequencies >1 were considered. Species’ families can be found in Appendix 1. IQR, Interquartile range.

Explaining the floristic gradient using soil properties and altitude
The sequential hypothesis testing revealed the following significant soil covariates: sand fraction, fine-earth fraction and its square term, electrical conductivity and the interaction between the fine-earth fraction and electrical conductivity. The sand fraction was clearly the most important single predictor in explaining the floristic composition (R2 decrease while dropping the sand fraction from the model = 41.3%) followed by electrical conductivity (R2 decrease = 8.7%), the fine-earth fraction (R2 decrease = 3.7%), and the interaction term (R2 decrease = 1.2%). The model reached a high goodness-of-fit (adjusted R2 = 88%).
Moreover, variation partitioning disclosed that altitude accounted for the complete fraction explained by soil properties (R2 = 88%), and additionally contributed an extra amount of 8% (hypothesis 2). All pure fractions were highly significant (P < 0.001) in accordance with a permutation test.
DISCUSSION
Species richness and the influence of ENSO
Mount Campana supports the most diverse fog oasis on a global scale (Dillon & Rundel Reference DILLON, RUNDEL and Glynn1990). This is most probably due to the relatively high rainfall input in comparison with other fog oases (Muenchow et al. Reference MUENCHOW, BRÄUNING, RODRÍGUEZ and VON WEHRDEN2013b). As a consequence, several species are present which are unusual for deserts (Sagástegui et al. Reference SAGÁSTEGUI, MOSTACERO and LOPEZ1988). In addition, some bromeliads also have their southernmost distribution in the vicinity of Mount Campana (Rundel & Dillon Reference RUNDEL and DILLON1998). Finally, Mount Campana is the highest coastal mountain in Northern Peru, a region where El Niño exerts major influence (Bendix et al. Reference BENDIX, TRACHTE, PALACIOS, ROLLENBECK, GÖTTLICHER, NAUSS and BENDIX2011). It has been long argued that El Niño might trigger tree growth and enhance seedling survival (Lopez et al. Reference LOPEZ, RODRIGUEZ, GRACIA and SABATÉ2006, Sitters et al. Reference SITTERS, HOLMGREN, STOORVOGEL and LOPEZ2012, Squeo et al. Reference SQUEO, TRACOL, LÓPEZ, GUTIÉRREZ, CORDOVA and EHLERINGER2006). The different episodes of ENSO are most probably the cause for much of the plant diversity of the South American fog oases. Most likely, they would be less diverse if ENSO episodes were absent (Dillon et al. Reference DILLON, NAKAZAWA, LEIVA, Haas and Dillon2003) as is the case for comparative sites in the Namib Desert (Lalley & Viles Reference LALLEY and VILES2005) and the Sonoran Desert (Rundel Reference RUNDEL1978). Interestingly, La Niña might have similar positive effects on fog oases as El Niño in terms of fostering diversity, primary productivity and seedling establishment, as cooler temperatures associated with La Niña increase condensation activity in coastal Peru (Muenchow et al. Reference MUENCHOW, BRÄUNING, RODRÍGUEZ and VON WEHRDEN2013b).
Generally, species richness showed a hump-shaped pattern along the studied altitudinal transect. Rahbek Reference RAHBEK(2005) identified this pattern as the most abundant one in studies of altitudinal gradients. Apparently, it is valid for a wide range of organisms such as mosses (Ah-Peng et al. Reference AH-PENG, WILDING, KLUGE, DESCAMPS-JULIEN, BARDAT, CHUAH-PETIOT, STRASBERG and HEDDERSON2012), ferns (Kessler Reference KESSLER2001), insects (Brehm et al. Reference BREHM, COLWELL and KLUGE2007), birds (Kattan & Franco Reference KATTAN and FRANCO2004), vascular plants (Grytnes & Beaman Reference GRYTNES and BEAMAN2006) and mammals (Sanchez-Cordero Reference SANCHEZ-CORDERO2001). Most prominently, ecological (Grytnes Reference GRYTNES2003) and historical reasons (Rahbek & Graves Reference RAHBEK and GRAVES2001) served as explanation for this phenomenon, as well as geometry in form of the mid-domain effect (Colwell et al. Reference COLWELL, RAHBEK and GOTELLI2004), which aroused remarkable controversy (Sandel & McKone Reference SANDEL and MCKONE2006). In our case, we ascribe the unimodal species richness behaviour to local climatic variability. At higher altitudes, water becomes increasingly available until the temperature inversion is reached (Figure 1c). This is in accordance with the general explanation of highest species richness in the presence of climatic optima (Rahbek Reference RAHBEK1995) and another study on a fog oasis in Northern Peru (Muenchow et al. Reference MUENCHOW, BRÄUNING, RODRÍGUEZ and VON WEHRDEN2013b).
Floristic gradient and vegetation belts
The NMDS ordination clearly captured the main floristic gradient with the first axis being overwhelmingly important (hypothesis 1). Consequently, the NMDS identifies altitude as the single most important predictor in explaining the vegetation composition. Our results reveal that altitude reflects levels of water availability and soil properties, which in turn define the classified vegetation belts. The perennial Tillandsia species of the lowermost class are typical representatives of vegetation formations found in fog oases. These perennial airplants are missing functional roots, and usually form patches on sandy habitats (Pinto et al. Reference PINTO, BARRIA and MARQUET2006, Rundel & Dillon Reference RUNDEL and DILLON1998). Higher up, individuals of Nolana humifusa, a species endemic to South American fog oases, indicate arid to semi-arid conditions (Dillon Reference DILLON, Keating, Hollowell and Croat2005). The bromeliad belt is the most humid vegetation belt, and thus harbours the highest number of species. In addition, it is also the belt with the best-developed and most nutrient-rich soils. Dillon & Rundel (Reference DILLON, RUNDEL and Glynn1990) refer to this belt as the woody species belt. This is confirmed by our results, as we recorded the highest number of woody species in this belt. However, trees were almost completely missing. We attribute this to human activity such as firewood harvesting (Dillon et al. Reference DILLON, NAKAZAWA, LEIVA, Haas and Dillon2003). Increasingly arid conditions prevail in the uppermost belt, which is visible in the appearance of initial soils and the adaptation to drought conditions of perennial plants.
Our model-based cluster approach confirms the schematically described vegetation belts of fog oasis formations (Dillon & Rundel Reference DILLON, RUNDEL and Glynn1990, Ono Reference ONO and Ono1986). A study from another fog oasis in Northern Peru reported five vegetation belts (Muenchow et al. Reference MUENCHOW, BRÄUNING, RODRÍGUEZ and VON WEHRDEN2013b). In the case of Mount Campana, the transition from bromeliad belt to adjacent vegetation belts is gradual. By contrast, these transition zones are more distinct on the Mount Mongón, and therefore identified as individual vegetation belts.
Interpretation of the influence of soil predictors
All soil variables chosen by our model reflect the altitudinal gradient, and consequently water availability in different ways (hypotheses 1 & 2). Concordantly, many studies confirmed water availability to be the most important limiting factor for primary production in arid to semi-arid environments (Espinosa et al. Reference ESPINOSA, CABRERA, LUZURIAGA and ESCUDERO2011, White & Hood Reference WHITE and HOOD2004, Whitford & Steinberger Reference WHITFORD and STEINBERGER2011). However, soil properties might be equally important (Ronnenberg & Wesche Reference RONNENBERG and WESCHE2011, Whitford & Steinberger Reference WHITFORD and STEINBERGER2011), and change along gradients (Wang et al. Reference WANG, ZHANG, SONG, LIU, REN, ZHANG, HU, YANG and LIU2009).
In our study the sand fraction is the most important soil predictor. It steadily decreases with altitude until it meets the temperature inversion at about 850 m asl (Figure 1c). A low proportion of sand coincides with a high proportion of silt and clay. These fine grain sizes only develop if chemical weathering occurs, which in tropical climates mainly depend on water availability (Pope et al. Reference POPE, DORN and DIXON1995). A higher proportion of silt and clay provides properties beneficial to vegetation growth such as an increased capacity for storing water available to plants and the reversible storage of essential plant nutrients (Mengel & Kirkby Reference MENGEL and KIRKBY2001). The fine-earth fraction exhibits a non-linear relationship with altitude (hypothesis 1), but is in general decreasing. Naturally, steeper slopes and rocky outcrops are more frequent with increasing altitude, thus explaining a lower percentage of the fine-earth fraction at higher altitudes. By contrast, sand-accumulating winds form dune fields on gentle slopes at sea level. Electrical conductivity values peak at an altitudinal range between 300 and 550 m asl. The ionic concentrations of fogs might be one source of supplying the mountain slope with sulphate. However, this factor might be less effective than previously thought (Eckardt et al. Reference ECKARDT, SODERBERG, COOP, MULLER, VICKERY, GRANDIN, JACK, KAPALANGA and HENSCHEL2013). Other salt sources might include bedrock weathering and dust storms (Viles & Goudie Reference VILES and GOUDIE2013). Whatever the source, ionic concentrations are highest where moisture thresholds are crossed that allow the hydration and crystallization of common desert salts such as sodium sulphate (Viles & Goudie Reference VILES and GOUDIE2013). This is most likely below the temperature inversion in our study area. Subsequently, these salts are probably transported downslope via interflow. Logically, humid air cannot pass the inversion. As a consequence lower electrical conductivity values occur at higher altitudes. High water infiltration rates and less fog occurrence may account for the low electrical conductivity values in the sandy lower part of the study area.
In concurrence with our results, soil texture and salinity are the most important soil physical properties influencing vegetation in arid environments (Abd El-Ghani et al. Reference ABD EL-GHANI, ABO EL-KHEIR, ABDEL-DAYEM and ABD EL-HAMID2011, Li et al. Reference LI, ZHAO, SONG, SHENG and ZHU2010). By contrast, soil nutrients appear to be more important in savannas (Sarmiento et al. Reference SARMIENTO, SILVA, NARANJO and PINILLOS2006), tropical dry forests (Peña-Claros et al. Reference PEÑA-CLAROS, POORTER, ALARCON, BLATE, CHOQUE, FREDERICKSEN, JUSTINIANO, LEANO, LICONA, PARIONA, PUTZ, QUEVEDO and TOLEDO2012) and tropical montane forests (Soethe et al. Reference SOETHE, LEHMANN and ENGELS2008). Nevertheless, nutrients most definitely influence plant growth in fog oases. For instance, González et al. Reference GONZÁLEZ, FARINA, PINTO, PEREZ, WEATHERS, ARMESTO and MARQUET(2011) have shown how fog supplies bromeliads with nutrients in Chile.
CONCLUSIONS
This study tackled several key topics in biogeography and ecology. Species richness shows a mid-domain peak along the altitudinal gradient of our study area, which we explain by highest water availability at mid-elevations. We identify four vegetation belts along this climatic-altitudinal gradient. Additionally, we relate soil properties to the vegetation composition of a fog oasis for the first time. Soil variables, rendered significant by our statistical analyses, are also dependent on altitude, and thus water availability. Finally, we tentatively argue that both El Niño as well as La Niña events are beneficial for biomass production in fog oases.
The vegetation formations of Mount Campana might face extinction due to increased human activity on its slopes and in its immediate vicinity in the near future (http://www.chavimochic.gob.pe). However, human activities must not necessarily preclude the protection of highly diverse ecosystems, as demonstrated by examples from Thailand (Barbier et al. Reference BARBIER, KOCH, SILLIMAN, HACKER, WOLANSKI, PRIMAVERA, GRANEK, POLASKY, ASWANI, CRAMER, STOMS, KENNEDY, BAEL, KAPPEL, PERILLO and REED2008) and Mexico (Cortina-Villar et al. Reference CORTINA-VILLAR, PLASCENCIA-VARGAS, VACA, SCHROTH, ZEPEDA, SOTO-PINTO and NAHED-TORAL2012), and the concept of ecosystem services (Viglizzo et al. Reference VIGLIZZO, PARUELO, LATERRA and JOBBAGY2012) show. Therefore, it is still possible to protect this unique and very sensitive ecosystem, and, most importantly, the most diverse fog oasis in the world with its high portion of endemic species (Figure 1d; Dillon & Rundel Reference DILLON, RUNDEL and Glynn1990).
ACKNOWLEDGEMENTS
We are deeply thankful for the funding granted by the Deutsche Forschungemeinschaft (project Ri 370/19 – 1). We greatly appreciate the comments and recommendations of the anonymous reviewer which helped to improve the manuscript. Also we would like to thank the Land Processes Distributed Active Archive Center of the NASA (https://lpdaac.usgs.gov/) for providing remote sensing imagery (ASTER, Landsat). Furthermore, we are indebted to Dr Ute Schmidt and Roswitha Höfner-Stich (both Erlangen) for their indispensable and kind support in the soil laboratory. Finally, we are most grateful to Dr Michael Richter for arousing our interest in Lomas formations.
Appendix 1. List of all species found on Mount Campana during the study period (August–September 2011) including frequency (%) over all plots and median and maximal observed plot abundance (%). Nomenclature follows the Missouri Botanical Garden Tropicos online database (http://www.tropicos.org/).


