INTRODUCTION
Canopies of tropical rain forests commonly have a high richness of tree species (Richards Reference RICHARDS1952, Turner Reference TURNER2001, Whitmore Reference WHITMORE1998). However, there are many instances of rain-forest canopies being dominated by just one or a few related species, even in forests with a relatively high richness of tree species (Connell & Lowman Reference CONNELL and LOWMAN1989). In New Caledonia, in the south-west Pacific, some stands of tropical rain forest on ultramafic soils have an upper canopy dominated by one or two species of Nothofagus (Nothofagaceae) (Read & Hope Reference READ, HOPE, Veblen, Hill and Read1996, Read et al. Reference READ, JAFFRÉ, GODRIE, HOPE and VEILLON2000). Population size structures and tree-ring analysis indicate that these are secondary forests, with recruitment insufficient to maintain monodominance, except possibly at high altitudes (Read & Jaffré Reference READ and JAFFRÉ2013). At low- to mid-altitudes, the canopy is predicted to change from Nothofagus-dominance to a mixed canopy, unless this progression is interrupted by moderate to severe disturbance (e.g. cyclone or wildfire) during the lifespan of the Nothofagus trees (Read & Jaffré Reference READ and JAFFRÉ2013). Arillastrum gummiferum (Myrtaceae) (Jaffré Reference JAFFRÉ1980), and to a lesser extent Cerberiopsis candelabra (Apocynaceae) (Read et al. Reference READ, SANSON, JAFFRÉ and BURD2006a), also dominate some forest stands in this region, and also have size structures that suggest dependence on disturbance for regeneration (McCoy et al. Reference MCCOY, JAFFRÉ, RIGAULT and ASH1999, Read & Jaffré Reference READ and JAFFRÉ2013, Read et al. Reference READ, SANSON, BURD and JAFFRÉ2008). It appears from the data available that monodominance in southern New Caledonia is generally due to superior responsiveness to large-scale forest disturbance by long-lived (> 100 y) and presumably light-demanding species (Ibanez & Birnbaum Reference IBANEZ and BIRNBAUM2014, Read & Jaffré Reference READ and JAFFRÉ2013). This contrasts with the persistent monodominant tropical forests dominated by shade-tolerant species that have been commonly reported elsewhere (Connell & Lowman Reference CONNELL and LOWMAN1989, Hart Reference HART1990, Nascimento et al. Reference NASCIMENTO, BARBOSA, VILLELA and PROCTOR2007, Peh et al. Reference PEH, LEWIS and LLOYD2011, Torti et al. Reference TORTI, COLEY and KURSAR2001).
Differences among tree species in shade tolerance influence forest dynamics and composition (Bazzaz Reference BAZZAZ1979, Canham et al. Reference CANHAM, FINZI, PACALA and BURBANK1994, Craine & Reich Reference CRAINE and REICH2005, Kobe et al. Reference KOBE, PACALA, SILANDER and CANHAM1995, Thompson et al. Reference THOMPSON, STOCKER and KRIEDEMANN1988). In particular, monodominant rain-forest canopies that develop following large-scale disturbance are likely to comprise fast-growing, relatively shade-intolerant (SIT) species, with eventual replacement by slow-growing shade-tolerant (ST) species in the absence of further disturbance (Connell & Lowman Reference CONNELL and LOWMAN1989, Hart Reference HART1990). ST species typically have a low maximum rate of net carbon assimilation (Amax), low plasticity in Amax in response to sun vs shade growth conditions, and a low instantaneous light compensation point (LCP) and dark respiration rate (Rd), compared with SIT species (Bazzaz Reference BAZZAZ1979, Björkman Reference BJÖRKMAN, Lange, Nobel, Osmond and Zeigler1981, Boardman Reference BOARDMAN1977, Craine & Reich Reference CRAINE and REICH2005, Loach Reference LOACH1967). According to the carbon gain hypothesis, ST species have higher assimilation rates than SIT species at low irradiances (Valladares & Niinemets Reference VALLADARES and NIINEMETS2008). However, there is mixed support for this hypothesis (Reich et al. Reference REICH, WRIGHT, CAVENDER-BARES, CRAINE, OLEKSYN, WESTOBY and WALTERS2003, Valladares & Niinemets Reference VALLADARES and NIINEMETS2008, Walters & Reich Reference WALTERS and REICH1999), and some field-based studies in tropical rain-forest seedlings (Kitajima Reference KITAJIMA1994) have failed to find simple relationships of leaf-level assimilation traits with ‘effective shade-tolerance’, i.e. shade-tolerance as defined by persistence (Turner Reference TURNER2001).
Processes acting on seedling life stages can have important influences on community dynamics in tropical forests (Green et al. Reference GREEN, HARMS and CONNELL2014, Reich et al. Reference REICH, WRIGHT, CAVENDER-BARES, CRAINE, OLEKSYN, WESTOBY and WALTERS2003). Here we investigate seedlings of Nothofagus and co-occurring species to test whether leaf-level assimilation traits are consistent with regeneration patterns inferred from population size structures. In particular, we wish to elucidate the key traits associated with monodominance by long-lived secondary species, and their loss of dominance over time. We test the hypotheses that (1) Nothofagus spp., C. candelabra and A. gummiferum (monodominants) have high photosynthetic rates at high irradiances and poor photosynthetic tolerance of shade, and, more generally, that (2) species with stronger evidence of continuous regeneration have greater leaf-level photosynthetic tolerance of shade than species with episodic regeneration. These hypotheses were tested on seedlings of 20 species raised under contrasting light regimes in a common garden experiment.
METHODS
Species selection and growth conditions
Twenty species were selected that occur in the canopy of Nothofagus and adjacent mixed-canopy rain forests on ultramafic soils in the south of the main island (Read et al. Reference READ, JAFFRÉ, GODRIE, HOPE and VEILLON2000) (Table 1). They included species that regenerate episodically (ER) (including monodominants: three Nothofagus species, A. gummiferum and C. candelabra) and species that regenerate continuously (CR) (Table 1). Two subordinate species could not be categorized because of variable regeneration patterns (Gastrolepis austrocaledonica) or population size structures with disjunctions that are difficult to interpret (Planchonella wakere). When possible, seedlings were collected from forest understoreys, maximizing the likelihood of mycorrhizal inoculation. However, seedlings of some species were not available so instead were grown from seed (Table 1). Seedlings were grown in forest soil, with mixed leaf litter added to all pots to maximize likelihood of inoculation. Seedling ages were estimated as c. 6–18 mo old (10–30 cm high) at the start of the growth experiment in July 2011. Prior to the start of the experimental growth period, seedlings were grown for a minimum of 10 wk in nursery houses with shade-cloth walls (c. 30% shade) that allowed air circulation and a translucent plastic roof (c. 50% shade) at the nursery facility of the Environmental Conservation Service (Vale New Caledonia) in the Plaine des Lacs (22.27°S, 166.91°E, 260 m asl). They were grown in 3-L planter bags in soil collected to 20–25 cm depth from eight locations on ultramafic substrate in Nothofagus-dominated rain forest in the Plaine des Lacs. The soil was sieved to remove coarse material, then mixed with perlite and coconut fibre in the ratio of 75:15:10 to reduce compaction that occurs in potting.
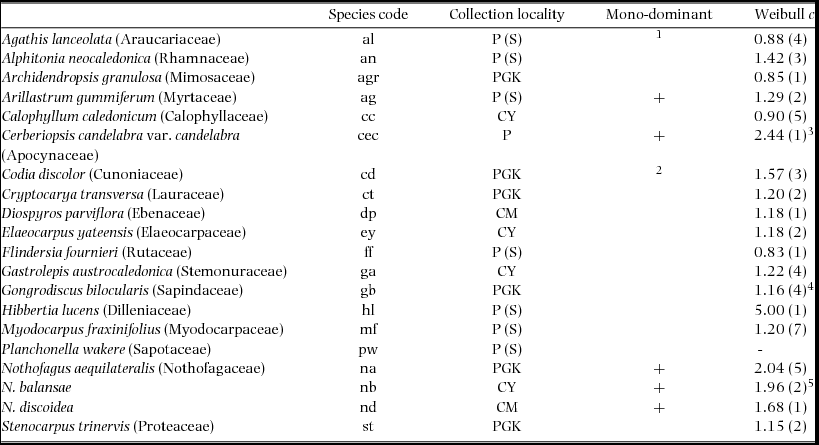
Table 1. Rain-forest canopy species used in this study and their collection localities in New Caledonia. Species codes are listed, as used in Figures 1, 2 and 4. For each species it is indicated whether they are commonly monodominant (+) and the average Weibull c-value (a measure of the shape of the population size structure) is listed, not including disjunct distributions, with the number of sites in parentheses (Read & Jaffré Reference READ and JAFFRÉ2013; unpublished data; all from Nothofagus-dominated and associated forests). Collection localities: CM, Col de Mouirange; CY, Col de Yaté; PGK, Pic du Grand Kaori; P, Plaine des Lacs. (S), seed (all others were collected as seedlings in the Plaine des Lacs). Nomenclature follows Morat et al. (Reference MORAT, JAFFRÉ, TRONCHET, MUNZINGER, PILLON, VEILLON and CHALOPIN2012) (Vers. 27,V.2014) and we retain Nothofagus accordingly, but note that Heenan & Smissen (Reference HEENAN and SMISSEN2013) have reinstated Trisyngyne Baillon. 1Manauté et al. (Reference MANAUTÉ, JAFFRÉ, VEILLON, KRANITZ, Bieleski and Wilcox2009) report A. lanceolata forming small stands; 2Ibanez & Birnbaum (Reference IBANEZ and BIRNBAUM2014) note observation of monodominance by C. discolor; 3 c-values of 1.8–4.4 were recorded in C. candelabra forests (Read et al. Reference READ, SANSON, BURD and JAFFRÉ2008); 4one outlier was excluded; 5data from Read & Jaffré (Reference READ and JAFFRÉ2013) were re-analysed, excluding saplings at forest edges.
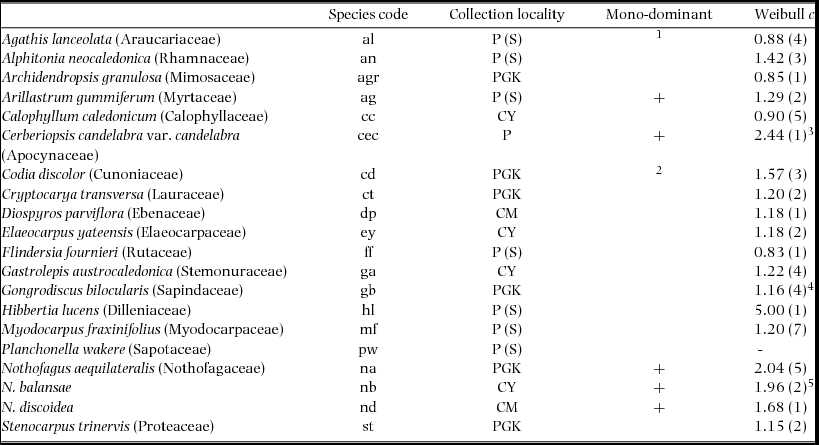

Figure 1. Assimilation traits of seedlings of 20 New Caledonian rain-forest tree species from New Caledonia. Maximum net assimilation rate per unit leaf area (a); maximum net assimilation rate per unit leaf dry mass (b); apparent quantum yield (c); light compensation point (d); rate of dark respiration per unit leaf area (e); rate of dark respiration per unit leaf dry mass (f). The data presented are the means ± SEM (n = 1–5). The left-hand (hatched) column is the shade treatment for each species, and the right-hand (blank) column is the sun treatment. Species codes are given in Table 1. The status of each species with respect to monodominant vs subordinate, and continuous vs episodic regeneration, is shown.
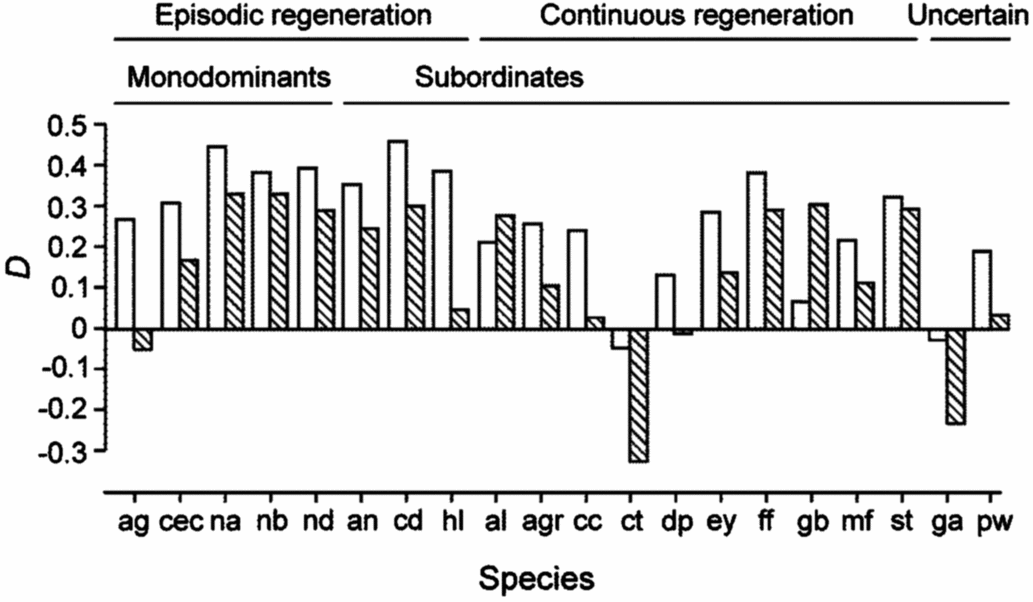
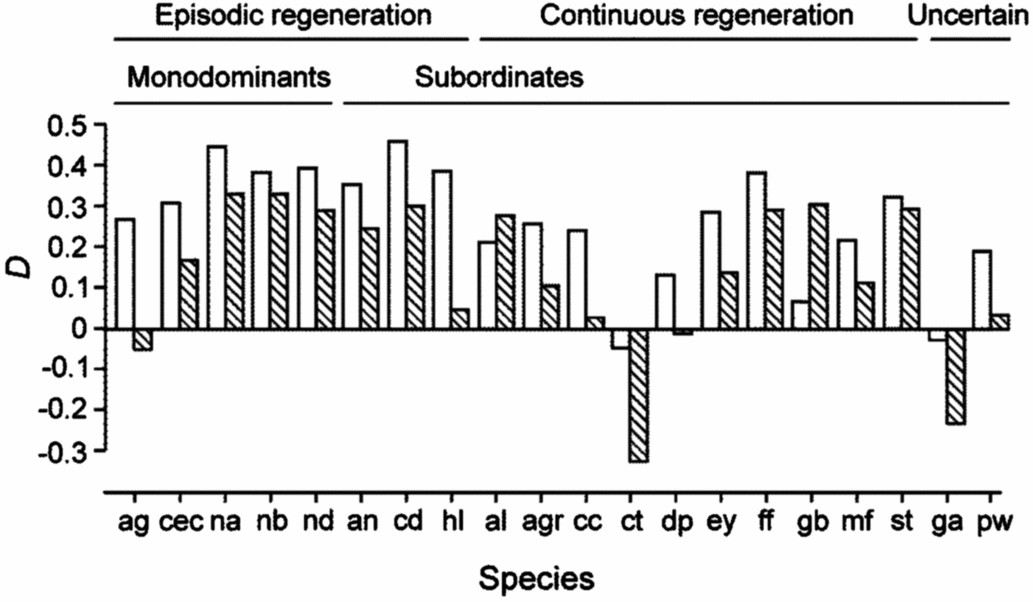
Figure 2. Plasticity, D, of Amax-area and Amax-mass in seedlings of 20 New Caledonian rain-forest tree species. D is calculated as (X sun−X shade)/X sun, where X is any of the measured variables. Blank bars, Amax-area; hatched bars, Amax-mass. The status of each species with respect to monodominant vs subordinate, and continuous vs episodic regeneration, is shown.
Much of the nutrient input in rain-forest soil comes from continuing input of leaf litter (Brearley et al. Reference BREARLEY, PRESS and SCHOLES2003), and therefore this pot experiment is lacking a significant source of nutrients, especially for these infertile ultramafic soils. Hence nutrients were added at a low dosage. At the start of the experiment, 2 g of Nutricote® Hot Aussie Blend (Yates Australia) slow-release fertilizer designed for tropical conditions (18% N, 2.6% P, 6.6% K and 1.2% Mg) was added to each pot. This dosage was chosen based on a study of some Australian tropical rain-forest species, including those native to infertile soils (grown in sand) (Gleason et al. Reference GLEASON, READ and ARES2011), and represents one-quarter of the maximum strength used in that study.
Two light levels were used: no shade beyond that supplied by the roof, and 70% added shade. Together with the roofing, these provided c. 50% and 20% transmitted light respectively. Shading was increased after 10 wk to c. 30% and 10% transmitted light. A Li-Cor (Li-190R) quantum sensor was used to measure the photosynthetic photon flux density (PPFD) at midday in the centre of each treatment replicate once per week. The average PPFD over the growth period was 473 (94–1361) μmol m−2 s−1 in the sun treatment and 175 (31–441) μmol m−2 s−1 in the shade treatment. This compares with an average of 1330 (350–2265) μmol m−2 s−1 in the open at midday, 20–600 μmol m−2 s−1 in a canopy gap in nearby Nothofagus forest in sunshine and 6–12 μmol m−2 s−1 below an undisturbed canopy (all measured at 20 cm above ground level). The shade level chosen was a compromise between deep shade and shade levels likely to allow new leaves to be produced in all species to allow measurement of photosynthesis traits. The shade cloth covered the ceiling and the sides of each block to a height of 30 cm above the benches, facilitating air circulation across all treatments. Four replicates of each treatment were used to provide a block design, with up to four seedlings of each species included in each treatment replicate, i.e. up to 16 seedlings per species in each treatment condition. The position of the treatment blocks and seedling position within blocks was randomized.
The watering regime varied across seasons, but typically comprised light watering for 10 min three times daily, with 5 min of misting each hour from 09h30 to 15h30. Temperature and humidity were recorded at hourly intervals by Thermocron® iButtons (Maxim Integrated, San Jose, CA, USA) placed at pot-height in a custom-built housing that provided protection from water while maximizing exposure to air movement (four iButtons were used, two per light treatment). Average maximum temperature during the experiment was 25.3°C (18.1°C–31.6°C) in the sun treatment and 23.9°C (18.1°C–31.1°C) in the shade treatment, with an average minimum relative humidity of 70% and 75% in the sun and shade treatments respectively.
Photosynthesis measurements
Light response curves were measured on recently expanded leaves of up to five plants per light treatment (but only one sun-raised seedling of Gastrolepis austrocaledonica and Gongrodiscus bilocularis), including at least one plant per treatment block where possible, in November–December 2011. An ADC LCpro-SD (ADC BioScientific Ltd, Great Amwell, England) infra-red gas analyser was used to measure CO2 uptake rates in a leaf chamber (6 cm2 surface area) at 24.1°C–24.9°C, 21–22 mbar vapour pressure (c. 0.7–1.0 kPa VPD), and ambient CO2 concentrations (c. 370 ppm). Input air was passed through a 20-L container to minimize short-term fluctuations in CO2 and water vapour. For each plant sample, CO2 uptake rates were measured at nine levels of PPFD (0, 20, 55, 100, 150, 250, 400, 500 and 600 μmol m−2 s−1), starting at high PPFD. At each PPFD level, at least five successive readings were taken after carbon uptake levels had stabilized, and the average used for analyses. Leaf samples used for measurement were digitally scanned at 300 dpi, with the leaf area later measured by image analysis (Mix Image: R. Stolk & G. Sanson, Monash University), then dried to constant mass at 60°C and weighed. Assimilation rates were calculated per leaf area and per leaf dry mass. Specific leaf area (SLA) was calculated from total plant leaf area and leaf mass obtained from harvesting plants at the end of the experimental growth period.
Data analysis
Light response curves were fitted using a three-parameter exponential (Von Bertalanffy) equation (Gleason et al. Reference GLEASON, READ and ARES2011, Horton & Neufeld Reference HORTON and NEUFELD1998): Anet = Rd + gAmax (1 − e−k×PPFD) where Anet = observed net CO2 assimilation rate, Rd = dark respiration rate, gAmax = maximum gross CO2 assimilation rate and k is related to the slope of the curve. Fit to this equation was good, with adjusted R 2 values generally higher than 0.98 across all species and treatments. The light compensation point (LCP) and apparent quantum yield (AQY) were obtained from regression of the first three data points (PPFD = 0–55 μmol m−2 s−1) and net Amax (Amax) as gAmax−Rd. A point-based estimate of plasticity, D, was modified after Portsmuth & Niinemets (Reference PORTSMUTH and NIINEMETS2007): (X sun−X shade)/X sun, where X is any assimilation variable.
Assimilation data were analysed with two-factor ANOVA (light treatment × species), rather than a partly-nested analysis, because replicates could not be obtained from each block for some species. Planned contrasts of monodominant (5 species) versus subordinate (15 species), and CR (10 species) versus ER (8 species) species were undertaken for each light treatment. CR and ER designation was based on time-specific analysis of population size structures using the fit to the Weibull probability density function (Read & Jaffré Reference READ and JAFFRÉ2013). Weibull c values (a measure of curve shape) were averaged across multiple sites, where possible, not including values from disjunct distributions. Although c ≤ 1 indicates reverse-J and negative exponential curves, which suggest continuous regeneration, we used c ≤ 1.2 to indicate potential continuous regeneration since population size structures with these higher c-values typically had high numbers of saplings and small trees that may represent a capacity for continuous regeneration. Weibull c values were also used as a regeneration index in correlation analysis, with values >1 suggesting increasingly synchronous establishment, at least to c ≅ 3.6 where the curve is bell-shaped (Bailey & Dell Reference BAILEY and DELL1973). While there are some weaknesses in the use of Weibull c as a regeneration index, including that some species occurred at only 1–2 study sites, the sites varied in canopy openness, and we have not yet determined the causes of disjunct regeneration curves (Read & Jaffré Reference READ and JAFFRÉ2013), it provides a simple quantitative index based on field results.
Associations among variables were explored with Pearson correlation. They were then summarized to detect pattern among species using non-metric multi-dimensional scaling (NMDS) of normalized data (first log-transformed where appropriate) with similarity determined by Euclidean distance. Analysis of Similarity (ANOSIM) was used to test for trait similarity between groups, with Similarity Percentage Analysis (SIMPER) used to determine which traits contributed most to significant dissimilarity between groups (Clarke Reference CLARKE1993). Data assumptions were checked prior to analyses and log-transformations were used for some variables. SYSTAT v. 13 was used for all univariate analyses, and Primer v6 (Clarke & Gorley Reference CLARKE and GORLEY2006) for multivariate analyses, with α = 0.05 for hypothesis testing.
RESULTS
Trait comparisons among species and light treatments
Significant differences were recorded among species for all assimilation traits and for SLA (Figure 1, Table 2). Amax-area was higher on average in sun plants, but the difference between sun and shade plants varied among species (Figure 1a, Table 2). Amax-mass was also higher in sun plants, despite higher SLA in shade plants, but the difference between light treatments was not as strong as for Amax-area (Figure 1b, Table 2). AQY and Rd-mass did not differ between light treatments, but Rd-area and LCP were significantly higher in sun plants (Figure 1c–f, Table 2). In general, sun and shade values for the same trait were strongly positively correlated (Table 3). Amax-area values for sun and shade treatments correlated positively with Amax-mass for sun and shade, generally with Rd-mass, and with Rd-area in shade, but not with LCP (Table 3). Rd (both area and mass basis) correlated positively with LCP, at least in the same light treatment (Table 3). SLA values for sun and shade correlated positively with Amax-mass (sun and shade values) (Table 3). D-Amax-area correlated positively with Amax-area in sun plants (RP = 0.82, P < 0.001), but not shade plants.
Table 2. Tests of sun and shade effects and differences among species in assimilation traits in seedlings of 20 New Caledonian rain-forest tree species. Results of ANOVA (n = 1–5) are presented. Amax-area, maximum net assimilation rate per unit leaf area; Amax-mass, maximum net assimilation rate per unit leaf dry mass; AQY, apparent quantum yield; LCP, light compensation point; Rd-area, rate of dark respiration per unit leaf area; Rd-mass, rate of dark respiration per unit leaf dry mass; SLA, specific leaf area.

Table 3. Correlations among assimilation traits and SLA in seedlings of 20 New Caledonian rain-forest tree species. The data presented are Pearson correlation coefficients (RP), with asterisks indicating the level of significance: *, P < 0.05; **, P < 0.01; ***, P < 0.001. Amax-area, maximum net assimilation rate per unit leaf area; Amax-mass, maximum net assimilation rate per unit leaf dry mass; LCP, light compensation point; Rd-area, rate of dark respiration per unit leaf area; Rd-mass, rate of dark respiration per unit leaf dry mass. sh, shade; su, sun. All data except Amax-area were log-transformed for analysis.

Arillastrum gummiferum, C. candelabra, Nothofagus spp., Alphitonia neocaledonica, Codia discolor and Hibbertia lucens showed the relatively high Amax-area in sun plants and generally high plasticity in Amax-area that is expected in SIT species (Figure 1a, 2). Of these species, only C. candelabra, A. neocaledonica, C. discolor and H. lucens had relatively high Amax-mass (Figure 1b). Arillastrum gummiferum and Planchonella wakere had relatively high LCP (Figure 1d), and Diospyros parviflora, Flindersia fournieri and Gastrolepis austrocaledonica had low Rd-area in shade plants (Figure 1e), but there was less pattern in these traits which had relatively large coefficients of variation (LCP: 0.60; Rd-area: 0.47). Rd-mass showed a similar trend, with high values in A. gummiferum and P. wakere, and also in C. candelabra, A. neocaledonica, C. discolor and H. lucens (Figure 1f). All Nothofagus species had low Rd-mass compared with other ER species (Figure 1f). Based largely on values of Amax-area and D-Amax-area, A. gummiferum, C. candelabra, Nothofagus spp., A. neocaledonica, C. discolor and H. lucens appear to be relatively SIT, Agathis lanceolata, Calophyllum caledonicum, D. parviflora, Cryptocarya transversa, Elaeocarpus yateensis, Gongrodiscus bilocularis and Myodocarpus fraxinifolius appear to be relatively ST, with Stenocarpus trinervis, F. fournieri and Archidendropsis granulosa somewhat intermediate. Gastrolepis austrolocaledonica and P. wakere appear to be ST based on their Amax-area and D-Amax-area values, but only one sun-plant was evaluated for the former species, and high LCP and Rd in the latter species appear contradictory.
Differences in traits between monodominants and subordinates, and CR and ER species
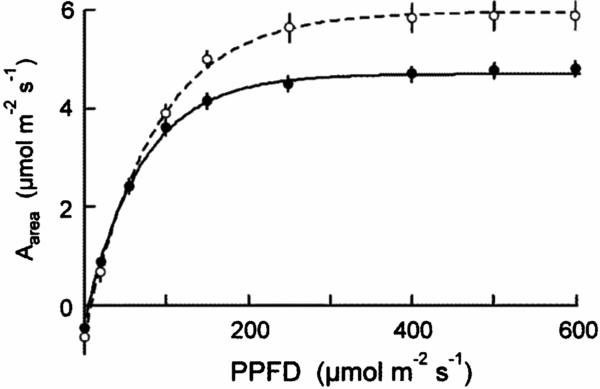
There were relatively few differences in assimilation traits between monodominant and subordinate species, or ER and CR species (Table 4). In sun conditions, Amax-area (but not Amax-mass) was higher on average in monodominants (9.0 ± 0.3 μmol m−2 s−1) than subordinates (7.0 ± 0.6 μmol m−2 s−1) (Table 4). However, Amax-area in the sun regime was at least as high, or higher, in the subordinate ER species, A. neocaledonica, C. discolor and H. lucens (Figure 1a). ER species had significantly higher Amax-area in both light treatments (9.6 ± 0.4 μmol m−2 s−1 and 5.9 ± 0.3 μmol m−2 s−1 in sun and shade respectively) than CR species (6.2 ± 0.3 μmol m−2 s−1 and 4.8 ± 0.2 μmol m−2 s−1 in sun and shade respectively), proportionately more so in sun than shade. Amax-mass was higher in ER (140 ± 21 nmol g−1 s−1) in the sun treatment than CR species (87 ± 8 nmol g−1 s−1), but with no difference in the shade treatment (Table 4). Plasticity in Amax-area (D-Amax-area) (but not in Amax-mass) was also significantly higher in ER species (0.37 ± 0.02 in ER, 0.21 ± 0.04 in CR; F = 11.5, P = 0.004) (Figure 2). Notably, Amax-mass was low in Nothofagus spp. and A. gummiferum compared with other ER species, in both sun and shade treatments, but high in C. candelabra (Figure 1b) which has the highest SLA (average of 231–291 cm2 g−1 for sun and shade plants respectively) of all species investigated (100–186 and 104–226 cm2 g−1 for other sun and shade plants respectively). Rd-area and Rd-mass (but not LCP) were significantly lower in CR (0.47 ± 0.03 μmol m−2 s−1 and 7 ± 1 nmol g−1 s−1 respectively) than ER species (0.63 ± 0.06 μmol m−2 s−1 and 11 ± 2 nmol g−1 s−1) in shade plants (Table 4), with a crossover in light response curves below PPFD of 55 μmol m−2 s−1 (Figure 3). The only assimilation traits that correlated (positively) with Weibull c were Amax-area and to a lesser degree Amax-mass in sun plants, AQY in sun plants (possibly due to photoinhibition) and Amax-area in shade plants (Table 5).
Table 4. Planned contrasts of assimilation traits of monodominants vs. subordinates and continuous regenerators vs. episodic regenerators in seedlings of 20 New Caledonian rain-forest tree species. M, monodominants; S, subordinates; CR, continuous regenerators; ER, episodic regenerators. Amax-area, maximum net assimilation rate per unit leaf area; Amax-mass, maximum net assimilation rate per unit leaf dry mass; AQY, apparent quantum yield; LCP, light compensation point; Rd-area, rate of dark respiration per unit leaf area; Rd-mass, rate of dark respiration per unit leaf dry mass. *, P < 0.05; **, P < 0.01; ***, P < 0.001; ns, not significant. L, data log-transformed for analysis.
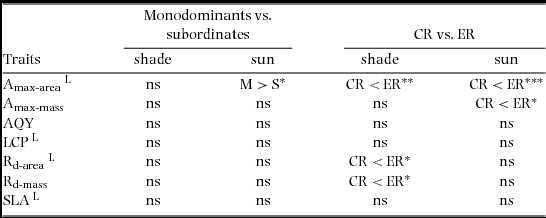
Table 5. Correlations of seedling assimilation traits and the NMDS axis 1 scores with Weibull c in 20 New Caledonian rain-forest tree species. The data presented are Pearson correlation coefficients (RP), with asterisks indicating the level of significance: *, P < 0.05; **, P < 0.01; ***, P < 0.001. Amax-area, maximum net assimilation rate per unit leaf area; Amax-mass, maximum net assimilation rate per unit leaf dry mass; Rd-area, rate of dark respiration per unit leaf area; Rd-mass, rate of dark respiration per unit leaf dry mass; LCP, light compensation point; AQY, apparent quantum yield; D, point-based estimate of plasticity. Weibull c was log-transformed for analysis, as were some other variables (L).
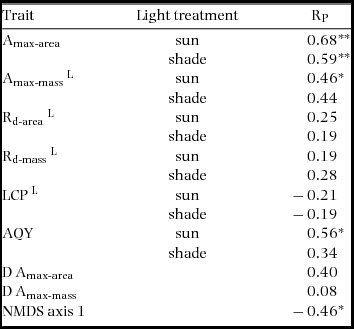
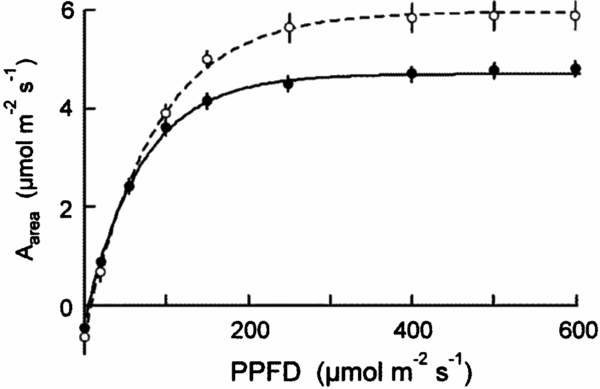
Figure 3. Light dependence curves of assimilation (Aarea) for shade-grown seedlings of 20 New Caledonian rain-forest tree species. Solid symbols, continuously regenerating (CR) species; open symbols, episodically regenerating (ER) species. The data are means of species with standard errors.
Trait syndromes
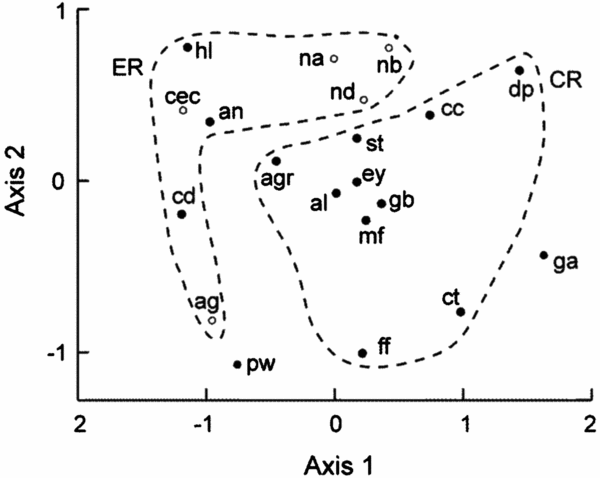
The NMDS plot indicated close grouping among Nothofagus spp., but the other monodominants were dispersed (Figure 4) and ANOSIM indicated no dissimilarity between monodominants and subordinates in trait associations (Global R = 0.01, P = 0.441). The Nothofagus species were separated from other ER species with respect to the first NMDS axis. Nevertheless, there was significant dissimilarity in traits between CR and ER species (Global R = 0.30, P = 0.002) (Figure 4). SIMPER indicated that 60% of the dissimilarity between CR and ER species was contributed by maximum net assimilation traits and Rd-mass: Amax-area, 10–11% (shade and sun plants respectively); Amax-mass, 9% each; D-Amax-area, 8%; Rd-mass, 7–8%. The first axis of the NMDS correlated negatively with Weibull c, but not so strongly as Amax-area (Table 5).

Figure 4. NMDS plot of assimilation traits of seedlings of 20 New Caledonian rain-forest tree species showing regeneration categories. Open circles, monodominants; filled black circles, subordinates; ga and pw are subordinates with uncategorized regeneration. 2D stress = 0.11. Species codes are explained in Table 1 caption. CR, continuously regenerating species; ER, episodically regenerating species.
DISCUSSION
Monodominance and succession
There was no clear evidence of superior photosynthetic performance of monodominant species in either light treatment. Although monodominants in the sun treatment had higher maximum assimilation rates (Amax-area) than subordinate species on average, they were not higher than those of ER subordinate species (A. neocaledonica, C. discolor and H. lucens). Amax of monodominant species was very plastic across growth treatments, but again, not higher than that of ER subordinate species. The high Amax-area and its high plasticity is typical of SIT species (Bazzaz Reference BAZZAZ1979, Boardman Reference BOARDMAN1977). Notably, C. discolor, which may also form monodominant stands (Ibanez & Birnbaum Reference IBANEZ and BIRNBAUM2014), had leaf-level traits consistent with SIT monodominance, but A. lanceolata, which can dominate small stands (Manauté et al. Reference MANAUTÉ, JAFFRÉ, VEILLON, KRANITZ, Bieleski and Wilcox2009) had traits more consistent with CR species.
Successional replacement of SIT by ST species is commonly associated with higher net assimilation rates, lower LCP and Rd and higher SLA of tolerant species at low irradiances (Bazzaz Reference BAZZAZ1979, Niinemets Reference NIINEMETS2006, Turner Reference TURNER2001). In our study the ER species predicted to be replaced by CR species in the hypothetical absence of large-scale disturbance had high Amax-area and high plasticity in Amax-area, typical of SIT early-successional trees (Strauss-Debenedetti & Bazzaz Reference STRAUSS-DEBENEDETTI and BAZZAZ1991). As predicted, there was also evidence of poor performance of ER species, including monodominants, at low irradiances compared with CR species; Rd (area and mass basis) was lower in shade plants of CR species, but no difference in LCP was detected between ER and CR species. The shade level used in this study limits interpretation of some aspects of shade tolerance. Deeper shade, closer to that recorded in the forest understorey, would likely lead to greater reduction in Amax-area in SIT species and to detectable differences in LCP between ST and SIT species, especially given the correlation of LCP with Rd (area and mass basis) in shade plants. In addition, growth in deeper shade would have clarified differences in the degree of photosynthetic shade tolerance among CR species, and differences in shade-related seedling persistence across all species.
The species groups were not completely uniform in their traits. In particular, of the monodominant species, Amax-mass in C. candelabra was twice as high as in other species, associated with a high SLA. Arillastrum gummiferum displayed a high LCP and Rd-area compared with other monodominants, typical of SIT species, but Nothofagus spp. had relatively low Rd-mass. Of the CR species, A. granulosa had relatively high Amax-mass, again associated with relatively high SLA. Nevertheless, there was still a relatively high degree of within-group similarity, except in the subordinate group which includes both ER and CR species.
Monodominance in tropical forests is often persistent due to ST dominants (Connell & Lowman Reference CONNELL and LOWMAN1989, Hart Reference HART1990, Henkel et al. Reference HENKEL, MAYOR and WOOLLEY2005, Nascimento et al. Reference NASCIMENTO, BARBOSA, VILLELA and PROCTOR2007, Peh et al. Reference PEH, LEWIS and LLOYD2011, Torti et al. Reference TORTI, COLEY and KURSAR2001). Monodominance may be non-persistent in short-lived trees, e.g. Musanga cecropioides in Nigeria (Ross Reference ROSS1954), but has been reported less often in long-lived (> 100 y) rain-forest trees, e.g. Maesopsis eminii in Uganda (Eggeling Reference EGGELING1947), Shorea albida in Sarawak (Anderson Reference ANDERSON1964) and Backhousia bancroftii in Australia (Connell & Lowman Reference CONNELL and LOWMAN1989). In particular, the apparent shade-intolerance and limited regeneration in closed forest of long-lived monodominant species in New Caledonia matches traits of Microberlinia bisulcata (Caesalpiniaceae), a long-lived dominant of forest groves in Central Africa with SIT seedlings (Newbery et al. Reference NEWBERY, PRAZ, VAN DER BURGT, NORGHAUER and CHUYONG2010). Disturbance appears to be pivotal in facilitating canopy dominance by M. bisulcata (Newbery et al. Reference NEWBERY, VAN DER BURGT and MORAVIE2004, Reference NEWBERY, VAN DER BURGT, WORBES and CHUYONG2013), as is also the case for Nothofagus spp. and C. candelabra (Read & Jaffré Reference READ and JAFFRÉ2013, Read et al. Reference READ, SANSON, BURD and JAFFRÉ2008). No data on population dynamics are available for monodominant A. gummiferum forests, but disturbance appears to be necessary for regeneration of A. gummiferum in rain forest on iron crust soils (McCoy et al. Reference MCCOY, JAFFRÉ, RIGAULT and ASH1999) and in Nothofagus-dominated and mixed rain forests (Read & Jaffré Reference READ and JAFFRÉ2013).
Assimilation traits and shade-tolerance
Not all studies have shown effective shade-tolerance to be associated with higher assimilation rates and lower LCP and Rd at low irradiances than in SIT species. For example, seedlings of ST rain-forest species on Barro Colorado Island did not have the expected higher assimilation rates at low irradiances compared with SIT species, with no correlation between any leaf-level assimilation trait, or its plasticity, and seedling survival rates in shade (Kitajima Reference KITAJIMA1994). Givnish (Reference GIVNISH1988) noted the importance of integrating other costs related to the production and maintenance of a leafy canopy to understand whole-plant energy capture, with, for example, night respiration, leaf construction, and supporting stem and root costs increasing the effective light compensation point substantially. Nevertheless, whole-plant LCP, for example, correlated positively with leaf-level traits of Bornean rain-forest saplings, including LCP, Rd (mass or area basis) and Amax (mass or area basis) (Baltzer & Thomas Reference BALTZER and THOMAS2007). Furthermore, seedling data from 115 tree species showed significantly lower LCP and Rd-area in known shade-tolerant species, presumed to contribute to higher carbon balance and survival in severe shade (Craine & Reich Reference CRAINE and REICH2005). Low Rd has often been recorded in ST seedlings (Lusk & Reich Reference LUSK and REICH2000, Reich et al. Reference REICH, WRIGHT, CAVENDER-BARES, CRAINE, OLEKSYN, WESTOBY and WALTERS2003) and saplings (Baltzer & Thomas Reference BALTZER and THOMAS2007) and attributed to a conservation strategy, but is also consistent with the carbon gain hypothesis. Differential capacities for utilisation of sunflecks might also contribute significantly to tolerance of shaded understoreys (Pearcy Reference PEARCY1988), but were not tested in our study.
Traits other than leaf-level assimilation can contribute to seedling survival in shaded understoreys. These include carbon storage (Kobe Reference KOBE1997, Myers & Kitajima Reference MYERS and KITAJIMA2007), tolerance of pathogens, herbivores and mechanical damage (Augspurger Reference AUGSPURGER1984a, b; Canham et al. Reference CANHAM, KOBE, LATTY and CHAZDON1999, Kitajima Reference KITAJIMA1994, McCarthy-Neumann & Kobe Reference MCCARTHY-NEUMANN and KOBE2008, Vaartaja Reference VAARTAJA1962) and large seeds allowing greater reserves of carbon in the case of young seedlings (Grubb & Metcalfe Reference GRUBB and METCALFE1996, Niinemets Reference NIINEMETS2006, Osunkoya et al. Reference OSUNKOYA, ASH, HOPKINS and GRAHAM1994, Walters & Reich Reference WALTERS and REICH2000). No difference in SLA was found between monodominants and subordinates, or CR and ER species in our study, but other aspects of biomass allocation may differ between these groups and contribute to shade tolerance. In particular, given the low nutrient contents of the soils on which these forests develop (Jaffré & Veillon Reference JAFFRÉ and VEILLON1990, Read et al. Reference READ, JAFFRÉ, FERRIS, MCCOY and HOPE2006b), efficient uptake and utilization of nutrients through efficient biomass allocation and physiology (Hidaka & Kitayama Reference HIDAKA and KITAYAMA2013) might contribute to differences in whole-plant energy capture and hence to patterns of regeneration and dominance.
We have emphasized the contrasting responses of SIT and ST species, but since shade tolerance is a continuum (Davies Reference DAVIES1998, Montgomery & Chazdon Reference MONTGOMERY and CHAZDON2002), there is opportunity for resource gradient partitioning even in very shaded environments. If these monodominant forests were to escape large-scale disturbance in the long term, they are predicted to eventually become dominated by shade-tolerant trees (Read & Jaffré Reference READ and JAFFRÉ2013). Even the mixed-canopy forests adjacent to the monodominant Nothofagus forests include many secondary species, and are predicted to progress to shade-dominated forests in the absence of large-scale disturbance (Read & Jaffré Reference READ and JAFFRÉ2013). However, shade-tolerant species vary in their physiological and growth responses to light and this, together with light heterogeneity in the understorey, will add complexity to recruitment patterns (Montgomery & Chazdon Reference MONTGOMERY and CHAZDON2002) and thereby to predictions of temporal changes in diversity and dominance. Furthermore, the incidence of wildfires and cyclones in this region may render such predictions purely hypothetical (Read & Jaffré Reference READ and JAFFRÉ2013) and contribute to the predominance of non-persistent shade-intolerant rather than persistent shade-tolerant monodominance in New Caledonia.
CONCLUSIONS
Our study confirmed that seedlings of monodominant and other ER species have some typical traits of SIT species, in particular high leaf-level assimilation rates in sunny conditions that should facilitate high rates of net productivity and potential preemption of resources in disturbed, high-light environments. Conversely, CR species had traits more typical of ST species, in particular lower Rd in shade plants than ER species, with potentially positive effects on carbon balance compared with ER species in deep shade, and consequently on recruitment in less-disturbed environments. Hence leaf-level assimilation traits of seedlings largely matched the postulated population dynamics and successional stage of these species, although did not fully explain the capacity for monodominance in some species.
ACKNOWLEDGEMENTS
We gratefully acknowledge Vale New Caledonia for allowing the experiment to be undertaken at their Environmental Conservation Service nursery facilities, and their staff for their invaluable assistance in preparing and maintaining the seedling experiment. We thank G. Sanson and A. Warren for assistance during the experiment, and the Committee for Research and Exploration of the National Geographic Society for supporting this study as part of a larger project (Grant #8798-10).


