


INTRODUCTION
Variation in trunk circumference is commonly used to evaluate tree secondary growth, with the basic assumption that secondary growth is the main factor leading to variation in circumference. However, variation in girth increment is the algebraic sum of secondary growth produced by cell division in cambial tissues and biophysical processes such as the change in turgidity of cells in the cambial zone or variation in bark water content (Holbrook Reference HOLBROOK and Gartner1995, Scholz et al. Reference SCHOLZ, BUCCI, GOLDSTEIN, MEINZER, FRANCO and MIRALLES-WILHELM2008, Zweifel et al. Reference ZWEIFEL, ITEM and HÄSLER2000, Reference ZWEIFEL, ZIMMERMANN, ZEUGIN and NEWBERY2006), which can lead to shrinkage or swelling of the trunk (Daudet et al. Reference DAUDET, AMEGLIO, COCHARD, ARCHILLA and LACOINTE2005, Zweifel & Häsler Reference ZWEIFEL and HÄSLER2000). As a result, seasonal variation in circumference does not necessarily emphasize seasonal variation in secondary growth.
Despite high annual rainfall, tropical rain forests are subject to a large seasonal variation in soil water availability (Malhi & Phillips Reference MALHI and PHILLIPS2005) that influences carbon and water cycles (Bonal et al. Reference BONAL, BOSC, PONTON, GORET, BURBAN, GROSS, BONNEFOND, ELBERS, LONGDOZ, EPRON, GUEHL and GRANIER2008, Hutyra et al. Reference HUTYRA, MUNGER, SALESKA, GOTTLIEB, DAUBE, DUNN, AMARAL, DE CAMARGO and WOFSY2007) and tree secondary growth (Borchert Reference BORCHERT1999, Worbes Reference WORBES1999). In these ecosystems, large seasonal variation in the rate of change in girth has been found. Negative rates were usually observed during seasonal dry periods, followed by highly positive ones during the following wet periods (Baker et al. Reference BAKER, AFFUM-BAFFOE, BURSLEM and SWAINE2002, Reference BAKER, BURSLEM and SWAINE2003a, Reference BAKER, SWAINE and BURSLEM2003b, Brienen & Zuidema Reference BRIENEN and ZUIDEMA2005, da Silva et al. Reference DA SILVA, DOS SANTOS, TRIBUZY, CHAMBERS, NAKAMURA and HIGUCHI2002, Daubenmire Reference DAUBENMIRE1973, Détienne & Mariaux Reference DÉTIENNE and MARIAUX1977, Prévost & Puig Reference PRÉVOST and PUIG1981, Puig & Prévost Reference PUIG and PRÉVOST1986, Reich & Borchert Reference REICH and BORCHERT1984, Worbes Reference WORBES1999). The range of variation during dry periods even exceeded annual secondary growth for some trees (Breitsprecher & Bethel Reference BREITSPRECHER and BETHEL1990, Pérez et al. Reference PÉREZ, CARMONA, ARAVENA, FARINA and ARMESTO2009).
This variation has been associated with variation in climatic factors. The direct influence of incident solar radiation levels is still under debate. A possible negative effect of cloudiness on tree growth was discussed by Clark & Clark (Reference CLARK and CLARK1994) in a tropical rain forest in Costa Rica while no influence of solar radiation was observed in Ghana (Baker et al. Reference BAKER, BURSLEM and SWAINE2003a). Several studies emphasized a positive relationship between rainfall and the rate of change in girth (Brienen & Zuidema Reference BRIENEN and ZUIDEMA2005, Bullock Reference BULLOCK1997, Puig & Prévost Reference PUIG and PRÉVOST1986, Worbes Reference WORBES1999), but none of these studies clearly explained the physiological mechanisms leading to this relationship. One possible explanation could lie in the negative impact of decreased soil water availability induced by variation in rainfall on leaf phenology and tree secondary growth (Baker et al. Reference BAKER, AFFUM-BAFFOE, BURSLEM and SWAINE2002, Borchert Reference BORCHERT1999). Furthermore, for temperate conifers, Zweifel et al. (Reference ZWEIFEL, ZIMMERMANN, ZEUGIN and NEWBERY2006) suggested a positive effect of rainfall on secondary growth through a release of the highly negative pressure conditions in the cambium during drier soil conditions. Finally, Baker et al. (Reference BAKER, BURSLEM and SWAINE2003a) concluded that the influence of variation in atmospheric relative humidity should be explored. Indeed, stem volume of temperate coniferous trees varied with the amount of water stored in wood and bark tissues, in association with relative humidity (Gall et al. Reference GALL, LANDOLT, SCHLEPPI, MICHELLOD and BUCHER2002, Zweifel & Häsler Reference ZWEIFEL and HÄSLER2001, Zweifel et al. Reference ZWEIFEL, ITEM and HÄSLER2000). Furthermore, bark chemical composition and morphological characteristics may modulate water exchange between wood tissues and atmosphere (Steppe et al. Reference STEPPE, SAVEYN, MCGUIRE, LEMEUR and TESKEY2007). Thus, since large interspecific differences in sapwood and bark thickness and water content do exist among tropical rain-forest species (Hegde et al. Reference HEGDE, CHANDRAN and GADGIL1998, Roth Reference ROTH1981), seasonal variation in atmospheric relative humidity might influence bark and sapwood water storage and then tree circumference. To our knowledge, no comprehensive study to test this direct effect has yet been conducted in tropical rain forests.
In this study, we took advantage of variable seasonal atmospheric conditions in the Neotropical rain forest in French Guiana (Bonal et al. Reference BONAL, BOSC, PONTON, GORET, BURBAN, GROSS, BONNEFOND, ELBERS, LONGDOZ, EPRON, GUEHL and GRANIER2008) to analyse the origin of the seasonal variation in the rate of change in girth of a large set of trees (n = 182). We hypothesized that seasonal variation in relative humidity would affect bark water content and thickness and then influence measured trunk circumference. Furthermore, we conducted a desiccation experiment in the laboratory to test the direct effect of chamber relative humidity on bark water content and thickness.
STUDY SITE
This study was conducted at Paracou, French Guiana, South America (5°16′54′N, 52°54′44′W), where the climate is influenced by the north/south movements of the Inter-Tropical Convergence Zone that causes large seasonal variation in rainfall and atmospheric relative humidity (Figures 1, 2). For more information on climatic conditions at this site, refer to Bonal et al. (Reference BONAL, BOSC, PONTON, GORET, BURBAN, GROSS, BONNEFOND, ELBERS, LONGDOZ, EPRON, GUEHL and GRANIER2008). This study lasted almost 2 y, beginning in March 2007. It covered two long dry seasons (from September to mid-November 2007 and 2008), two transition periods between the dry and the wet season (from mid-November to the end of January), here further referred to the ‘dry-to-wet transition period’, two long wet seasons from February to June, and two transition periods between the wet and the dry season (from July to August). A long dry season is characterized by 3–4 mo with less than 100 mm mo−1 precipitation.
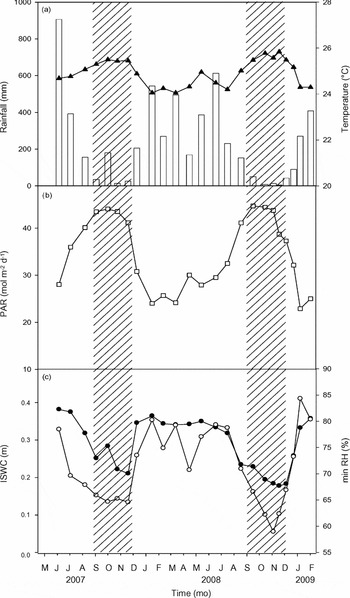
Figure 1. Seasonal variation in climatic variables over the study period. Each data point corresponds to the daily mean, minimum, or sum of each variable between two measurement dates: sum of rainfall (bars) and mean of air temperature (▲) (a), sum of photosynthetic active radiation (PAR) (□) (b), and minimum atmospheric relative humidity (minRH) (◯) and index of soil water content (ISWC) (●) (c). Hatched areas correspond to the long dry seasons in 2007 and 2008.

Figure 2. Average monthly rainfall over the past decade (1996–2005) (+1 SE) at Paracou, French Guiana. Hatched areas correspond to the long dry season.
Measurements were conducted in one plot (1 ha) set up in 2003 in the footprint of the flux tower at the Guyaflux experimental unit (Bonal et al. Reference BONAL, BOSC, PONTON, GORET, BURBAN, GROSS, BONNEFOND, ELBERS, LONGDOZ, EPRON, GUEHL and GRANIER2008) and located on terra firme forest. In this plot, tree density averages 647 trees ha−1 (dbh >10 cm) and tree species richness is about 110 species ha−1. In terra firme forest, trees experience no periods of flooding even during the rainy season and have no access to the riparian water table.
METHODS
Tree selection
We selected 147 dominant trees whose crowns received direct light or at least some direct side light, i.e. Dawkins crown classification (Dawkins Reference DAWKINS1958) of 4 or 5, and 46 suppressed trees whose crowns were overtopped, i.e. Dawkins crown classification of 1 to 3. Our sampling then covered 59 species, with 1 to 12 individuals per species, with a large range of growth and dynamic characteristics (Favrichon Reference FAVRICHON1998). Tree dbh ranged between 9.8 and 100.0 cm.
In order to illustrate different seasonal patterns among trees, trees were split into five groups representing the main patterns based on total annual growth (presence or absence) and seasonal variation in the rate of change in girth (intra-annual variation related to seasons, no seasonality, complex intra-annual variation not related to seasons).
Stem growth measurements
Seasonal changes in trunk circumference were monitored using home-made steel dendrometer bands (Cattelino et al. Reference CATTELINO, BECKER and FULLER1986) with a precision of 0.2 mm. Dendrometers were installed between January and February 2007. Before installing the bands, each trunk was gently scrubbed in order to remove algae, lichens and cork (outer dead bark) and to facilitate the initial contact between the trunk and the band. Bands were placed at 1.3 m height or 0.5 m above the top of any buttress, up to 6.0 m. In order to control for potential vertical movement of the band, a mark of paint was made on the band and the tree. Data were recorded twice a month during long dry seasons and once a month the rest of the year. An adjustment period of the dendrometers to the trunk during which data are not reliable is usually observed (Baker et al. Reference BAKER, BURSLEM and SWAINE2003a, Keeland & Sharitz Reference KEELAND and SHARITZ1993). On 15 trees, we duplicated dendrometers after 1 y of measurements and observed that after 2 mo readings were not significantly different. Thus, the first 2 mo of measurements were discarded. Over the study period, 11 of the selected dominant trees died, either from natural death or following the fall of surrounding trees. These trees were discarded from the analysis. Furthermore, 21 trees shed their leaves. In order to avoid any confounding effect with the influence of changing environmental conditions, circumference data were discarded from the analyses when the trees were leafless.
Based on circumference data (C), we calculated the rate of change in girth across the interval t1 to t2 (mm d−1) following this equation:
Leaf water status
On a subsample of the trees (n = 56 and 62 in the long dry season in 2007 and 2008, respectively), predawn and midday leaf water potentials were determined on one branch per tree on similarly sunny days in each season using a Scholander-type pressure chamber (model 1000, PMS Instruments, Corvalis, OR, USA). These measurements were conducted at the end of the dry season (mid-November) following a long dry spell. Predawn and midday measurements were conducted on the same day. Midday leaf water measurements were also performed during the 2008 wet season, on the same trees than during the long dry seasons.
Wood properties
On a subsample of the trees (n = 119), wood cores were extracted with an increment borer (model 10-100-1024, Haglöf Sweden AB, Långsele, Sweden) at the beginning of the long dry season (September) with a 5.15-mm diameter borer about 0.5 m away from the dendrometer bands or between the buttresses when they were higher than 1.5 m. The length of the cores depended on tree diameter and on sapwood thickness (mean = 0.15 m). The thickness of the bark (rhytidome, parenchyma, phloem and cambial tissues) was determined directly in the forest using a bark thickness gauge (Suunto Oy, Vantaa, Finland) and a piece of bark was collected with an increment hammer (Haglöf Sweden AB, Långsele, Sweden) for further water content and specific gravity estimations. After extraction, wood cores and bark pieces were put immediately in a hermetic tube to avoid desiccation. In the laboratory, sapwood thickness was measured using a digital micrometer (500–181U, Mitutoyo Instruments, Singapore). The different types of tissue were obtained based on their colour differentiation (heartwood is generally darker) and the presence of tyloses. After determining each tissue type, its fresh mass and fresh volume were measured. Volume was estimated by submerging the sample in a container with water. Dry mass was determined after wood samples were oven-dried for 48 h at 105 °C. Sapwood and bark specific gravity were calculated as the ratio of dry mass to fresh volume. Water content of sapwood and bark were calculated as the ratio of the difference between fresh mass and dry mass to the dry mass.
Climatic variables
We used climatic data (air temperature at 2.0 m high, atmospheric relative humidity at 2.0 m high, photosynthetic active radiation above canopy, and rainfall above canopy) from a complete automatic weather station installed on the Guyaflux tower (see Bonal et al. Reference BONAL, BOSC, PONTON, GORET, BURBAN, GROSS, BONNEFOND, ELBERS, LONGDOZ, EPRON, GUEHL and GRANIER2008 for details) in order to test their influence on seasonal variation in the rate of change in girth. These data were automatically recorded every minute with a CR23X datalogger (Campbell Scientific Inc., Logan, UT, USA) and averaged or summed each day, except for relative humidity for which the minimum daily value was considered. Daily mean soil water content in the plot was estimated using a time domain reflectometry probe (TRIME FM3, Imko, Ettlingen, Germany) inserted every 0.2 m in a 2.6-m-long tube that was located near the middle of the plot and that was set up in 2003 in the framework of a comprehensive estimation of soil water content in the footprint of the flux tower (Bonal et al. Reference BONAL, BOSC, PONTON, GORET, BURBAN, GROSS, BONNEFOND, ELBERS, LONGDOZ, EPRON, GUEHL and GRANIER2008). Soil water content data were recorded at a frequency of about 2–3 wk over the study period. Based on these data, we calculated an index of soil water content (between 0.2 and 1.0 m) based on the model proposed by Bonal et al. (Reference BONAL, BOSC, PONTON, GORET, BURBAN, GROSS, BONNEFOND, ELBERS, LONGDOZ, EPRON, GUEHL and GRANIER2008). We restricted the calculations of this index to this layer because roots of Neotropical rain-forest trees mainly colonize the upper soil layers (Cairns et al. Reference CAIRNS, BROWN, HELMER and BAUMGARDNER1997, but see Nepstad et al. Reference NEPSTAD, CARVALHO DE, DAVIDSON, JIPP, LEFEBVRE, NEGREIROS, DA SILVA, STONE, TRUMBORE and VIEIRA1994) and about 80% of root biomass is located in the first 1.0 m depth (Jackson et al. Reference JACKSON, CANADELL, EHLERINGER, MOONEY, SALA and SCHULZE1996).
Chamber experiment
In the laboratory, in March 2009, we tested in a desiccation experiment whether variation in chamber relative humidity would influence the circumference of a trunk section. We were able to test only one piece at once, and the experiment was conducted on nine different trees representing nine species. These species were chosen among the one sampled in the forest experiment. They covered a large range of sapwood and bark characteristics found at the Paracou site (Ollivier et al. Reference OLLIVIER, BARALOTO and MARCON2007) (Table 1) and the different seasonal patterns in the rate of change in girth previously observed during the long dry seasons in 2007 and 2008. Each test lasted about 1 wk. The trees were cut near the Paracou forest and two consecutive sections of about 0.7 m long each were sampled near the base of the trunk. These sections were immediately put in plastic bags and transported to the laboratory. Initial trunk diameter was between 15.8 and 25.7 cm. One trunk section was used to calculate bark and sapwood water content before the experiment. The other trunk section was installed in a climatic chamber that allows controlling for air temperature and relative humidity. Air temperature was maintained constant at 30 °C during the experiment and two levels of desiccation were used: 90% over the first day and 40% over the four following days. The first day was used to standardize the external humidity of the trunk section. At both ends of the trunk section, we used grease to avoid any water loss (Zweifel et al. Reference ZWEIFEL, ITEM and HÄSLER2000). Two pairs of displacement gauges (Mitutoyo absolute digimatic, Mitutoyo Instruments, Singapore) were placed in two opposite radial positions in the middle of the trunk section, after slightly scrubbing on the contact point, in order to measure variation in trunk radial dimensions. Measurements were recorded each day. The daily variation in diameter was then calculated based on the averaged gauge variation. At the end of the experiment, water content of bark, sapwood and heartwood was estimated.
Table 1. Characteristics of the nine trees selected for the desiccation experiment in the laboratory. B corresponds to bark and S corresponds to sapwood. Species abbreviations are in parentheses. Wood specific gravity and water content are given on a dry-mass basis.

Statistical analyses
As classically done in plant growth analysis studies (Poorter Reference POORTER1989), we conducted all statistical analyses on the relative rate of change in girth across the interval t1 to t2 calculated as follows:
In order to remove the temporal dependency of the relative rate of change in girth for a given tree, we conducted an autoregressive time series analysis using the ‘stats’ package (Brockwell & Davis Reference BROCKWELL and DAVIS1991) from the R project software (http://www.r-project.org). Using the residuals from this analysis, we then conducted a repeated-measures analysis of variance using the JUMP 5.0.1 software (SAS Institute) to test any tree status (dominant vs. suppressed trees) or date of measurement effect on the relative rate of change in girth. These analyses were performed on all trees irrespective of their intra-annual pattern (i.e. including all five groups).
The influence of environmental variables on the relative rate of change in girth was analysed using a principal component regression (PCR) method using the PLS package (Mevik & Wehrens Reference MEVIK and WEHRENS2007) from the R project software (http://www.r-project.org). This analysis was performed because it allows disentangling the effect of each tested environmental variable, even though these variables are highly significantly correlated with each other. In order to disentangle these effects, the PCR analysis makes complex regressions of the relative rate of change in girth on the projection of the environmental variables on the axes of a principal components analysis between these variables. This analysis was performed on the residuals from the autoregressive time-series analysis. We used the daily mean, minimum, or sum of each variable between two measurement dates to test these effects.
We used linear regression models (1) to analyse the relationship between tissue properties and the rate of change in girth during the long dry season in 2008 and the dry-to-wet transition period in 2009; (2) to test the relationship between total annual circumference increment and negative values of the rate of change in girth during the long dry season in 2008; and (3) to test the relationship between predawn and midday leaf water potential and the rate of change in girth during the long dry season in 2008. Furthermore, we clumped trees into two groups depending on whether they displayed positive or negative rates of change in girth values during the 2008 long dry season. Then, we tested any group effect on predawn or midday leaf water potential using an ANOVA. Finally, we tested the relationship between variation in the diameter of trunk sections between 90% and 40% relative humidity and variation in sapwood and bark water content.
RESULTS
As expected, our study period covered large seasonal variation in climatic conditions (Figure 1). The long dry seasons were characterized by a strong decrease in soil water content and by lower averaged daily minimum atmospheric relative humidity as compared to wet-season periods. Seasonal variation in solar radiation was observed, in association with variation in extraterrestrial solar radiation (peaks in April and September) and cloud cover related to the presence of the Inter-Tropical Convergence Zone. Seasonal variation in temperature remained low, with a mean annual temperature of 24.9 °C (Figure 1). The 2007 long dry season was considered as a La Niña period (www.cpc.noaa.gov/products/analysis_monitoring/ensostuff/ensoyears.shtml), whereas the long dry season in 2008 was among the most severe dry periods in French Guiana over the past decade (Figures 1, 2). In 2008, the amount of rainfall during the long dry season was lower than in 2007, resulting in a stronger soil water deficit in 2008 as compared to 2007. Furthermore, lower daily minimum relative humidity values were reached at the end of the long dry season in 2008 as compared to 2007.
On average, bark thickness was about one tenth of sapwood thickness (Table 2). The percentage of bark in trunk radius consistently represented about 10% of the percentage of sapwood in trunk radius, despite large differences in diameter among trees (Table 2). Specific gravity in bark was lower than in sapwood and water content in bark was on average double that in sapwood (Table 2).
Table 2. Bark and sapwood properties at breast height at the beginning of the long dry seasons.

We observed large seasonal variation in the rate of change in girth for dominant trees (Figure 3a). There was a significant effect of seasons on the rate of change in girth (P < 0.001). This change was significantly lower (negative values) during long dry periods as compared with dry-to-wet transition periods (mainly positive ones), and the values during the long wet season were intermediate. During the dry-to-wet transition periods, the majority of the trees (75% and 82% in 2008 and 2009, respectively) displayed positive rates of change in girth (average values = 0.048 and 0.047 mm d−1 in 2008 and 2009, respectively), only three and two trees displaying negative values during these seasons in 2008 and 2009, respectively. In contrast, 27% of the trees displayed a decrease in girth during the long dry season in 2007 (average of negative values = −0.014 mm d−1) and this decrease was more pronounced during the long dry season in 2008 (average of negative values = −0.024 mm d−1). For suppressed trees, similar seasonal variation in the rate of change in girth was found, even though within a lower range (Figure 3b).

Figure 3. Boxplot of the rate of change in girth for dominant (n = 136) (a) and suppressed (n = 46) (b) trees. The boxes represent the lower and upper quartile, with the median as the horizontal line. The whisker caps represent the lower and upper 10th percentiles, and the ● represent the lower and upper 5th percentiles. Hatched areas correspond to the long dry seasons in 2007 and 2008.
For those trees which displayed negative rates of change in girth during the long dry seasons, the averaged values during long dry seasons were in the same order of magnitude than the total annual circumference increment observed over the study period (average = 0.020 and 0.017 mm d−1 for 2007 and 2008, respectively). Furthermore, there was no relationship between total annual circumference increment and the negative values during the long dry seasons (P = 0.54).
An illustration of the five main patterns in seasonal variation in the rate of change in girth is given in Figure 4. Tree no. 350 (Symphonia sp. 1) represented trees with stable values over the study period and high cumulative annual girth increment (41.2% of the total number of trees). These trees do not display any seasonal variation in the rate of change in girth even though their growth rate is high. Tree no. 124 (Chrysophyllum sanguinolentum, species nomenclature follows Boggan et al. Reference BOGGAN, FUNK, KELLOFF, HOFF, CREMERS and FEUILLET1997) represented trees with large seasonal variation in the rate of change in girth and high cumulative annual girth increment (25.7%). These trees display highly negative values in long dry seasons and highly positive values in short wet seasons, and annual growth is high. Tree no. 361 (Vouacapoua americana) represented trees with intra-annual variation in the rate of change in girth but no annual girth increment (4.4%). These trees display negative or positive values during the year and the annual sum of the rates of change in girth is close to nil. Tree no. 76 (Eschweilera coriacea) represented trees without any seasonal change in the rate of change in girth and no annual girth increment (5.9%). The fifth group which encompassed all other patterns was not illustrated in Figure 4.
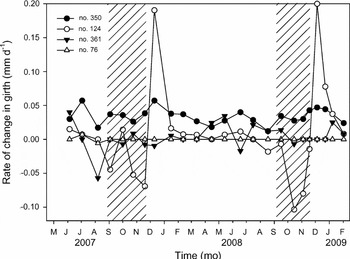
Figure 4. An illustration of different patterns in seasonal variation in the rate of change in girth. Tree no. 350 (●) represents trees with continuous rate of change in girth values and high cumulated annual girth increment. Tree no. 124 (◯) represents trees with large seasonal variation in the rate of change in girth and high cumulated annual girth increment. Tree no. 361 (▼) represents trees with high seasonal patterns in the rate of change in girth but no annual girth increment. Tree no. 76 (△) represents trees without any seasonal change in the rate of change in girth and no annual girth increment. Hatched areas correspond to the long dry seasons in 2007 and 2008.
We observed a significant effect of all environmental variables on the relative rate of change in girth (Table 3). The first axis of the PCR model explained 85.7% of the total variance and only this axis was then considered in the following tests (jack-knife statistics). Air temperature and irradiance were negatively correlated with the relative rate of change in girth, while the three other variables (relative humidity, rainfall and the index of soil water content) were positively correlated.
Table 3. Results from the Principal Component Regression on the residuals of the autoregressive time-series analysis on the relative rates of change in girth between each date of measurement, over the 18-mo period. This test was performed only on dominant trees (n = 136).

Variation in the rate of change in girth during the long dry season in 2008 was negatively correlated with bark water content (P = 0.010, R2 = 0.19) and bark thickness (P = 0.009, R2 = 0.19) measured before the dry season (Figure 5a, b). In contrast, variation in the rate of change in girth during the dry-to-wet transition period in 2009 were positively correlated with bark thickness before the dry season (P = 0.010, R2 = 0.07), but not with bark water content (P > 0.10) (Figure 5c, d). There was no significant effect of bark specific gravity on the rate of change in girth in either long dry or dry-to-wet transition periods (P > 0.10, data not shown).

Figure 5. Relationship between the rate of change in girth during the 2008 long dry season (a and b) or during the dry-to-wet transition period in 2009 (c and d) and bark water content (left) or thickness (right). Only those trees that displayed negative girth changes during the long dry season in 2008 are represented in (a) and (b), and only those trees that displayed positive values during the dry-to-wet transition period in 2009 are represented in (c) and (d).
Predawn or midday leaf water potential did not differ among trees which displayed either positive or negative rates of change in girth in the long dry season in 2008 (P = 0.430). Furthermore, we did not find any relationship between negative values in the long dry season and leaf water potential (P = 0.140 and P = 0.490 for predawn and midday values, respectively).
In the laboratory experiment, for all trees except one (Virola michelii), desiccation induced a decrease in the diameter of the trunk sections (Figure 6). This decrease ranged from 0.08% to 1.73% of the initial diameter of the trunk sections. Variation in the diameter of the trunk sections from 90% to 40% of chamber relative air humidity were significantly correlated with the difference in water content in bark (P = 0.020, R2 = 0.56), but not with the difference in water content in sapwood (P = 0.418) (Figure 7).

Figure 6. Change in trunk section diameter in the climatic chamber at 40% of relative air humidity. Each trunk section was enclosed in the climatic chamber for about 4 d. Virola michelii (Vm), Lecythis persistens (Lp), Licania membranacea (Lm), Goupia glabra (Gg), Eperua falcata (Ef), Symphonia sp. 1 (Ssp), Sterculia pruriens (Sp), Chrysophyllum sanguinolentum (Cs), Pradosia cochlearia (Pc). Species nomenclature follows Boggan et al. (Reference BOGGAN, FUNK, KELLOFF, HOFF, CREMERS and FEUILLET1997).

Figure 7. The relationship between the change in trunk section diameter and the difference in water content in bark (●) or in sapwood (□) between 90% and 40% relative humidity in the climatic chamber. Species abbreviations are detailed in Figure 6.
DISCUSSION
We confirmed large seasonal variation in the rate of change in girth of tropical rain-forest tree species. A large proportion of the trees displayed a strong increase in girth at the onset of the wet season, whereas about one quarter of the trees displayed negative rates of change in girth during long dry seasons. The observed patterns were consistent with previous observations in Palaeotropical (Baker et al. Reference BAKER, AFFUM-BAFFOE, BURSLEM and SWAINE2002, Reference BAKER, BURSLEM and SWAINE2003a, Reference BAKER, SWAINE and BURSLEM2003b) and Neotropical rain forests (Puig & Prévost Reference PUIG and PRÉVOST1986, Worbes Reference WORBES1999), but the observed range in seasonal variation was higher than previous observations. The large tree and species sampling conducted in our study (182 trees, 59 species) and the highly contrasted seasonal variation in climatic conditions encountered in French Guiana, particularly in 2008, probably contributed to these differences.
The observed range in negative values during the long dry seasons was in the same range than the annual mean circumference increment in the study plot and much higher than any bias that could be linked with dendrometer measurements (precision 0.2 mm). Furthermore, over the 2 y of study, about 10% of the trees displayed no annual circumference increment, and within this group, half of the trees displayed seasonal variation in the rate of change in girth. Our results then confirmed that biological processes other than growth could explain seasonal variation in girth, as previously discussed (Daudet et al. Reference DAUDET, AMEGLIO, COCHARD, ARCHILLA and LACOINTE2005, Holbrook Reference HOLBROOK and Gartner1995, Scholz et al. Reference SCHOLZ, BUCCI, GOLDSTEIN, MEINZER, FRANCO and MIRALLES-WILHELM2008, Zweifel et al. Reference ZWEIFEL, ITEM and HÄSLER2000). These biological processes were independent of tree annual growth and both fast- and slow-growing trees exhibited patterns of negative values during dry periods.
Seasonal variation in environmental conditions clearly contributes to explaining variation in the rate of change in girth. The three environmental variables associated with water (i.e. rainfall, soil water content, and atmospheric relative humidity) were all positively correlated with the rate of change in girth, confirming that not only soil, but also ambient atmospheric air conditions can contribute to seasonal variation. Several studies have already pointed to a correlation between rainfall or soil water content and the rate of change in girth in tropical rain forests (Baker et al. Reference BAKER, AFFUM-BAFFOE, BURSLEM and SWAINE2002, Reference BAKER, BURSLEM and SWAINE2003a, Reference BAKER, SWAINE and BURSLEM2003b, Bullock Reference BULLOCK1997, Pélissier & Pascal Reference PÉLISSIER and PASCAL2000, Worbes Reference WORBES1999). A direct negative effect of soil water availability on cambial activity during dry periods could contribute to these patterns (Borchert Reference BORCHERT1994, Reference BORCHERT1999, Worbes Reference WORBES1999). Furthermore, Baker et al. (Reference BAKER, AFFUM-BAFFOE, BURSLEM and SWAINE2002) suggested that under decreasing soil water availability, variation in water content in elastic storage tissues, not necessarily associated with a decrease in secondary growth, could contribute to explaining this variation. These authors also suggested that this variation was independent of variation in tree water potential and that larger trees would encounter higher seasonal variation in the rate of change in girth in association with limited root systems. In our study, we confirmed that variation in the rate of change in girth was independent of leaf water potentials but we did not find any relationship between negative rates of change in girth during long dry seasons and the diameter of the trees. Thus, our results tend to confirm that seasonal variation in the rate of change in girth does not necessarily illustrate a potential drought edaphic stress to these trees.
The positive correlation between the rate of change in girth and atmospheric relative humidity under natural conditions, and between bark water content and trunk section diameter in the chamber experiment, confirmed our hypothesis that shrinkage or swelling of trunk elastic tissues could be a main cause of the seasonal variation in the rate of change in girth. These results were consistent with previous observations on temperate (Gall et al. Reference GALL, LANDOLT, SCHLEPPI, MICHELLOD and BUCHER2002, Zweifel et al. Reference ZWEIFEL, ITEM and HÄSLER2000) or savanna trees (Scholz et al. Reference SCHOLZ, BUCCI, GOLDSTEIN, MEINZER, FRANCO and MIRALLES-WILHELM2008). Our results suggest that constantly high atmospheric relative humidity associated with heavy rain events at the onset of the wet period contributed to the swelling of the trunk. This swelling might occur not only through a positive effect of atmospheric relative humidity on bark water content, but also through the recharge of all woody tissues and further cell expansion and division (Borchert Reference BORCHERT1999, Zweifel et al. Reference ZWEIFEL, ZIMMERMANN, ZEUGIN and NEWBERY2006). In contrast, during long dry periods, we suspect that low daily minimum atmospheric relative humidity over several weeks contributed to the negative rates of change in girth. The observed shrinking of the trunk could reflect both a loss of water from the storage tissues related to low soil water content and a decrease in bark water content related to low atmospheric relative humidity. In addition to these biophysical processes, secondary growth might also vary during these dry periods (Borchert Reference BORCHERT1999, Worbes Reference WORBES1999). It could either buffer their impact if it remained high, or play a minor or no role if it decreased or even stopped during these periods.
The occurrence of a longer dry period in 2008 as compared to 2007, with midday atmospheric relative humidity reaching lower values in 2008, seemed to induce more negative rates of change in girth for those trees that appeared to be sensitive to these conditions in 2007. Furthermore, it also induced negative values for some new trees (n = 15) in the 2008 long dry season. This trend suggested the existence of a threshold of environmental conditions that can induce a decrease in girth. This threshold might vary highly among trees and species. The presence of a similar trend for suppressed and dominant trees suggested that this threshold does not depend on growth rate and light conditions, but rather on bark characteristics. Nevertheless, some trees did not display any change in the rate of change in girth with daily minimum atmospheric relative humidity, and we even observed a strange behaviour for one species (Virola michelii) in the chamber experiment. Whether differences among trees in hydrophilic compounds within the bark, such as pectin or hemicelluloses, would contribute to explaining these different responses is a worthwhile question.
Beside environmental variables associated with water, we observed a significant negative effect of temperature on the relative rate of change in girth, even though seasonal variation in temperature remained low at our site. The origin of this correlation remained unclear but was probably related to the significant correlation between temperature and other climatic variables (such as irradiance), without any direct effect on the relative rate of change in girth. The direct influence of irradiance levels on the relative rate of change in girth is still under debate (Baker et al. Reference BAKER, BURSLEM and SWAINE2003a, Clark & Clark Reference CLARK and CLARK1994) and we observed that lower irradiance levels during wet periods were associated with highly positive values. This negative relationship suggested that even though reduced incident solar radiation during wet seasons might contribute to decreased photosynthesis and tree secondary growth (Graham et al. Reference GRAHAM, MULKEY, KITAJIMA, PHILLIPS and WRIGHT2003) for tropical rain-forest trees in French Guiana, this effect was counterbalanced by the other biophysical processes. Such a counterintuitive relationship then suggested that those processes that are independent from growth were even more pronounced.
Among the wood compartments we identified in the trunk sections, bark displayed the highest change in water content during the desiccation experiment. Meanwhile, variation in water content of heartwood was nil (data not shown) and variation in sapwood was nil for most trees, or nevertheless much lower than variation in bark. The slight decrease in water content in sapwood of some trees during the chamber experiment suggested that part of the water present in sapwood might have been transferred to bark and then induced an underestimation of the decrease in water content in bark. Nevertheless, our results confirmed that variation in water content of bark tissues under desiccation conditions was sufficient to explain significant variations in trunk section diameter.
Seasonal variation in the rate of change in girth results from the combination of variation in secondary growth (cell multiplication) and bark properties (water content, thickness) that are influenced both by soil and atmospheric water conditions. As a result, our results clearly show that dendrometer measurements do not permit the study of the influence of seasonal variation in environmental conditions on secondary growth, because other biophysical factors also influence these measurements. In order to precisely estimate seasonal variation in secondary growth, anatomical analyses of cambium tissues could be conducted (Arend & Fromm Reference AREND and FROMM2007). Carefully studying the different phases of cambial cell development among seasons will allow testing of whether seasonal variation in soil and air atmospheric humidity influence secondary growth independently from these other non-growth factors.
In conclusion, our results emphasized that in tropical rain-forest trees fluctuations in girth during dry or wet periods can be partly explained by changes in hygroscopic properties of the bark. Seasonal variation in atmospheric relative humidity induced a shrinking (dry seasons) or a swelling (wet seasons) of bark tissues that is of the same order of magnitude as annual growth. Thus, while inter-annual variation in circumference increment can be efficiently estimated based on dendrometer measurements (Viera et al. Reference VIEIRA, TRUMBORE, CAMARGO, SELHORST, CHAMBERS, HIGUCHI and MARTINELLI2005), these measurements do not directly reflect seasonal variation in secondary growth.
ACKNOWLEDGEMENTS
We are grateful to J. Cazal, J. Cigna, S. Thibaudeau-Gosselin, C. Hequet and J.-Y. Goret for their help in dendrometer installation and measurements. We thank J. Beauchêne for the bark and wood determination and B. Thibaut for fruitful discussions. We also thank S. Chauchard for helpful discussions and her advice on PCR statistical methods. We also thank three anonymous reviewers who greatly helped improving a previous version of this manuscript. C. Stahl received an assistantship from CNRS (50%) and INRA (50%). The ORE ‘Ecosystèmes Forestiers’ managed by GIP-Ecofor partly contributed to the funding of the field experiment.


