INTRODUCTION
C4 plants are most abundant in semi-arid tropical and subtropical regions. This is usually attributed to the C4 pathway being competitive at high-light environments and allowing for higher temperature optimum of photosynthesis compared to C3 plants (Edwards et al. Reference EDWARDS, KU, MONSON, Barber and Baker1985, Ehleringer et al. Reference EHLERINGER, CERLING and HELLIKER1997). The CO2 concentrating mechanism of C4 plants allows them to attain high nitrogen and water use efficiencies (NUE and WUE respectively).
In (semi-)arid environments one benefit of having a high WUE should be a lengthening of the period of potential photosynthetic carbon gain during periods of water shortage. Only a few exceptions to the pattern of high WUE in C4 species have been reported; this being for very highly productive stands of Echinochloa polystachya, Paspalum repens and Paspalum fasciculatum growing along river floodplains in tropical South America (Piedade et al. Reference PIEDADE, JUNK and LONG1991). C4 plants also have a relatively low nitrogen requirement in order to sustain any given level of carbon uptake (Sage & Pearcy Reference SAGE and PEARCY1987). This may also be of benefit in savanna environments that are nutrient poor (Simioni et al. Reference SIMIONI, LE ROUX, GIGNOUX and WALCROFT2004).
Despite the fact that C4 grasses account for 20–30% of global photosynthetic productivity (Lloyd & Farquhar Reference LLOYD and FARQUHAR1994), there have been only a few studies on the photosynthetic properties, nutrient content and water relations and modulation of these factors by the environment for C4 grasses growing in their natural environment (Anten et al. Reference ANTEN, WERGER and MEDINA1998, Baruch & Bilbao Reference BARUCH and BILBAO1999, Simioni et al. Reference SIMIONI, LE ROUX, GIGNOUX and WALCROFT2004). Moreover, we still lack to date a comprehensive study of changes in photosynthetic characteristics of C4 plants over a growing season or year in a tropical semi-arid environment, especially in relation to the underlying internal (physiological) or external (environmental) causes.
In order to help understand the underlying environmental and physiological controls of C4 grass and sedge species we studied spatial and seasonal variation in photosynthetic capacities and stomatal conductances of C4 species growing in the Okavango River Delta, Botswana. We studied three species, Imperata cylindrica (L.) P. Beauv., Panicum repens L. (grasses) and Cyperus articulatus L. var. nodosus (Humb. & Bonpl. ex Willd.) Kük. (sedge) that grow in distinct microhabitats characterized by markedly different hydrological regimes. We hypothesized that differences in leaf-level gas exchange properties between these species will vary across the period of measurements and this variation will be most pronounced during the dry season, reflecting different ecological traits of the studied species.
METHODS
Study site
The Okavango River Delta, situated in north-western Botswana, is one of the world's largest inland deltas with an estimated area of 40 000 km2 (McCarthy & Ellery Reference MCCARTHY and ELLERY1994). The area has a semi-arid climate. Rainfall occurs mainly in November to April, averages c. 500 mm y−1, but is irregular both in spatial distribution and in intensity. Precipitation is greatly exceeded by potential evapotranspiration (1580 mm y−1; McCarthy & Ellery Reference MCCARTHY and ELLERY1994) but in many areas of the Delta rainfall is supplemented by annual floodwaters from the Angolan highlands that enter through the Okavango River. The work described here was undertaken at a seasonal floodplain located at the distal end of the Delta where the period of maximum inundation occurs during the climatically dry season, June–September (Ellery & McCarthy Reference ELLERY and MCCARTHY1994). In this part of the Delta a mix of seasonal floodplains and of dry, rain-fed ‘islands’ at slightly higher elevations is typical.
Apart from clayey soils (Vertisols), extensive soil formations in northern Botswana, including the Okavango Delta, derive from Kalahari sands (Arenosols) with a low agronomic potential (Almendros et al. Reference ALMENDROS, KGATHI, SEKHWELA, ZANCADA, TINOCO and PARDO2003). The vegetation cover of the Okavango Delta seasonal floodplains exhibits a marked zonation with different species occupying microhabitats characteristic of systematic variation in both frequency and length of inundation (Bonyongo et al. Reference BONYONGO, BREDENKAMP and VEENENDAAL2000). At the study location (S 19°36′33′ E 23°16′44′) a typical floodplain community occurred on low-lying ground where inundation lasts typically for several weeks to months during any given flood season. The dominant species in this area were a C4 sedge, Cyperus articulatus var. nodosus growing alongside the C3 sedge Schoenoplectus corymbosus (Roth ex Roem. & Schult.) Raynal. Cyperus articulatus is known to tolerate extended periods of standing water (Abd El-Ghani & Fahmy Reference ABD EL-GHANI and FAHMY2001). The soil material here is clay and, when wet, becomes blackish in colour. On the higher parts of the floodplain where plant water availability is almost always dependent on rainfall, and the soils are more sandy in character, sedges are all but absent and the perennial and rhizomatous grass Imperata cylindrica dominates. Imperata cylindrica belongs to the Nicotinamide-Adenine Dinucleotide Phosphate-malic enzyme (NADP-ME) photosynthetic subtype. This species is found throughout tropical regions, but has spread to warm temperate zones worldwide (Bryson & Carter Reference BRYSON and CARTER2004). It is one of the most intensively studied weed species worldwide but surprisingly limited data exists on its ecophysiological characteristics in its natural habitat. Few animals, other than hippopotami (Hippopotamus amphibus L.) will attempt to graze this plant (Thompson Reference THOMPSON and Denny1985). Lastly, what we refer to as the ‘intermediate zone’ (between the lower and upper floodplain) is characterized by a large year-to-year variation with respect to presence or absence, and height and duration of flooding. Here the pasture grass, Panicum repens, which belongs to the C4 phosphoenolpyruvate carboxykinase (PCK) photosynthetic type, was the dominant species. Globally, P. repens is not confined to intermediate floodplains; its native range extends from terrestrial, wetland and aquatic environments of tropical and North Africa, Mediterranean, South America and Asia and it is considered a weed in Northern America (Gibbs Russell et al. Reference GIBBS RUSSELL, WATSON, KOEKEMOER, SMOOK, BARKER, ANDERSON and DALLWITZ1991).
Gas exchange measurements
Between December 2001 and March 2003 five field campaigns were conducted to study the response of plant gas exchange to seasonally varying environmental conditions. Light and CO2 response curves were measured, between 08h00 and 13h00, on attached, fully expanded leaves randomly selected for each of the three species growing in their characteristic different microhabitats. We used a portable gas exchange system (Li-6400, Li-Cor Inc., Nebraska, USA) with one leaf from at least four plants or separate tillers sampled for each species. The leaf temperature inside the 6-cm2 leaf chamber was not controlled, the only exception being in March 2003. This was to avoid temperatures in excess of 40 °C, the temperature above which C4 net photosynthetic assimilation may become inhibited (Edwards & Walker Reference EDWARDS and WALKER1983). The red/blue LED light source inside the chamber allowed for automatic changes of photon flux density (I).
For light response curves, measurements were made at I = 2000, 1800, 1500, 1000, 700, 500, 300, 100 and 0 μmol m−2 s−1 with the CO2 mole fraction inside the chamber maintained at 370 μmol mol−1. For the CO2 response curves, measurements were made with I = 1600 μmol m−2 s−1. Varying CO2 concentrations were obtained from portable CO2/air mixture tanks and automatically controlled by a CO2 injector fitted onto the Li-6400 system. In situ CO2 assimilation rates were measured at 370, 300, 200, 100, 50, 400 (twice), 500, 600 and 700 μmol mol−1. During measurements both the leaf-to-air vapour pressure deficit, Dl, and leaf temperature, T l, in the chamber did not always exactly match the ambient conditions because these two parameters are affected by leaf transpiration rate (Beale et al. Reference BEALE, MORISON and LONG1999); T l typically exceeded air temperature at time of measurements by not more than 1 to 2 °C.
For every leaf sampled, light and CO2 response curves were fitted individually by a non-linear regression (SPSS 11.0 for Windows) to the hyperbolic function y = a (1 – eb −cx), where y is the rate of CO2 exchange, x is the independent variable (I or C i), b and c are constants, with values set to 0.1 and 0.002, respectively (Causton & Dale Reference CAUSTON and DALE1990). In the case of light response curves, coefficient a gives the light-saturated rate of CO2 exchange (A sat), b/c gives the compensation point, a(1 − eb) gives the dark respiration, and apparent quantum yield (the slope, or derivative of the curve at the light compensation point) is given by aceb. In the case of the A-Ci curve, a represents the light and CO2-saturated rate of CO2 exchange (A pot), the CO2 compensation point is again calculated from b/c, and the carboxylation efficiency (the slope, or the derivative of the curve at the CO2 compensation point) is given by aceb (for all see: Causton & Dale Reference CAUSTON and DALE1990). This simple equation has been widely used to analyse light and CO2 response curves of a variety of species (Kgope Reference KGOPE2004, Midgley et al. Reference MIDGLEY, WAND and PAMMENTER1999, Wand et al. Reference WAND, MIDGLEY and STOCK2001) and fitted our data well (r 2 ≥ 0.9). Light-saturated values of stomatal conductance (g sat) and C i/C a values were obtained from the light response curves at I > 1600 μmol m−2 s−1.
After completion of the gas exchange measurements the leaves were scanned and their area determined afterwards using WinFOLIA software (Regents Instruments Inc., Quebec, Canada). Leaf dry weight was obtained after oven-drying at 70 °C for 24 h and C and N concentration measured using a Vario EL (Elementar Americas, Inc. Mt. Laurel, New Jersey, USA). Leaf phosphorus concentration was measured after a nitric acid digestion using ICP-AES (Atomic Emission Spectrometry with Inductively Coupled Plasma, Perkin-Elmer, Norwalk, USA). Nitrogen use efficiencies (NUE) were determined by dividing A sat by leaf N and expressed on a leaf area basis. Water use efficiency (WUE) is expressed here as A sat/g sa.
Meteorological variables and soil characteristics
Half-hourly rainfall, air temperature and water vapour saturation deficit at c. 3 m height were measured at a nearby eddy-covariance flux tower, using a tipping bucket rain gauge (Young; Model 52202, R.M. Young Company, Traverse City, USA), temperature probe (HMP45A, Vaisala, Helsinki, Finland) and RPT 410 Barometric Sensor (Druck, New Fairfield, CT, USA), respectively. Volumetric soil water content (θ) was measured at each microhabitat within the floodplain, at 0–5 cm, 5–10 cm and 10–15 cm soil-depth intervals using a battery-powered hand-held soil moisture sensor (Moisture Meter type HH2 with Theta probe, Delta T Devices, Cambridge, UK) for each measurement campaign.
For each microhabitat, four soil samples were randomly collected at intervals of 0–5, 5–10, 10–20, 20–30 and 30–50 cm. These were then oven dried at 40 °C before being analysed for nutrients using Vario MAX (Elementar Americas, Inc. Mt. Laurel, New Jersey, USA). Soil nutrient data reported here are for the upper 10 cm of the soil profile. Soil pH was measured, from similar depths as for soil nutrients, in mixtures of 10 g of soil with 25 ml of distilled water with a pH meter (pH 538 WTW, Germany).
RESULTS
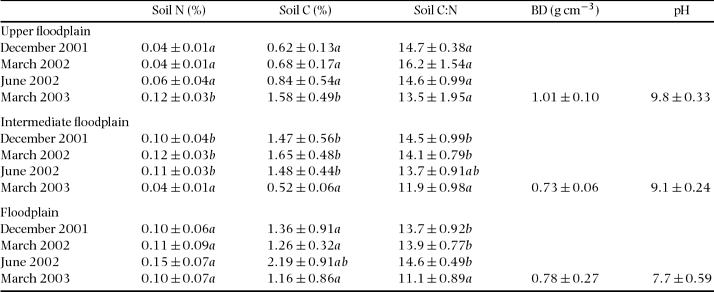
The soils of this seasonal floodplain were alkaline, pH ranged from 7.7 to 9.8, being highest in the upper parts of the floodplain (Table 1). Bulk densities in the sandiest (upper) parts were somewhat higher (1.01 g cm−3) compared with the flooded parts (c. 0.7–0.8 g cm−3), but differences were not significant (ANOVA, n = 6 for each microhabitat, F = 5.29, df = 17, P = 0.097). Between the rainy and dry season December 2001 to June 2002, soil N, soil C and soil C:N remained almost constant within each microhabitat. In March 2003 soil C and N were higher (upper floodplain) and lower (intermediate floodplain) than during the previous campaigns but remained unchanged in the floodplain. Overall, the sandy soils of the upper floodplain had lowest N and C content. With the exception of sulphur, the floodplain displayed the lowest concentrations of micronutrients (not shown).
Table 1 Mean (± SD) of soil N, soil C and soil C:N ratio, together with some soil physical characteristics of the three microhabitats at the seasonal floodplain. Soil pH and bulk density (BD) were determined in March 2003. Data shown represent the 0–10-cm soil layer, and were tested with ANOVA and grouped with the post hoc Tukey test. Different letters in a column indicate means are significantly different (P < 0.05) when testing for differences in each variable within each microhabitat.

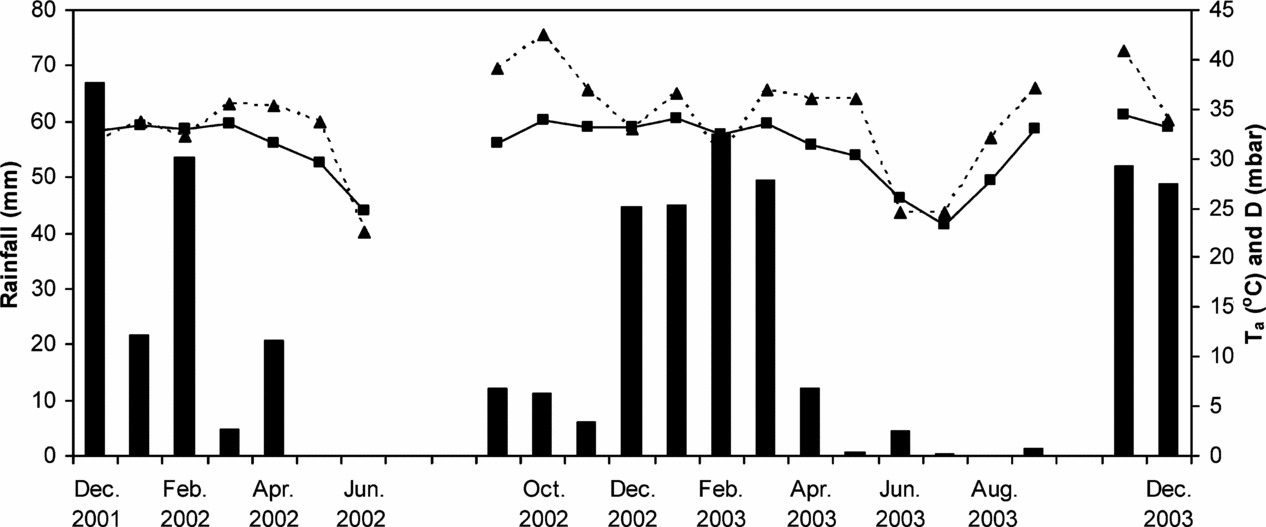
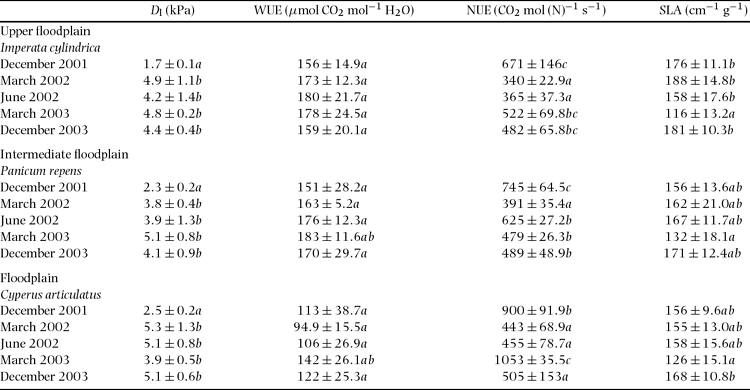
Generally, air saturation deficit (D, Figure 1) was highest just before and at the onset of the rainy season. Towards the dry season Ta and air temperature (Ta)decreased, but even then average daily values were around 25 mbar and 25 °C, respectively. Cooler days with high cloud cover (not shown), particularly during the days when measurements were made, led to substantially lower chamber leaf-to-air vapour pressure deficit (Dl) during the December 2001 campaign when compared with the rest of the measurement periods. However, Dl remained similar across the rest of the measurement periods and also between species (Table 2).

Figure 1. Monthly rainfall (bars), mean maximum monthly air temperature (solid line) and mean maximum vapour pressure deficit (dotted line) at the seasonal floodplain measurement site, located in the Okavango River Delta in north-western Botswana. Five measurement campaigns were conducted between December 2001 and December 2003.
Table 2 Leaf-to-air vapour pressure deficit (Dl), water use efficiency (WUE), nitrogen use efficiency (NUE) obtained from the A-ci response and light response curves and specific leaf area (SLA). WUE and NUE were determined as Asat/gsat and Asat/leaf N, respectively. Values are mean ±SD of at least four measurements on randomly selected leaves of each species. All data were tested with ANOVA and grouped with the post hoc Tukey test. Different letters in a column indicate means are significantly different (P < 0.05) when testing for differences in each variable within each microhabitat.
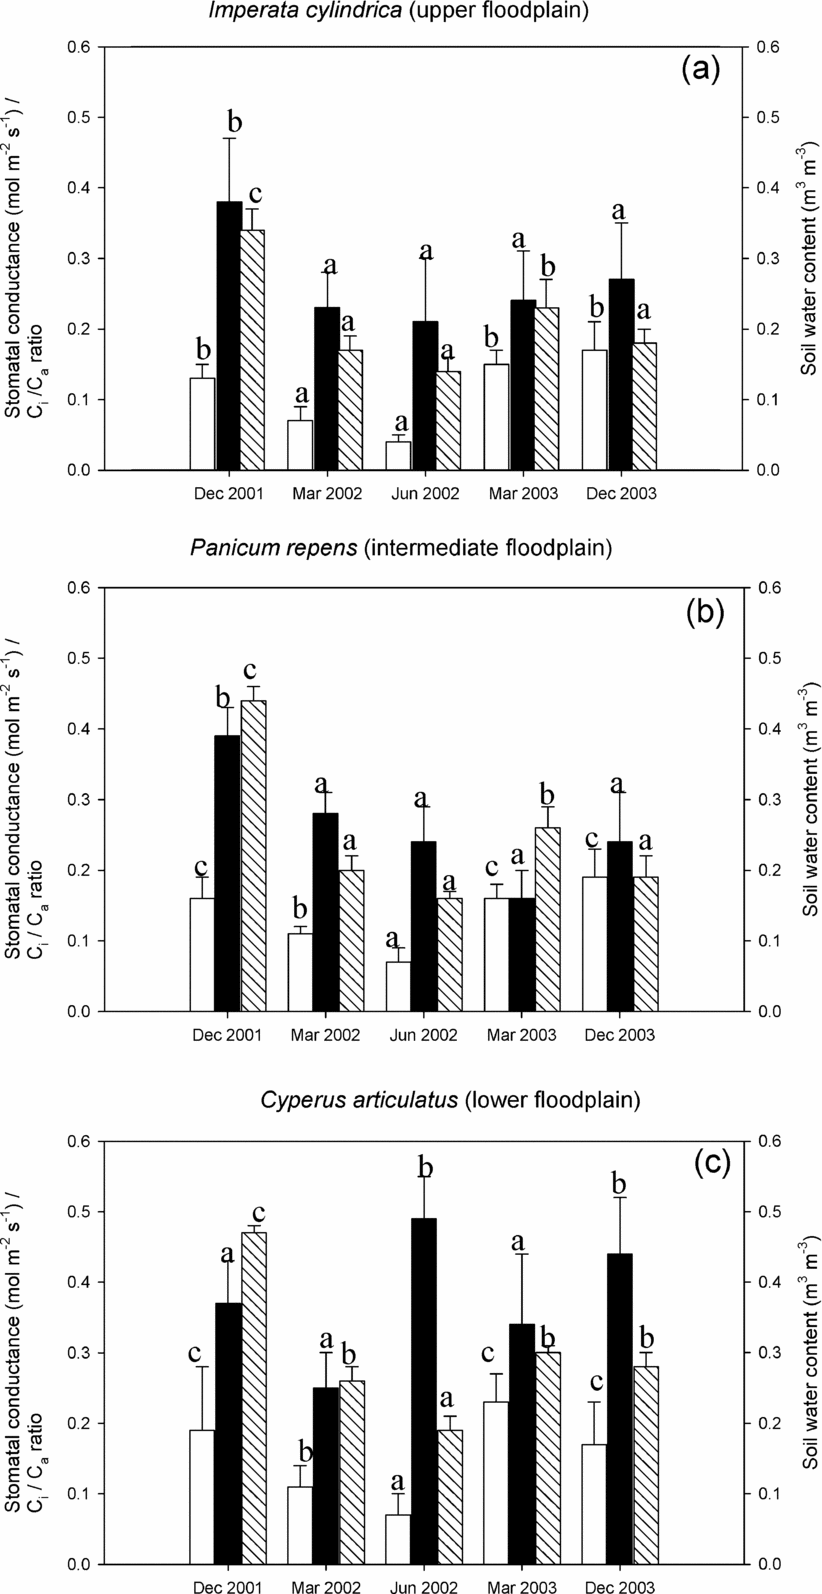
During the periods of our measurements, it was only in December 2001 that the annual flood covered a substantial area of the floodplain, with standing water up to 0.8 m depth in the lowest parts. In these lower parts θ (0–10 cm depth) subsequently declined from 0.5 m3 m−3 to 0.2 m3 m−3 during the dry season (June 2002, Figure 2). In the rain-fed upper floodplain θ varied between 0.34 and 0.17 m3 m−3 over the same period with the transitional Panicum repens-dominated area having soil water contents intermediate between the other two. In March and December 2003, all micro-habitats depended mostly on rainfall for their water supply as the flood had either already receded and was limited to a very narrow strip only (March 2003), or had not reached this floodplain at all (December 2003). Such inter-annual variation in flooding is a characteristic feature of the Okavango Delta. Nonetheless, during these two later campaigns, θ still consistently increased towards the lowest parts of the floodplain (Figure 2).

Figure 2. Stomatal conductance (white), Ci/Ca ratio (black) and soil water content (shaded) of the three species during the measurement periods. Data are mean (± SD) and were tested with ANOVA and grouped with the post hoc Tukey test. Different letters indicate means are significantly different (P < 0.05) when testing for between-season differences in each variable within each microhabitat. Imperata cylindrica (a) grows on the driest parts in the floodplain, Panicum repens (b) grows on the intermediate part of the floodplain, while Cyperus articulatus (c) grows on the (lower) wettest parts in the floodplain.
For all three species, light-saturated stomatal conductances, g sat, were highest during the wet season (December and March) with mean values ranging from 0.15 and 0.23 mol m−2 s−1 (Figure 2), and in each campaign increasing from the driest microhabitat to the wettest microhabitat. For all three species g sat were lowest during the June 2002 campaign when θ was the lowest.
Figure 2 shows reductions in C i/C a in all microhabitats towards the end of the rainy season (December 2001 vs. March 2002). However, as the dry season progressed mean C i/C a of the sedge, C. articulatus, increased substantially (June 2002). By contrast, the mean C i/C a of the grass species continued to decline. Overall, differences in C i/C a across the floodplain were most pronounced in the absence of surface flooding, i.e. in June 2002, March 2003 and December 2003 (Figure 2). During these periods, C i/C a in C. articulatus was consistently higher than those measured at the drier microhabitats (ANOVA, n = 6 for each microhabitat; June 2002: F = 27. 2, df = 17, P < 0.001; March 2003: F = 7.08, df = 17, P = 0.008; December 2003: F = 9.36, df = 17, P = 0.001).
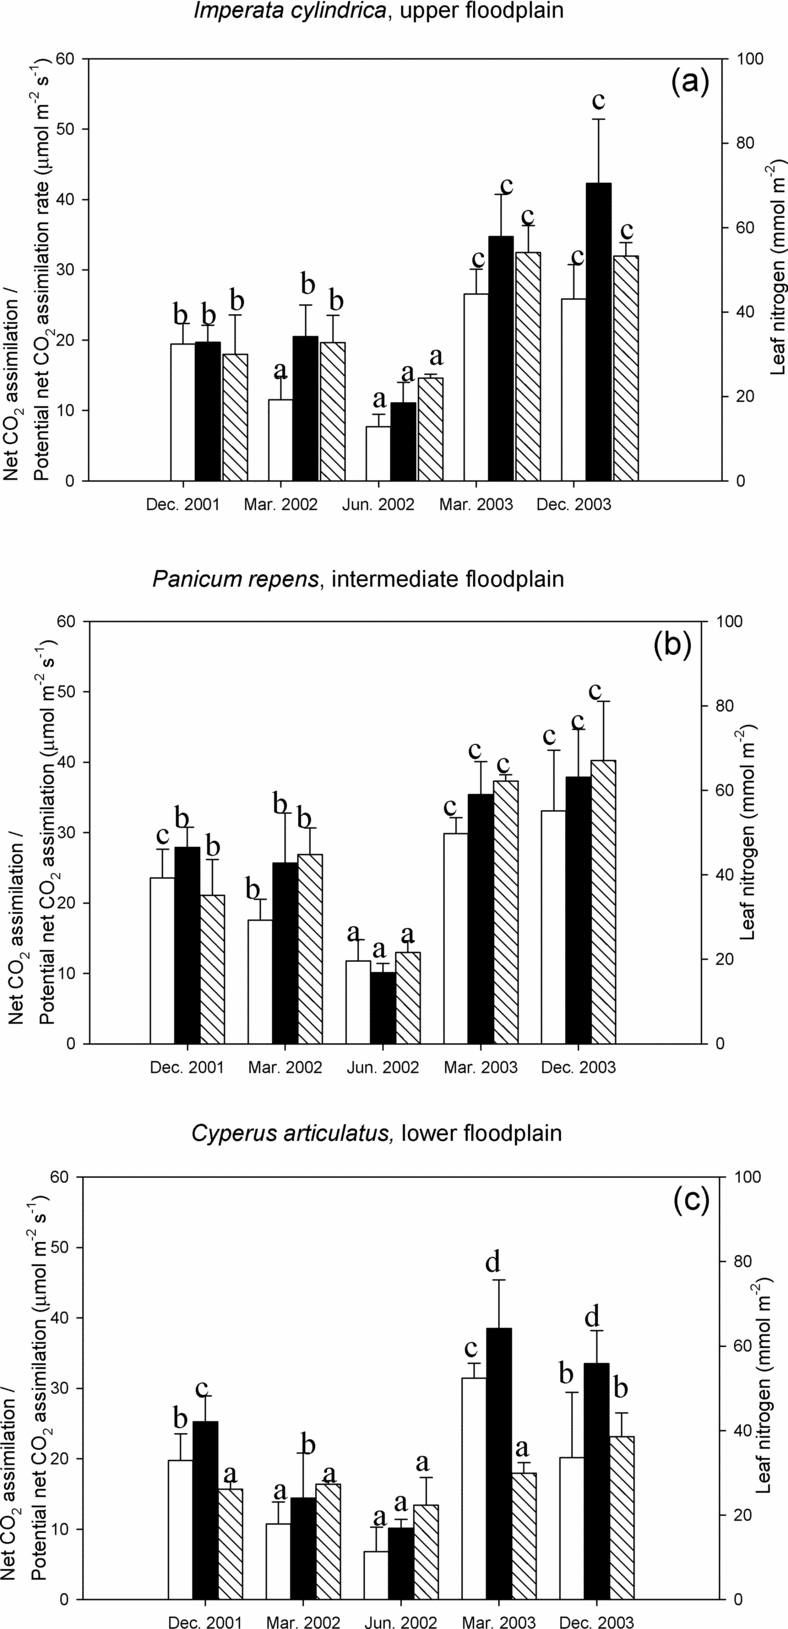
With the exception of March 2003, which showed a tendency of low specific leaf area (SLA), no significant differences were found in the values of mean SLA within each microhabitat (ANOVA; I. cylindrica: n = 26, F = 22.2, df = 25, P > 0.05; P. repens: n = 25, F = 29.2, df = 24, P > 0.05; C. articulatus: n = 22, F = 19.1, df = 21, P > 0.05) and across the species (ANOVA, n = 15, F = 0.366, df = 14, P = 0.701) (Table 2). Foliar N of the grass species was highest in the wet season just after the onset of the annual rains and declined progressively towards the dry season, reaching their lowest values in June (Figure 3). Values measured in December 2003 were in all species significantly higher (t-test, I. cylindrica: t = 13.4, n = 13, df = 12, P < 0.05; P. repens: t = 9.2, n = 11, df = 10, P < 0.05; C. articulatus: t = 9.2, n = 11, df = 10, P < 0.05) than in December 2001. With the exception of the dry season, mean leaf N values in P. repens were always higher than those of the other species, but the difference was not always statistically significant. Moreover, leaf N values of P. repens varied seasonally by a factor of three (67 to 22 mmol N m−2) contrasting with a much lower variation in leaf N for C. articulatus. Leaf phosphorus data were available only for the last two wet-season measurement campaigns, March and December 2003. No species showed significant differences (t-test; I. cylindrica: t = 15.3, n = 8, df = 7, P = 0.074; P. repens: t = 25.7, n = 8, df = 7, P = 0.46; C. articulatus: t = 7.62, n = 8, df = 7, P = 0.065) in mean leaf P between March 2003, ranging from 1.04 to 1.84 mmol m−2, and December 2003, ranging 1.49–1.86 mmol m−2. During both periods, the two grasses had higher mean leaf P than the sedge, although this difference was significant (ANOVA, n = 4 for each species, F = 29.1, df = 11, P < 0.05) only in March 2003.

Figure 3. Light-saturated net CO2 assimilation (white), potential net CO2 assimilation rate (black) and leaf nitrogen content (shaded) for Imperata cylindrica (a), Panicum repens (b) and Cyperus articulatus (c) during the measurement periods. Data are mean (± SD) and were tested with ANOVA and grouped with the post hoc Tukey test. Different letters indicate means are significantly different (P < 0.05) when testing for between-season differences in each variable within each microhabitat.
As was the case with leaf N and g sat, A sat and A pot were highest during the wet season when mean values ranged between 20 and 31 μmol m−2 s−1 and 19 and 42 μmol m−2 s−1, respectively (Figure 3). The species dominating the intermediate floodplain, P. repens, had the highest mean A sat overall (except for March 2003) and highest mean A pot values from December 2001 to June 2001. However, these differences in A sat and A pot were not always significantly different. From December 2001 to June 2002, both A sat as well as g sat (Figure 2 and Figure 3) decreased by approximately 60–70% across the entire floodplain, while A pot was less affected. The seasonal decline of Asat was smallest in I. cylindrica and largest in C. articulatus. Over a broad range of Dl and during the drying sequence December 2001–June 2002, the C4 sedge (in the wettest microhabitat) consistently had lower Asat at similar or higher gsat when compared to the grasses (representing the drier microhabitats). Thus the slope of the linear A sat versus g sat relationship was considerably lower (data not shown). As a consequence, mean water use efficiency (WUE) was lowest in C. articulatus, ranging from 95 to 142 μmol CO2 mol−1 H2O (Table 2), whereas WUE of I. cylindrica and P. repens were similar, ranging between 152 and 183 μmol CO2 mol−1 H2O. Largest and significant differences between the mean WUE of the grass species and those of sedge species were found during the late rainy (ANOVA; March 2002: n = 19, F = 34. 9, df = 18, P < 0.01), and dry season (ANOVA; June 2002: n = 27, F = 34.0, df = 26, P < 0.01).
All species showed the typical curvilinear decline of g sat with D l at non-limiting light conditions (Figure 4) which can be described by using for instance, the logarithmic ‘Lohammar-type’ relationship gs = -m ln D l + b; where m is the slope and b the intercept. There was some scatter in the data, but in general g sat at a given D l in the wettest microhabitat (C. articulatus) was higher than in the driest microhabitat (I. cylindrica) irrespective of time of year. Cyperus articulatus also showed the highest stomatal sensitivity, indicated by the highest initial decline of gsat with D l.
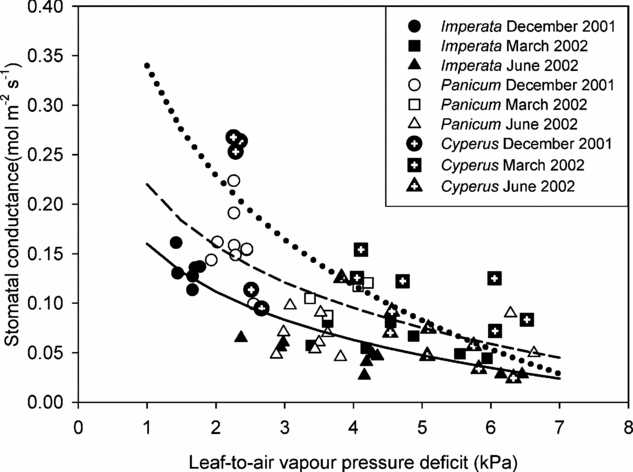
Figure 4. Relationship between leaf-to-air vapour pressure deficit and stomatal conductance of Imperata cylindrica, Panicum repens and Cyperus articulatus. Data shown were obtained during the soil drying cycle (December 2001 to June 2002). Each datum point represents measurements taken from an individual leaf. All data points were obtained at high light (≥1600 μmol m−2 s−1) and at ambient CO2 concentration (370 μmol mol−1). Lines were fitted using the logarithmic Lohammar-type relationship.
For the two grasses, a strong positive relationship between leaf N and A pot, was discernible across all experimental campaigns as can be seen for instance when comparing the response found for I. cylindrica in March 2002 vs. June 2002 (Figure 5a). When merging data from all measurement periods there was an overall increase of A pot with N in P. repens and I. cylindrica, which was notably steeper for the latter. By contrast, no significant relationship existed between Apot and leaf N in C. articulatus, except for the December 2003 campaign. These patterns were similar in Asat (not shown).
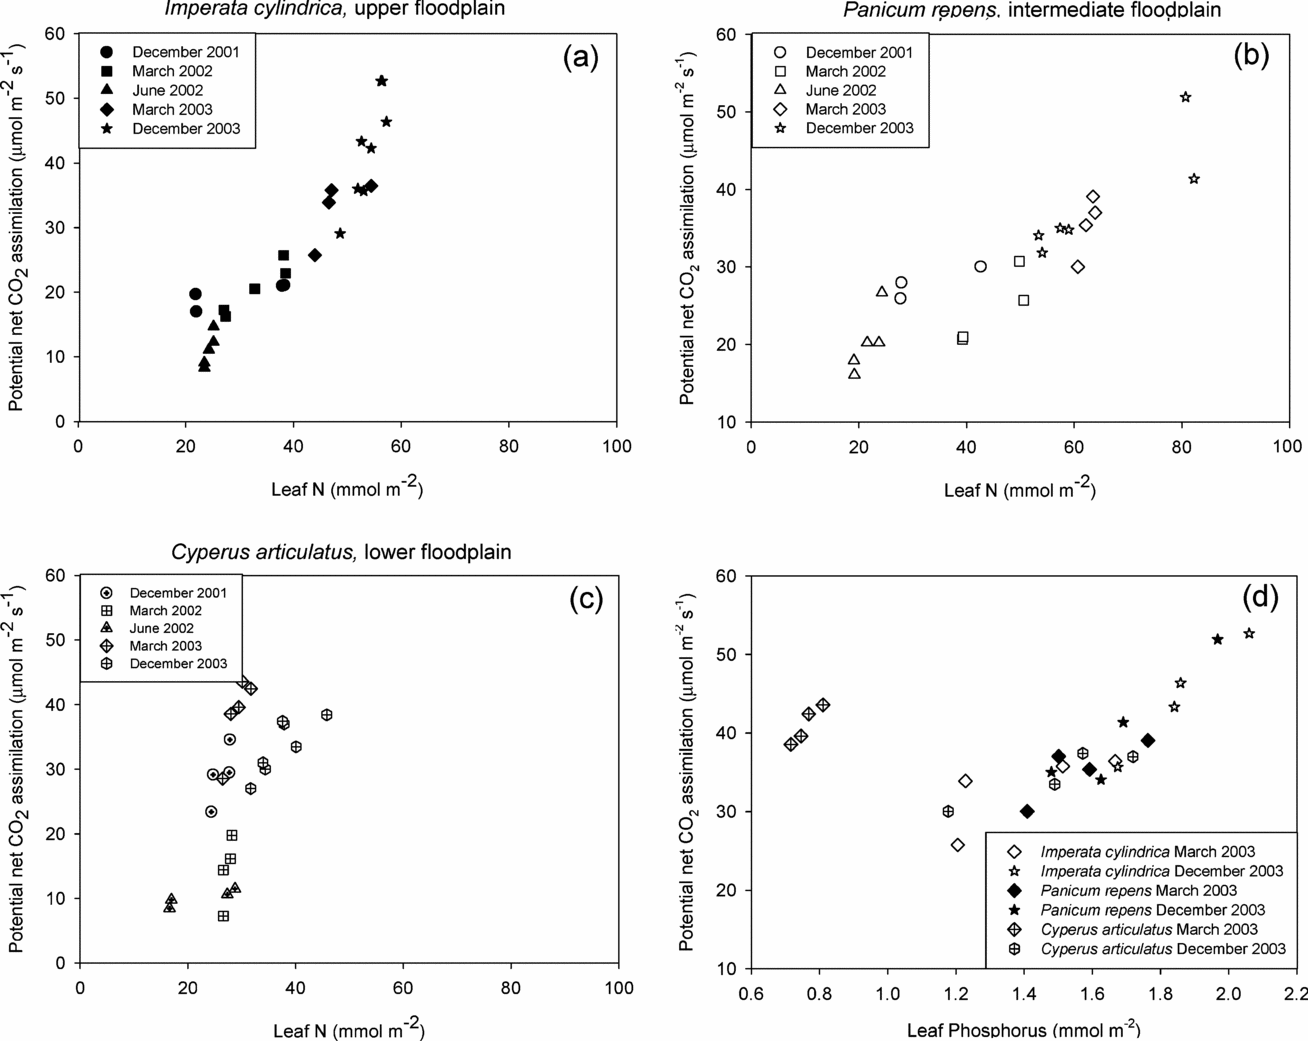
Figure 5. The relationship between leaf nitrogen and potential net CO2 assimilation for Imperata cylindrica (a), Panicum repens (b) and Cyperus articulatus (c) throughout the entire measurement periods. Figure 5(d) shows the relationship between leaf phosphorus and potential net CO2 assimilation at the three microhabitats species during the rainy season campaigns of March and December 2003.
Leaf N in the sedge was at the lower end of the range observed in the floodplain, and varied seasonally only little between c. 20–40 mmol N m−2. This translated into higher mean NUE in the wet season when compared to the plants in the other microhabitats (Table 2). Across the entire floodplain, NUE values were higher, but not significantly different (ANOVA, n = 30, F = 0.931, df = 29, P = 0.76), during the rainy season December 2001, when compared to the dry season, June 2002. The species and seasonal response of g sat to leaf N was similar to that of A pot and A sat to leaf N (data not shown).
For the two periods where leaf phosphorus data were available, all three species expressed a strong linear relationship of leaf P with A pot with greatly lessened difference between species and microhabitats than was the case for N (Figure 5d). Values obtained for C. articulatus in March 2003 were however exceptional, as A pot of a similar magnitude to those observed in another species were obtained at much lower foliar phosphorus concentrations.
DISCUSSION
On islands and dry floodplain areas of the Okavango Delta soil pH values above 9, as found in this study, frequently indicate the development of sodic soils that turn hard and crusted when dry (Bonyongo & Mubyana Reference BONYONGO and MUBYANA2004, McCarthy & Ellery Reference MCCARTHY and ELLERY1994, Tooth & McCarthy Reference TOOTH and MCCARTHY2007). The range of A sat (20–45 μmol m−2 s−1) observed when soil moisture levels were high is similar to values reported for C4 species elsewhere under well-watered field conditions (15–60 μmol m−2 s−1; Long Reference LONG, Barber and Baker1985). Values for rainy season g sat, however, were at the lower end of the spectrum (0.14–0.23 mol m−2 s−1 versus 0.2–0.7 mol m−2 s−1; Lawlor Reference LAWLOR2001, Long Reference LONG, Barber and Baker1985), and as such the Ci/Ca ratios were also relatively low (0.16–0.49), with the highest values generally found in the sedge. Mean WUE of C. articulatus (95–142 μmol CO2 mol−1 H2O) was comparable to that found in two Cyperus species, 100 μmol CO2 mol−1 H2O, in a tropical wetland at Kahawa Swamp, Kenya (Jones Reference JONES1988), while mean WUE of the two grasses (151–183 μmol CO2 mol−1 H2O) was higher than that found in the C4 grasses of a tallgrass prairie, 96 μmol CO2 mol−1 H2O, in Kansas, USA (Knapp Reference KNAPP1993). In the grass species a more efficient stomatal function relative to that of the sedge allowed carbon uptake at minimal loss of water but structural differences between the grass and sedge species may also have played a role in the observed gas exchange differences. It is likely that the root system of the sedge is deeper and larger than that of the grass species, so as to provide support during periods of inundation and more importantly giving it access to larger amounts of water to support its relatively high water demand even in the dry season.
The range of leaf N observed in the sedge and the two grasses when soil water content was not limiting was comparable to that found in a range of C4 sedge and grass species in South American and African ecosystems (Anten et al. Reference ANTEN, WERGER and MEDINA1998, Le Roux & Mordelet Reference LE ROUX and MORDELET1995, Olivares et al. Reference OLIVARES, VIZCAINO and GAMBOA2002) with the exception of a cerrado of Brazil where leaf N was considerably lower (Miranda et al. Reference MIRANDA, MIRANDA, LLOYD, GRACE, FRANCEY, MCINTYRE, MEIR, RIGGAN, LOCKWOOD and BRASS1997; 2–6 mg g−1). The range of mean leaf P during the wet-season measurement periods (1.02–1.62 mg g−1) at this seasonal floodplain was only a little lower than reported for Echinochloa polystachya, 1.5–1.9 mg g−1, growing in a flooded area of the Amazon River (Piedade et al. Reference PIEDADE, JUNK and LONG1997) and higher than that found in South African C4 savanna grasses (0.4–0.9 mg g−1; Scholes & Walker Reference SCHOLES and WALKER1993) and native and alien grasses of Venezuela savannas (0.5–1.4 mg g−1; Baruch et al. Reference BARUCH, LUDLOW and DAVIS1985).
Different responses of the plants to their environment during the 2001–2002 rainy and subsequent dry season were observed when compared with the 2003 data. Most notably, our results showed significantly higher leaf N, A sat, A pot, g sat in March 2003 and December 2003 when compared with December 2001. In the December 2001 campaign measurements had been conducted after a high annual flood, and an early onset of the annual rains (P. Wolski, unpubl. data). By contrast, the onset of the rainy season proper was delayed in 2002–2003 and there was no surface flooding in either March or December 2003. The campaigns differed also with respect to air temperatures and water vapour saturation deficits, which were to some extent lower in December 2001 while soil moisture levels were higher.
The marked seasonality of leaf N in grasses together with the lower leaf P in the sedge species did not match the constant values in soil N during the soil drying period and the similar levels of soil P across this seasonal floodplain. Across a range of species from different biomes, those with higher SLA generally have a higher A sat per unit leaf N and also vary more in A sat per unit variation in leaf N than those with lower SLA (Reich et al. Reference REICH, ELLSWORTH and WALTERS1998, Reference REICH, BUSCHENA, TJOELKER, WRAGE, KNOPS, TILMAN and MACHADO2003). Our results showed little variation in SLA both within and across the species. The data suggest that year-to-year variation in foliar N was responsible for inter-annual variation in leaf gas exchange characteristics. One possibility for variation in leaf N might be the timing of the initiation of new leaf growth and the measured leaves may have differed in age. In seasonally variable environments it is normal to encounter leaves of different age during field measurements even within one plant (e.g. at our site due to grazing). Yet this seems unlikely as a main factor as in March 2003 leaves would have been as old, if not older that those grown in December 2001, but they had A sat, g sat, and leaf N that were similar or higher. Likewise, leaf N did not vary much between leaves measured in December 2001 and March 2002 although the leaves sampled were probably of different age.
A linear increase of A sat and A pot with leaf N is typical for many plants because of the large amount of leaf N fixed in Rubisco (Field & Mooney Reference FIELD, MOONEY and Givnish1986, von Caemmerer Reference VON CAEMMERER2000). In C4 plants, phosphoenol pyruvate carboxylase (PEP-C) activity, which is assumed to control the C4-cycle, affects primarily carboxylation efficiency while A pot reflects the level of Rubisco activity (von Caemmerer Reference VON CAEMMERER2000). High A pot can also be associated with good soil water and nutrient supply (De Lucia et al. Reference DE LUCIA, WHITEHEAD and CLEARWATER2003, Sage et al. Reference SAGE, PEARCY and SEEMANN1987). Over the period of our measurements A pot of the two grasses showed the clearest relationship with leaf N. Moreover, leaf N of measured leaves varied most in the grass-dominated floodplain, particularly at the driest, rain-fed microhabitat where a tripling of leaf N was accompanied by a five-fold increase in A pot. In terms of their C4 sub-type (I. cylindrica belongs to NADP-ME and P. repens to PCK) differences in the physiological characteristics that have been observed under controlled conditions, e.g. nitrogen requirements (Taub & Lerdau Reference TAUB and LERDAU2000), the initial slope of the A-Ci response curve (von Caemmerer Reference VON CAEMMERER2000) and quantum yields (Edwards et al. Reference EDWARDS, KU, MONSON, Barber and Baker1985), were not found in this study. This was not surprising when considering the inherent scatter in field data and the limited number of species.
In the wet, sedge-dominated parts, the seasonal variation leaf N was small and there was no clear effect of leaf N on A pot (and A sat) in C. articulatus although A pot varied by a factor of five, and maximum rates were well within what had been observed at the other parts of the floodplain. As a result the NUE of the sedge was most often the highest of the three species, and varied seasonally by a factor of two to three. The pattern of high g sat, and high C i/C a ratio may have contributed to its high NUE since at high C i less photosynthetic enzyme is needed to achieve high rates of photosynthesis (Hikosaka Reference HIKOSAKA2004). These results corroborate observations from the seasonal floodplains in central Venezuela (Anten et al. Reference ANTEN, WERGER and MEDINA1998) where highest NUE was also typical for (C3 as well as C4) species that grow on the flooded sites.
Obviously maximum assimilation rates were constrained by other resources, perhaps other nutrients, other than N, particularly so in the sedge but probably also in the two grass species. One plausible candidate would be phosphorus which has been shown to be an important limiting soil nutrient to C4 productivity (Mott et al. Reference MOTT, WILLIAMS, ANDREWS, GILLISON, Tothill and Mott1985). During plant growth, leaf P modulates the influence of leaf N on photosynthetic capacity (Jia & Gray Reference JIA and GRAY2004). At our floodplain site, the use of only three species limits making general conclusions. Our results do suggest, however, that across the grass-dominated microhabitats, the effects of leaf P on assimilation capacity were at least as strong if not stronger than leaf N, and much more uniform than in the sedge-dominated microhabitat, where during the March 2003 campaign high rates of assimilation were observed at very low levels of phosphorus.
Seasonal re-translocation of leaf N similar to what we found in the grasses at our study site has also been observed in grasses at the infertile lowland savannas of Venezuela (Baruch Reference BARUCH, Solbrig, Medina and Silva1996). The authors of this Venezuelan study suggested that an accumulation of reserves underground contributes to their preservation from fire volatilization, thus constituting an important conservation strategy. Indeed, the roots and rhizomes of I. cylindrica have been reported to be remarkably resistant to fire (MacDonald Reference MACDONALD2004). A recent study on the fire history for southern Okavango Delta, using satellite imagery, identified the seasonal floodplains as the regions with the highest fire frequency and serving as a source of fires spreading into drylands (Heinl et al. Reference HEINL, FROST, VANDERPOST and SLIVA2007). In addition, storage of a large fraction of nutrients, biomass and meristems underground protects savanna species also from herbivory (Archer et al. Reference ARCHER, COUGHENOUR, FERNANDEZ, HAY, HOFFMAN, KLINK, SILVA, SOLBRIG, Solbrig, Medina and Silva1996).
The seasonality in environmental conditions covered by the measurement campaigns, including the dry-season data set from June 2002 allowed us to investigate the extent of stomatal vs. mesophyll constraints on leaf gas exchange in C. articulatus vs. the two grasses. The initial response across the floodplain as D l increased and soil water became sparser during the dry season was a decrease in g sat and A sat, while leaf N remained nearly constant or even increased. In unison with a wide range of plants, g s decreased with increasing D in a curvilinear fashion (Bunce Reference BUNCE1998, Maroco et al. Reference MAROCO, PEREIRA and CHAVES2000, Morison & Gifford Reference MORISON and GIFFORD1983). The largest differences between the species were found at low D l. Under these conditions, species that had higher g sat showed the fastest decline with increasing D l. Such high stomatal sensitivity is typical for species with relatively high g sat (Bunce Reference BUNCE1998, Comstock & Ehleringer Reference COMSTOCK and EHLERINGER1993, Maherali et al. Reference MAHERALI, JOHNSON and JACKSON2003, Oren et al. Reference OREN, SPERRY, KATUL, PATAKI, EWERS, PHILLIPS and SCHAEFER1999). However, daytime D l below 2 kPa are untypical for semi-arid environments and within the range of commonly occurring D, 3–6 kPa, the rate of decline of gsat with D converged in the three species. Nevertheless, C. articulatus maintained the highest g sat of the three species examined throughout the year.
In conclusion, the three different C4 species showed pronounced seasonal and inter-annual variation in their leaf physiological characteristics. Since these species were compared in their own growth environment it is difficult to judge whether the observed differences are genotypic or the result of plasticity, although the observed relationships of gs with D indicate intrinsically different WUE strategies. Largest differences in gas exchange characteristics of the three species were found during the dry season, reflecting differences between stomatal and mesophyl regulation under limiting soil water conditions. An efficient use of CO2 at low C i/C a was associated with strong stomatal control and a strong dependence of biochemical components of photosynthesis on leaf N. In two of the three species, the effect of leaf P on assimilation was as high, if not higher than that of leaf N with photosynthesis-P relationships tending to be more uniform across the floodplain than was the case for N.
ACKNOWLEDGEMENTS
This research was funded by a grant from the Deutsche Forschungsgemeinschaft to AA. EMV was supported through University of Botswana Research funds; KBM acknowledges support from MPI-BGC and from Wageningen University scholarships. We thank Ines Hilke for leaf nutrient analyses and Michael Schwarz, Nadine Hempel, Thebe Kemodisele, Billy Mogojwa and Ineelo Mosie for invaluable field assistance. We also thank Harry Oppenheimer Okavango Research Centre for providing logistical support during all the field campaigns.