


INTRODUCTION
Plant phenology is strongly controlled by climate and has consequently been considered as a reliable indicator of ongoing climate change (Gordo & Sanz Reference GORDO and SANZ2010, Keatley et al. Reference KEATLEY, FLETCHER, HUDSON and ADES2002, Parmesan & Yohe Reference PARMESAN and YOHE2003, Root et al. Reference ROOT, PRICE, HALL, SCHNEIDER, ROSENZWEIG and POUNDS2003). In response to the warming climate, many species in temperate regions have advanced the dates of spring leaf development (e.g. leaf budburst and leaf flushing) and flowering over the past half century (Abu-Asab et al. Reference ABU-ASAB, PETERSON, SHETLER and ORLI2001, Ahas et al. Reference AHAS, AASA, MENZEL, FEDOTOVA and SCHEIFINGER2002, Doi & Katano Reference DOI and KATANO2008, Dose & Menzel Reference DOSE and MENZEL2004, Fitter & Fitter Reference FITTER and FITTER2002, Gordo & Sanz Reference GORDO and SANZ2009). Such temperature increase also has led to a prolonged growing season in most cases (Chen et al. Reference CHEN, HU and YU2005, Matsumoto et al. Reference MATSUMOTO, OHTA, IRASAWA and NAKAMURA2003, Menzel & Fabian Reference MENZEL and FABIAN1999).
In the tropics, instead of temperature, light condition is usually more important (Nemani et al. Reference NEMANI, KEELING, HASHIMOTO, JOLLY, PIPER, TUCKER, MYNENI and RUNNING2003, Wright & van Schaik Reference WRIGHT and VAN SCHAIK1994, Zimmerman et al. Reference ZIMMERMAN, WRIGHT, CALDERON, PAGAN and PATON2007). Some authors have addressed the importance of day-length variation in manipulating bud break or flowering in tropical trees (Bollen & Donati Reference BOLLEN and DONATI2005, Rivera & Borchert Reference RIVERA and BORCHERT2001, Rivera et al. Reference RIVERA, ELLIOTT, CALDAS, NICOLOSSI, CORADIN and BORCHERT2002). In regions near the equator where day-length variation is small across the year, Borchert et al. (Reference BORCHERT, RENNER, CALLE, NAVARRETE, TYE, GAUTIER, SPICHIGER and VON HILDEBRAND2005) proposed an assumption based on times of sunrise or sunset to explain synchronous flowering. Recently, studies in tropical America suggested the daily insolation, which is a function of day-length and intensity of irradiation, to be the main factor controlling bud break and flowering of many perennials in the tropics, instead of day-length only (Calle et al. Reference CALLE, STRAHLER and BORCHERT2009, Reference CALLE, SCHLUMPBERGER, PIEDRAHITA, LEFTIN, HAMMER, TYE and BORCHERT2010).
Water availability is another important factor for the phenology of tropical plants. In tropical monsoon forests, synchronous leaf flushing and flowering are triggered by the first heavy rain after the dry season (Borchert Reference BORCHERT1994a, Eamus Reference EAMUS1999, Opler et al. Reference OPLER, FRANKIE and BAKER1976). For evergreen species, leaves are kept hydrated during the dry season by using the water taken from subsoil (Jackson et al. Reference JACKSON, CAVELIER, GOLDSTEIN, MEINZER and HOLBROOK1995). Deciduous species in dry forests also use subsoil water for shoot growth or flowering at the end of dry season (Borchert Reference BORCHERT1994b, Reference BORCHERT1994c). Due to the multiple drivers, phenology of tropical plants is more complicated compared with temperate plants.
Under the scenario of climate change, whether plant phenology in the tropics is affected by global warming is still inconclusive. Calle et al. (Reference CALLE, SCHLUMPBERGER, PIEDRAHITA, LEFTIN, HAMMER, TYE and BORCHERT2010) suspected that in the tropics, especially some lowland forests, where temperature is over 25 °C, global warming is not likely to affect the plant phenology there. By contrast, a study from the forest in Costa Rica found reductions in tree growth accompanied by the increasing temperature (Clark et al. Reference CLARK, PIPER, KEELING and CLARK2003), implying a change in vegetative phenology could have also occurred. Although the phenology of tropical plants has attracted much attention, its response to climate change is generally unclear because of the lack of long-term phenological records.
In this study, we analysed the phenological data (1973–1999) of the tropical plants in Xishuangbanna Tropical Botanical Garden, where the mean temperature has increased by 1.33 °C y−1 since the 1960s (Zhao et al. Reference ZHAO, ZHANG, SONG, XU and XIAO2012), to test the hypothesis that the warming climate has led to consistent changes in the phenology of tropical plants (i.e. advanced the date of leaf budburst and flowering and prolonged growing season and flowering duration) as it has performed in temperate species. The result will improve current knowledge of how tropical plants are affected by climate change.
METHODS
Site description
The study site is in Xishuangbanna Tropical Botanical Garden (XTBG, 21°41′N, 101°25′E), locates at the northern edge of the Asian tropical zone (Zheng et al. Reference ZHENG, YIN and LI2010) at an altitude of 570 m asl. The annual mean temperature is 22 °C and the rainfall is 1496 mm. The climate is typically seasonal, which is dominated by the tropical southern monsoon from the Indian Ocean during May–October and by subtropical jet streams during November–April. Consequently, three seasons are exhibited (Figure 1) which were defined by former studies in this region (Cao et al. Reference CAO, ZHANG, FENG, DENG and DENG1996, Reference CAO, ZOU, WARREN and ZHU2006; Zhang Reference ZHANG1966). They are a cool-dry season (November–February), hot-dry season (March–April) and rainy season (May–October). The cool-dry season is the coolest period with a mean temperature of 17 °C. There is dense fog in the morning but hardly any rainfall (average 29 mm mo−1). The following hot-dry season is a transitional period with more rainfall (average 61 mm mo−1) and higher temperature (average 22 °C). In the rainy season, rainfall comprises about 84% of the annual amount and mean temperature is the highest (25 °C).

Figure 1. Monthly mean temperature, rainfall and sunshine duration in Xishuangbanna during 1971–2008. Three seasons are noted as: I, cool-dry season; II, hot-dry season; III, rainy season. The error bar represents 1 SD.
Phenology and climate
With the phenological records of more than 15 y, 21 deciduous tree species from five families (Bignoniaceae, Combretaceae, Dipterocarpaceae, Mimosaceae and Papilionaceae) were selected to study. The studied phenological events include onset of leaf budburst (the day that first leaf bud begins to open), growing season (the days from onset of leaf budburst to all leaves shed in a year), onset of flowering (the day that first flower bud totally opens) and flowering duration (days from the onset of flowering to all flowers shed in a year). Seeds or seedlings of the trees were introduced from other seasonal tropical regions (Appendix 1) and planted around 1960. They were not artificially pruned, irrigated or fertilized, which makes the study of climate impact possible. The study periods vary slightly among species and generally cover 1973–1999 (Appendix 1). Data after 1999 are, unfortunately, not available because phenology observation has been suspended since then.
For each species, phenology of five randomly chosen healthy mature individuals were monitored in accordance with the Method of Phenology Observation in China (Wan & Liu Reference WAN and LIU1979), where the dates that three (out of the five) individuals began to open leaf buds, shed leaves, flower and drop all flowers were recorded. Thus, the observation is an estimation of the phenology on species-level rather than on specific individuals. The observation was conducted by fixed staff members once a week. During the period of phenological occurrence, it was scheduled on a daily basis.
Climatic data, including air temperature, rainfall and sunshine duration, from a meteorological station in the botanical garden during 1971–2008 were used to reveal the climatic impacts on phenology. The monitoring procedure has followed relevant requirements stipulated by the China Meteorological Administration (CMA).
Statistical methods
Phenological dates were transcribed to day of year (DOY) for analysis. To improve the reliability of this phenological dataset, outliers beyond twice standard deviation (i.e. 95% confidence interval) from each phenological series were discarded.
Mann–Kendall (MK) test was applied to determine if any consistent phenological trends were presented during the study period. MK test is a non-parametric test based on the Kendall rank correlation to identify monotonic trends in time series, and it is not sensitive to data interruption (Jaagus Reference JAAGUS2006). From MK test, a final statistic Z was computed, which indicates the direction of the possible trend (see Kendall Reference KENDALL1975 for detailed calculation). Trend significance is determined by comparing Z to Z1-α/2, which is obtained from the standard normal cumulative distribution tables (Partal & Kahya Reference PARTAL and KAHYA2006, Tabari & Marofi Reference TABARI and MAROFI2011). In this study, significance level of α = 0.05 was applied, and a significant positive Z represents a delaying trend in budburst and flowering or a prolonging trend in growing season and flowering duration, while a significant negative Z indicates an advancing trend in budburst and flowering or a shortening trend in growing season and flowering duration. This Z was then correlated with average onset date (day of year) of each event across the 21 species to investigate whether the trend of each event was related to its occurrence time. Slopes of linear regressions between dates/days of the events and time (year) over the study period were computed to indicate the average inter-annual change rates of the events. These slopes share the same directions (i.e. signs of the values) with the statistic Z in each data series.
Correlation analysis is a direct and effective approach to reveal the impact of climate on phenology (Bendix et al. Reference BENDIX, HOMEIER, ORTIZ, EMCK, BRECKLE, RICHTER and BECK2006, Bollen & Donati Reference BOLLEN and DONATI2005). To find the climatic factors that affected the inter-annual variation of each phenological event, Spearman correlation coefficient between dates (or days) of the phenological events and climatic factors was computed over the study period. Factors used are mean temperature, mean maximum temperature, mean minimum temperature, rainfall and sunshine duration in the three seasons. Annual factors were also involved in the cases of growing season and flowering duration because they may better explain the events that lasted for more than one season.
RESULTS
Trends in phenological events
Of the 21 studied species, 14 species (67%) showed significant trends in the studied phenological events (Figure 2). In budburst, seven species (33%) delivered significant trends which delayed budburst by 1.4 ± 0.8 d y−1 (Figure 2a). In the growing season, four species (19%), including three species of Mimosaceae, presented significant trends and prolonged the length by 3.5 ± 0.5 d y−1 (Figure 2b). Besides the species with significant trends, eight and nine species also showed positive slopes in budburst and growing season, respectively, indicating the phenological shifts (i.e. delay of budburst and extension of growing season) were prevalent among the species.

Figure 2. Temporal shift rates (slopes of linear regression) of the phenological events for the species in Xishuangbanna. Species with significant trend, determined by MK test (P < 0.05), are noted with asterisks (*). A positive slope indicates a delay in date of budburst/flowering or an extension in growing season/flowering duration. A negative slope indicates an advance in date of budburst/flowering or a shortening in growing season/flowering duration. Species codes as given in Appendix 1.
In flowering, significant trends were shown in three species (Figure 2c), where two (10%) delayed (positive) the date of flowering and one (5%) advanced it (negative). Over all the species, positive slopes (delaying) were dominant, being presented in 15 species (67%). In flowering duration (Figure 2d), negative (shortening) trends (2.1 ± 1.0 d y−1) were presented in five species (24%). Besides, 10 species (48%) showed positive slopes (prolonging) but failed to present any significant trends.
Relationship between phenology and climatic factors
Overall, 68 of the 84 studied phenological cases (81%) are correlated with climatic factors (Appendix 2). For the 19 cases with significant trends, 18 of them are climate-correlated, indicating that these changes in phenology were most likely to be induced by climate change.
Onsets of budburst occurred during the hot-dry season in most species (Appendix 2). Budburst is the only event with all the species well correlated with climatic factors. Of the seven species that presented significant trends, sunshine duration in the cool-dry season (Sun-C) positively correlated with three species, while mean maximum temperature in the cool-dry season (Tmax-C) negatively correlated with another four species, indicating the increase of Sun-F advances budburst while increase of Tmax-C delays it. For other species with no significant trends, temperature factors are also important and, interestingly, temperatures in the cool-dry season were usually negatively correlated with budburst while temperatures in the hot-dry season positively correlated with budburst. By contrast, factors of rainfall and sunshine were less important for budburst, as they only correlated with five and three species, respectively.
Length of growing season varied from 5 to 8 mo (Appendix 2). Temperature factors were in correlation with 13 species (62%, including the four species with a significant trend), and the coefficients were mostly positive (but see exceptions Dipterocarpus turbinatus, Hopea hainanensis and Erythrina indica), indicating thermal conditions are crucial for growth of the trees. Significant coefficients of rainfall and sunshine duration only presents in four and two species, respectively. Still, there are four species (19%) not correlating with any climatic factors.
Compared with vegetative events, flowering was less affected by climatic factors as six species were not climate-correlated, which includes all the four Bignoniaceae species (Appendix 2). Dates of flowering varied among species and the factors that influenced them were also different. For example, the species of Combretaceae, Mimosaceae and Papilionaceae were mostly correlated with temperature factors in the dry season, while Dipterocarpaceae species were mainly correlated with sunshine duration or rainfall. Moreover, the same factors presented different effects on different species, e.g. increase of sunshine duration in cool-dry season can advance flowering date in D. retusus but delay the date in D. turbinatus. It seems that flowering is relatively conservative and the conditions required for flowering are particularly different among species.
Flowering duration was generally 1–2 mo (Appendix 2) and mainly correlated with temperature and sunshine duration. Yet, rainfall presented little effects on flowering duration (apart from in Kigelia pinnata). For the species with significant trends, sunshine duration in rainy season (Sun-R) was a common factor that positively correlated with all of them. Besides, there were still five species not correlated with climatic factors.
Effect of occurrence time on trends delivery
The occurrence time showed a significant effect on the trend performance in the events of budburst and flowering duration (Figure 3). This means the early-budburst species were more likely to present a delaying trend and the late-flowering species (especially those that flowered in the rainy season) tended to show a shortening trend in flowering duration.

Figure 3. Correlations between occurrence time (day of year ± SE) of the phenological events and statistic Z (from MK test) across 21 species in Xishuangbanna, where Z represents the significance of temporal trends of the events. A higher absolute value of Z indicates the trend is more significant. A positive Z denotes a delay in budburst/flowering or an extension in growing season/flowering duration, and a negative Z denotes an advance in budburst/flowering or a shortening in growing season/flowering duration. Vertical lines denote the start of rainy season.
DISCUSSION
During the study period, 14 species (67%) showed consistent trends in phenology and the regional temperature increase appears to be one of the major forces that cause these changes, which agrees with our hypothesis. Our knowledge of how climate change has affected the phenology of tropical plants has long been limited due to the lack of long-term data. Borchert (Reference BORCHERT1998) argued that, rather than temperature itself, the significant reduction in rainfall induced by global warming is more likely to exert influences on plant phenology in tropical areas, however, failed to provide direct evidence. This assumption is not consistent with our results, where the rainfall, which showed a slight increase (but not significant, Figure 4) during 1971–2008, only presented minor effects on inter-annual variations of the plant phenology directly. By contrast, the relatively inadequate thermal conditions (i.e. the mean temperature of 21.9 °C ± 3.7 °C is generally lower than typical tropical regions due to the location of Xishuangbanna) was made more crucial to the phenology of tropical plants there.
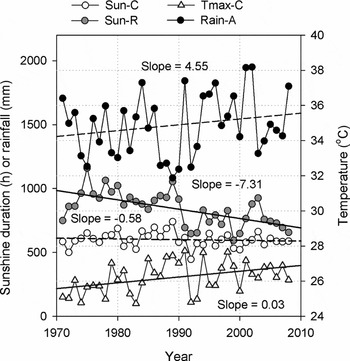
Figure 4. Inter-annual variations of four climatic factors (1971–2008) in Xishuangbanna, which are mean maximum temperature in cool-dry season (Tmax-C), sunshine duration in cool-dry season (Sun-C), sunshine duration in rainy season (Sun-R) and annual rainfall (Rain-A). Lines of linear regression were added to show temporal trends, where a solid line indicates a significant trend (MK test, P < 0.05) and a dashed line indicates an insignificant trend. Slopes of the fitted lines show the shift rates (°C y−1, h y−1 or mm y−1).
In vegetative events, the trend of budburst delay, which was unexpected, is mostly like to be driven by the increase of the maximum temperature in the cool-dry season (Tmax-C, Figure 4) in four species. This can be explained by the severe drought in the cool-dry season (Figure 1). During the driest period of a year, temperature (especially the maximum temperature) increase would enhance water loss from soil and further reduce the positive turgor pressures necessary to expand growing cells (Green & Cummins Reference GREEN and CUMMINS1974), which could, then, postpone the development of leaves. By contrast, rainfall in the hot-dry season is twofold that in the cool-dry season and most species started to develop their leaves during this period. With relatively more water available, a sufficient thermal condition would shorten the time of temperature accumulation for plants and cause an earlier budburst. This led to the positive correlation between temperature in the hot-dry season and budburst dates in many species. Although rainfall hardly presented a direct impact on budburst, it seems that the effects of temperature depended largely on the moist conditions. The delay of budburst, accompanied by the increasing maximum temperature in the dry season, is probably unique for those drought-sensitive species in such tropical areas with a typical dry season.
Furthermore, we found that the early-budburst species (i.e. those presented budburst during periods with little rainfall) were more likely to delay the budburst dates, which may result in a more synchronous budburst pattern among species. This result contradicts the finding in temperate plants that the species with earlier spring phenology (e.g. budburst) can advance more days in the corresponding event as temperature increases (Menzel et al. Reference MENZEL, SPARKS, ESTRELLA, KOCH, AASA, AHAS, ALM-KUBLER, BISSOLLI, BRASLAVSKA, BRIEDE, CHMIELEWSKI, CREPINSEK, CURNEL, DAHL, DEFILA, DONNELLY, FILELLA, JATCZA, MAGE, MESTRE, NORDLI, PENUELAS, PIRINEN, REMISOVA, SCHEIFINGER, STRIZ, SUSNIK, VAN VLIET, WIELGOLASKI, ZACH and ZUST2006, Wolkovich et al. Reference WOLKOVICH, COOK, ALLEN, CRIMMINS, BETANCOURT, TRAVERS, PAU, REGETZ, DAVIES, KRAFT, AULT, BOLMGREN, MAZER, MCCABE, MCGILL, PARMESAN, SALAMIN, SCHWARTZ and CLELAND2012). Under different environmental conditions, the delay of budburst in our study seems to be an avoidance of unfavourable conditions (i.e. drought), while the budburst advance in temperate plants is probably a strategy to maximize their length of growing season under more favourable conditions (i.e. warmer climate).
Although delay of budburst was performed in many species, the extension in growing season is still prevalent, which, considering the strong correlation with temperature, could generally be attributed to the warming climate. This agrees with most studies in temperate areas (Chen et al. Reference CHEN, HU and YU2005, Matsumoto et al. Reference MATSUMOTO, OHTA, IRASAWA and NAKAMURA2003, Menzel & Fabian Reference MENZEL and FABIAN1999). Increase in length of growing season is regarded as a cause that can enhance the carbon fixation by plants and further accelerates the growth (White et al. Reference WHITE, RUNNING and THORNTON1999). In this regard, for the tropical plants in Xishuangbanna, the warming climate could be a compensation for the thermal deficit and may benefit their growth.
In reproductive events, five species shortened the flowering duration and, according to the correlation with the occurrence time, such change was more likely to present in plants that flowered during the rainy season. A short flowering duration shortens the period of pollination, and may further reduce the chance of successful pollination, especially in the rainy season when pollinating insects are less active because of the frequent rainfall. In this regard, such change in flowering duration could be a threat for the propagation of these plants. By contrast, length of pollen season (i.e. period of pollination) of many plants in temperate regions was found to have extended due to the warming environment (D'Amato et al. Reference D'AMATO, LICCARDI, D'AMATO and CAZZOLA2002, Frenguelli Reference FRENGUELLI2002, Ziska et al. Reference ZISKA, KNOWLTON, ROGERS, DALAN, TIERNEY, ELDER, FILLEY, SHROPSHIRE, FORD, HEDBERG, FLEETWOOD, HOVANKY, KAVANAUGH, FULFORD, VRTIS, PATZ, PORTNOY, COATES, BIELORY and FRENZ2011). This difference may result from the different climatic drivers. For tropical plants, light condition, rather than temperature, is of more importance in controlling the flower phenology (Calle et al. Reference CALLE, STRAHLER and BORCHERT2009, Reference CALLE, SCHLUMPBERGER, PIEDRAHITA, LEFTIN, HAMMER, TYE and BORCHERT2010; Zimmerman et al. Reference ZIMMERMAN, WRIGHT, CALDERON, PAGAN and PATON2007). In this study, the decreasing sunshine duration in the rainy season (Sun-R, Figure 4) was most likely to have influenced the flowering duration, mostly in the species with high light demand (e.g. Terminalia catappa, Dipterocarpus retusus, Samanea saman; Appendix 1). In Xishuangbanna, sunshine duration in the rainy season is relatively lower (Figure 1) due to the cloudy weather and frequent rainfall, and its further reduction could become a restriction for these species that led to the decline of flowering duration. Therefore, plants that flower during the dry season with peak irradiance may have more advantages in reproduction.
To our knowledge, this is the first study regarding the inter-annual phenological trends in tropical plants with data series of more than 10 y. Although the study periods are slightly different among species (Appendix 1), the results demonstrated the fact that the phenology of tropical plants has been affected by climate change significantly but the reaction has been somewhat different from temperate plants. Yet, as phenological responses of tropical plants vary across regions of different climatic features, more studies of phenological trends from other tropical areas are still needed.
ACKNOWLEDGEMENTS
We sincerely thank the gardening group in Xishuangbanna Tropical Botanical Garden and Xishuangbanna Station for Tropical Rain Forest Ecosystem Studies (XSTRE) for the phenology and climate data they provide, respectively. This study was funded by the CAS 135 Programme (XTBG-F01), National Natural Science Foundation of China (30670395), Knowledge Innovation Programme of Chinese Academy of Sciences (KSCX2-YW-Z-004) and Yunnan Natural Science Foundation (2004C0053M).
Appendix 1. A list of the names of the studied species and their study periods, origins of their seeds or seedlings, codes (which were used in the figures and appendix), native range and habitat, potential ecological trait and the sources of the information. Names of the species are in accordance with Li et al. (Reference LI, PEI and XU1996). NA: no authoritative reference available.

Appendix 2. Climatic factors in Xishuangbanna that correlated with the phenological events. It shows average day of year (DOY) or duration (± SD) that the events occur or last for, and a list of three (some less than three) significant climatic factors (P < 0.05) for each event. Species codes as given in Table 1. Factors (i.e. Tave, Tmax, Tmin, Rain and Sun) represent average temperature, mean maximum temperature, mean minimum temperature, rainfall and sunshine duration, respectively. Periods that the factors cover are showed following them (C, cool-dry season; H, hot-dry season; R, rainy season; A, annual). Correlation coefficients (r) of the factors are presented within parentheses, where a positive r indicates that the increase of the factor advances or prolongs the event, and a negative r delays or shortens it. NS, no significant factors are available (P > 0.05).


