INTRODUCTION
Tropical rain forests are well known for their immense biodiversity, but paradoxically, monodominant, low-diversity forests can also be found in the tropics where the upper canopy layer is dominated by a single species (Connell & Lowman Reference CONNELL and LOWMAN1989). Monodominant tropical forests on well-drained soils can be found in all continents (Degagne et al. Reference DEGAGNE, WENKEL, STEINBERG and FOX2009, Hart et al. Reference HART, HART and MURPHY1989, Nascimento & Proctor Reference NASCIMIENTO and PROCTOR1997, Whitmore Reference WHITMORE1984).
Connell & Lowman (Reference CONNELL and LOWMAN1989) proposed two contrasting mechanisms through which species can attain dominance: (1) through fast recruitment and growth in unstable habitats with high disturbance, and (2) through competitive exclusion in stable habitats with low disturbance. Traits proposed to be involved in attaining monodominance in stable habitats include mast fruiting, which may satiate predators and lead to massive recruitment (Visser et al. Reference VISSER, JONGEJANS, VAN BREUGEL, ZUIDEMA, CHEN, KASSIM and DE KROON2011) and poor seed dispersal, large seeds and shade tolerance that may result in a dense seedling carpet on the forest floor (Peh et al. Reference PEH, LEWIS and LLOYD2011a, Torti et al. Reference TORTI, COLEY and KURSAR2001, Zagt & Werger Reference ZAGT and WERGER1997). Architectural traits such as the formation of a deep crown can cause substantial shading which, in combination with shade-tolerant juvenile stages and the production of tough, poor-quality leaves may result in a thick litter layer on the forest floor, thus blocking regeneration of other species (Torti et al. Reference TORTI, COLEY and KURSAR2001).
Many monodominant tropical species are ectomycorrhizal (Newbery et al. Reference NEWBERY, SONGWE, CHUYONG, Newbery, Prins and Brown1998, but see Torti & Coley Reference TORTI and COLEY1999) which may enable them to acquire nutrients more efficiently than their non-ectomycorrhizal competitors, especially on poor soils. Early studies also suggest that high soil toxicity, shallow soils or low nutrient levels can contribute to monodominance when a species is more stress-tolerant than its competitors (Ashton Reference ASHTON1971, Davis & Richards Reference DAVIS and RICHARDS1934). However, in contrast to these intuitive observations, no significant differences have been found in soil-bound nutrients between monodominant forest and adjacent mixed forest (Hart et al. Reference HART, HART and MURPHY1989, Martijena Reference MARTIJENA1998, Nascimento et al. Reference NASCIMENTO, PROCTOR and VILLELA1997, Peh et al. Reference PEH, SONKE, LLOYD, QUESADA and LEWIS2011b).
Clearly, monodominance on well-drained soils in the tropics is complex and likely to be caused by a combination of mechanisms (Peh et al. Reference PEH, LEWIS and LLOYD2011a). So far, most of the recent discussions of monodominance in tropical forests have mainly focused on a few species in Africa and the Neotropics (but see Hart et al. Reference HART, HART and MURPHY1989 for older reports from Asia). This study focuses on Parashorea chinensis, a dipterocarp monodominant species in South-West China. Parashorea chinensis dominates the canopy in patches that are up to several hectares in size, surrounded by a matrix of mixed forest. Historically shifting cultivation was practised in the region leading to a mosaic of forests in different successional stages. Here we evaluate the potential causes for P. chinensis monodominance and test the following hypotheses: (1) The understorey of monodominant patches is floristically different from the mixed forest, and P. chinensis dominance will result in reduced species richness; (2) monodominant patches are structurally different from mixed forest (because of the large size of P. chinensis monodominant patches will have higher basal area and mean stem diameter); (3) P. chinensis distribution is driven by edaphic conditions, and since it is mainly present in valleys and slopes, it is likely to favour soils with a higher fertility; and (4) alternatively, monodominant patches are remnants of primary forest surrounded by secondary mixed forests that established on former agricultural fields.
METHODS
Study site and species
Research was carried out in the tropical seasonal rain forest of Xishuangbanna (21°36′42′′N, 101°34′26′′E) in Yunnan Province, South-west China. This region has a monsoonal climate with a mean annual precipitation of 1493 mm y−1 of which about 80% falls between May and October. The area is characterized by steep hills, ranging between 500 and 2500 m asl, and contains for the largest part laterite soils, developed from siliceous rock that are typically red with a thin humus horizon and a pH of 4.5–5.5 (Cao et al. Reference CAO, ZOU, WARREN and ZHU2006). The seasonal rain forest is at the northern and altitudinal limits of tropical lowland forest in Asia (Zhu et al. Reference ZHU, CAO and HU2006) and it is dominated by species from the Rubiaceae, Lauraceae, Euphorbiaceae, Annonaceae and Moraceae (Zhu Reference ZHU2006). There are few Dipterocarpaceae species, but they dominate the canopy where they are present.
Parashorea chinensis H. Wang is an emergent tree that can attain a height of 60 m and a maximum diameter of 1.5 m. It is generally restricted to mountain slopes, valleys and hills, and dominates in patches ranging from 0.5 to several hectares in size.
Floristic plots
To analyse differences in structure, species richness, composition and edaphic conditions between monodominant forest and mixed forest, 28 20 × 20-m plots were established; 14 in monodominant patches and 14 in the mixed forest adjacent to the patches. Twenty-two plots were established in the 20-ha permanent forest dynamics plot of the Centre for Tropical Forest Science (CTFS) in Xishuangbanna, and six additional plots were established just outside the CTFS plot. Since we had permission to work in and around the CTFS plot, but not in the larger forest reserve, we were able to include two independent Parashorea chinensis patches only. The patches consisted of several sub-patches due to the strong habitat preference of Parashorea for lower slopes. We designed our plot sampling in such a way that we covered as much of this sub-structure as possible. The CTFS plot is divided into subplots of 20 × 20 m. The scientific name, diameter at breast height (dbh) and location of each woody plant ≥1 cm is known, as well as the slope and elevation of each subplot. Monodominant patches in the CTFS plot were identified by mapping all P. chinensis individuals >10 cm dbh in ArcGIS and plots were selected where two or more individuals were present. Mixed-forest patches were selected adjacent to the monodominant plots, i.e. between 20 and 60 m from the monodominant plots, and when possible at similar elevation. For the six additional plots the dbh was measured for each tree and the species were identified. Trees ≥5 cm dbh were measured in the whole plot, whereas saplings (1–5 cm dbh) were measured in a cross-sectional transect (2.6 m wide) running through each subplot. A minimum of 25 saplings were measured in each plot. Leaf samples were taken and species were identified at the XTBG herbarium (HITBC).
Soil samples
Top soil layers are often strongly affected by the vegetation growing on top of them, potentially leading to correlation between soil measurements and species composition (Duivenvoorden Reference DUIVENVOORDEN1995). To reduce this risk we sampled below the top soil layer in the mineral soil at a depth of 25–40 cm using a soil auger. Five samples were taken in the centre and the four corners of each subplot, and then bulked to one sample. Chemical and physical analyses were done at the Chinese Academy of Sciences. Particle size was measured using the pipette method (LY/T 1225–1999) and then classified into clay (<0.002 mm), silt (>0.002 to <0.02 mm) and sand (> 0.02 mm). Soil pH was determined by potentiometry with a soil:water solution (1:2.5). Concentrations of total Ca, Al, Mg, S, Fe, Mn and Na were determined using a digestion with HClO4–HF. Total N and C were measured with a Macro Elemental Analyzer. Available P was extracted by 0.03 mol L−1 NH4F – 0.025 mol L−1 HCl and determined by colorimetry. Available K was extracted with 1 mol L−1 CH3COONH4 (pH = 7.0). Finally, presence or absence of charcoal in the samples was recorded to determine presence or absence of past human land use which involved the use of fire for forest clearance.
Data analysis
To describe differences in forest structure between the monodominant and mixed patches, a size class distribution was made for each patch type using 10 dbh classes of 10 cm width (≥5 cm to <15 cm, ≥15 cm to <25 cm, etc., with the last class being ≥95 cm). Subsequently a t-test was applied to each size class to evaluate whether monodominant and mixed patches had a different tree density per size class. To evaluate whether P. chinensis dominance negatively affected species richness, diversity and species evenness, Shannon–Weaver’s, Simpson's and Fisher's alpha indices were calculated for each plot. These indices were calculated using the formulas provided in the package VEGAN 2.0 in R 2.13.1 (CRAN core-development team).
Differences in species composition between monodominant and mixed patches were analysed using the relative importance value (RIV) (Cottam & Curtis Reference COTTAM and CURTIS1956). RIV is defined as the sum of the Relative Dominance (Rdom), Relative Density (Rden) and Relative Frequency (Rfreq) (Appendix 1) and was calculated per species for each forest type for the tree layer (≥5 cm dbh) and the sapling layer (1–5 cm dbh). The maximum RIV is 300. Correlation between plot RIV scores of P. chinensis and soil variables were made to examine whether P. chinensis dominance was related to edaphic and environmental conditions.
The floristic composition of the plots was analysed with a detrended correspondence analysis (DCA) using CANOCO for Windows 4.5. The analysis was based on the abundance of the species and was done separately for trees and saplings. Environmental variables and edaphic variables were added later to the DCA, to explore the relationships between floristic composition and the abiotic environment. Student's t-tests were done on the plot scores of the first two axes, to evaluate whether the monodominant and mixed patches differed significantly in species composition. Additionally a constrained Canonical Correspondence Analysis with a forward selection procedure with permutation tests was done, to evaluate which soil variables significantly explain variation in species composition. Differences in structure, species richness, species composition and edaphic conditions between monodominant and mixed patches were analysed using t-tests. All statistical analyses were performed using SPSS 17.0 (SPSS Inc., Chicago, IL).
RESULTS
Floristics
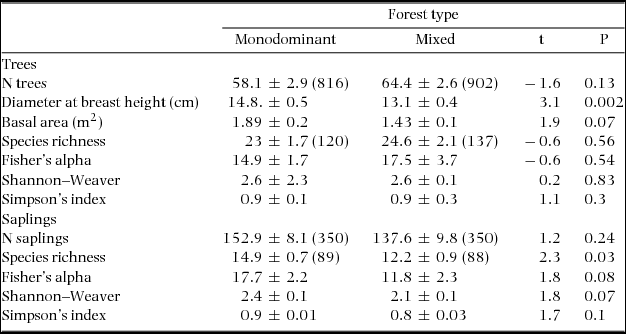
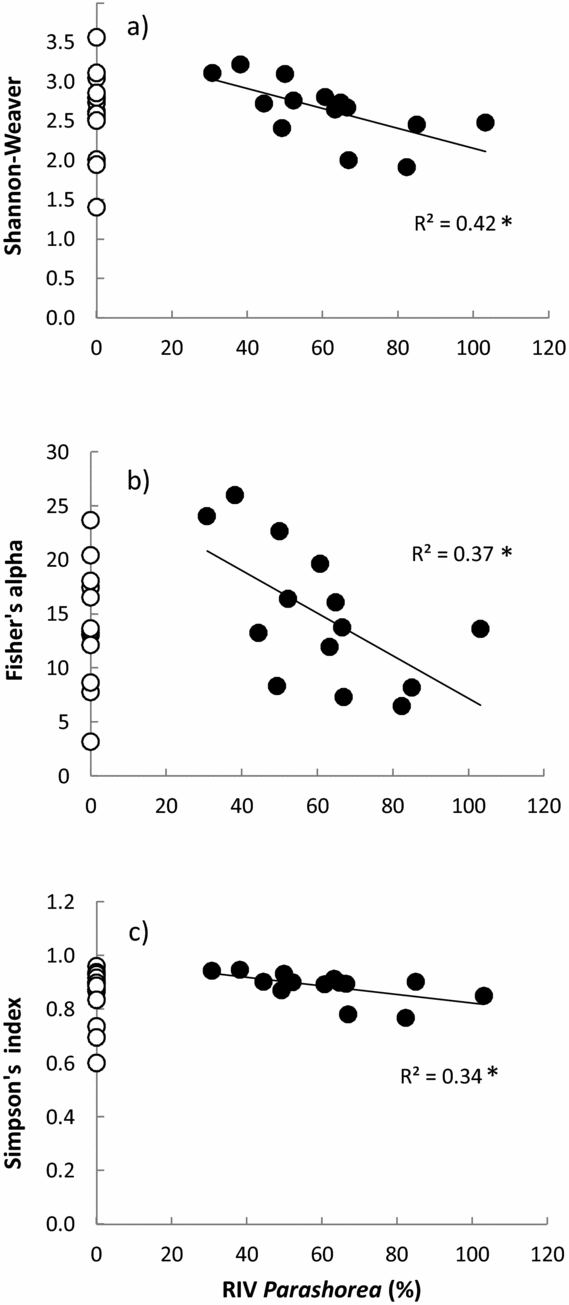
On average the monodominant plots had a similar number of species per plot (23.1) as the mixed plots (24.8) for the tree layer, but significantly more species (14.9 versus 12.2) per plot in the sapling layer (Table 1). Diversity (Fisher's alpha, Shannon–Weaver and Simpson's index) was similar for the two forest types, but correlated negatively with a continuous measure (RIV) of P. chinensis dominance, when only the monodominant patches were considered (Figure 1; Pearson's r Shannon–Weaver = −0.65, P = 0.01; r Fisher's alpha = −0.60, P = 0.02; r Simpson's index = −0.59, P = 0.03, n = 14 in all cases).
Table 1. Summary of stand characteristics, tree species richness and diversity indices of monodominant and mixed forest plots (20 × 20 m) in a tropical seasonal rain forest of Xishuangbanna, China. Values are given separately for trees (≥5 cm dbh) and saplings (dbh 1–4.9 cm). Values are mean ± SE, n = 14 for both forest types. For N trees and species richness the total number of trees and species is indicated in parentheses. Differences between the forest types where tested using a student's t-test (P < 0.05).


Figure 1. Relationships between diversity indices and the relative importance values (RIV) of Parashorea chinensis in a tropical seasonal rain forest of Xishuangbanna. Regression line, coefficient of determination, and significance are shown for Shannon–Weaver vs RIV (a), Fisher's alpha vs RIV (b) and Simpson's index vs RIV (c). Filled dots indicate the monodominant forest plots (n = 14) and open dots indicate the mixed forest plots (n = 14). For Fisher's alpha one mixed-forest plot with an extreme value (62) is not shown.
Structure
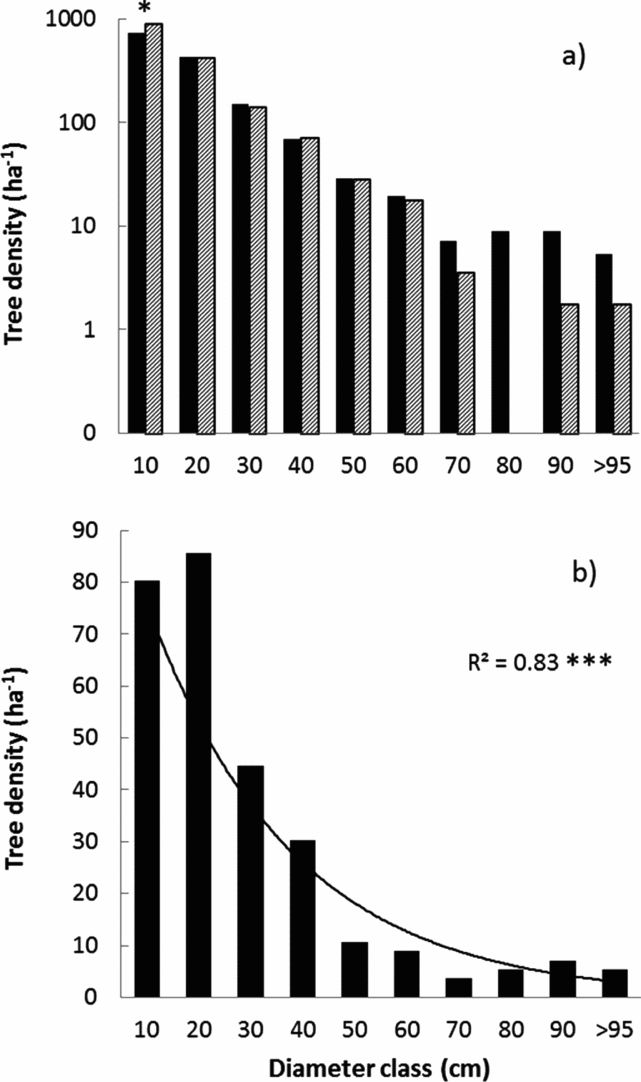
Stem density varied strongly ranging from 37 to 78 stems per plot. However, tree and sapling density did not differ significantly between forest types (Table 1). Both forest types showed a negative exponential diameter distribution (Figure 2a). There were significantly fewer trees present in the first diameter class (5–15 cm dbh) of the monodominant forest (t = 2.47, P = 0.02) whereas tree density in the second to sixth classes was statistically similar. Mean dbh was significantly higher and basal area tended to be higher in monodominant compared with mixed patches (Table 1). Diameter distribution of P. chinensis in the monodominant patches also showed a negative exponential distribution (r2 = 0.83, P < 0.001, n = 10 diameter classes), with the exception of the second diameter class (15–25 cm), which contained more trees than expected (Figure 2b).

Figure 2. Tree diameter distributions in a tropical seasonal rain forest in Xishuangbanna. Tree density-size distributions of monodominant forest (dark bars) and mixed forest (hatched bars) (a). Size classes are in 10-cm dbh intervals starting at 5 cm dbh, i.e. 10 indicates the diameter class 5–15 cm. Note that the y-axis has a log10-scale. Diameter distribution of Parashorea chinensis in the monodominant patches (b). The regression line indicates a negative exponential distribution (R2 = 0.83, P < 0.001, n = 10 diameter classes).
Relative importance
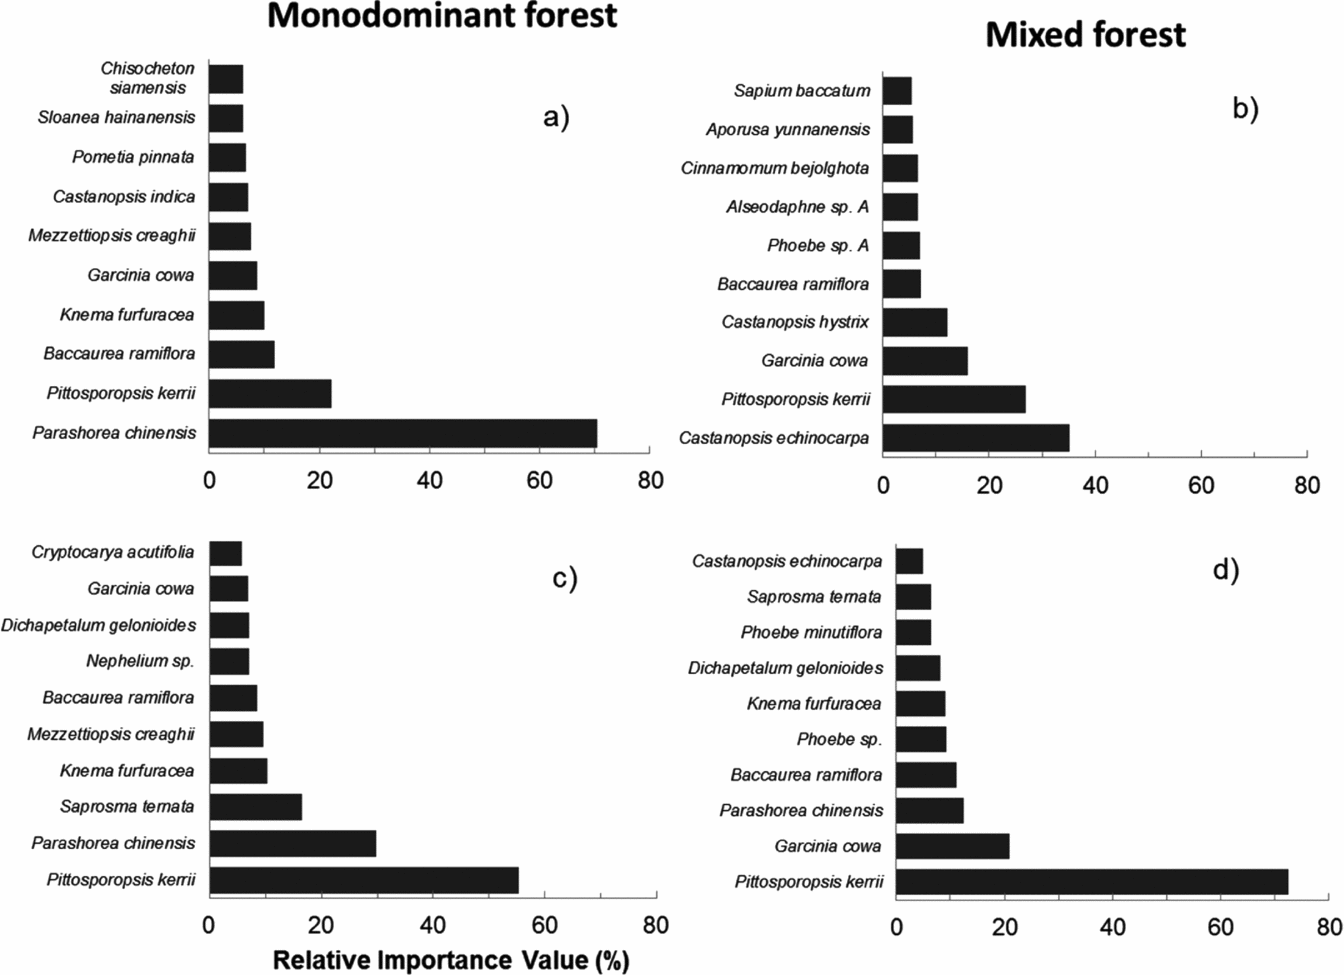
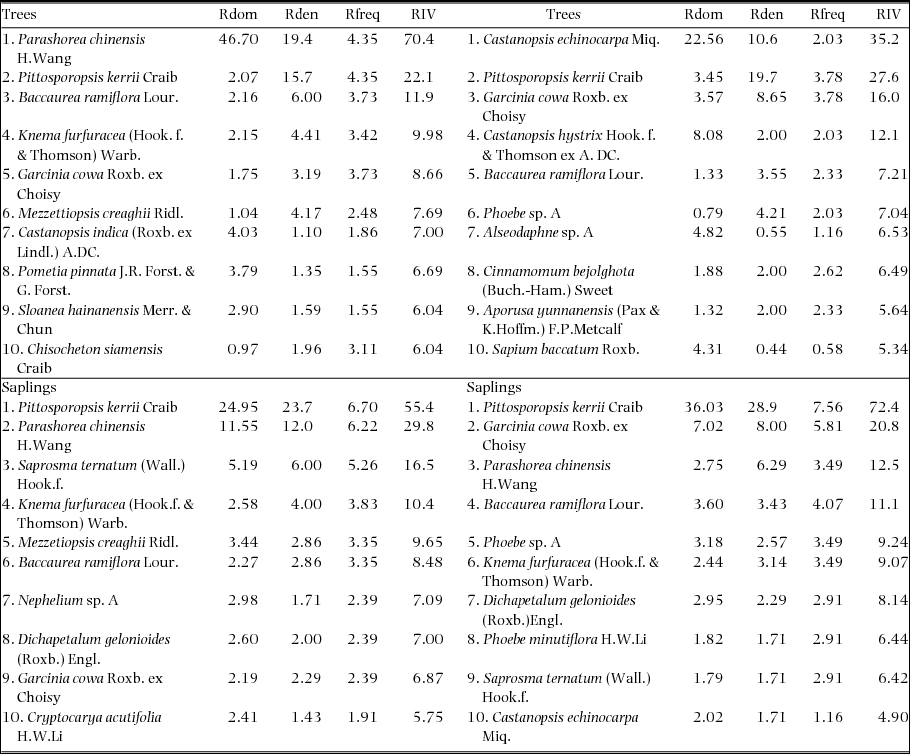
Parashorea chinensis was present in 14 plots with a total of 160 individuals making it the second-most commonly observed species (Figure 3). Relative importance value (RIV) demonstrated differences in the composition of the most dominant species between the forest types. Of the 10 species that were most dominant in each forest type, only three species (Pittosporopsis kerrii Craib, Baccaurea ramiflora Lour. and Garcinia cowa Roxb. ex Choisy) were common to both monodominant and mixed forest (Figure 3, Appendix 2). In the monodominant patches, P. chinensis clearly had the highest RIV (70), whereas the other species were much less dominant (RIV < 22). In the mixed forest the most dominant species was Castanopsis echinocarpa Miq. (RIV = 35) and the RIV scores of the species were much more evenly distributed, indicating the absence of a clear dominant species. Pittosporopsis kerrii dominated the sapling layer in both forest types (RIV is 55 in monodominant vs. 72 in mixed forest), with P. chinensis being the second-most dominant species in the monodominant patches. Surprisingly, the sapling layer of the mixed patches was strikingly more monodominant than the sapling layer of the monodominant patches, and also contained P. chinensis as the third-most dominant species (Figure 3).

Figure 3. Relative importance value (RIV) of the 10 most important tree species in a tropical seasonal rain forest of Xishuangbanna. RIV is calculated for trees (≥5 cm dbh) and saplings (1–4.9 cm dbh) in monodominant (a, c) and mixed forest (b, d). To calculate the RIV all 14 plots per patch type were pooled.
Species composition
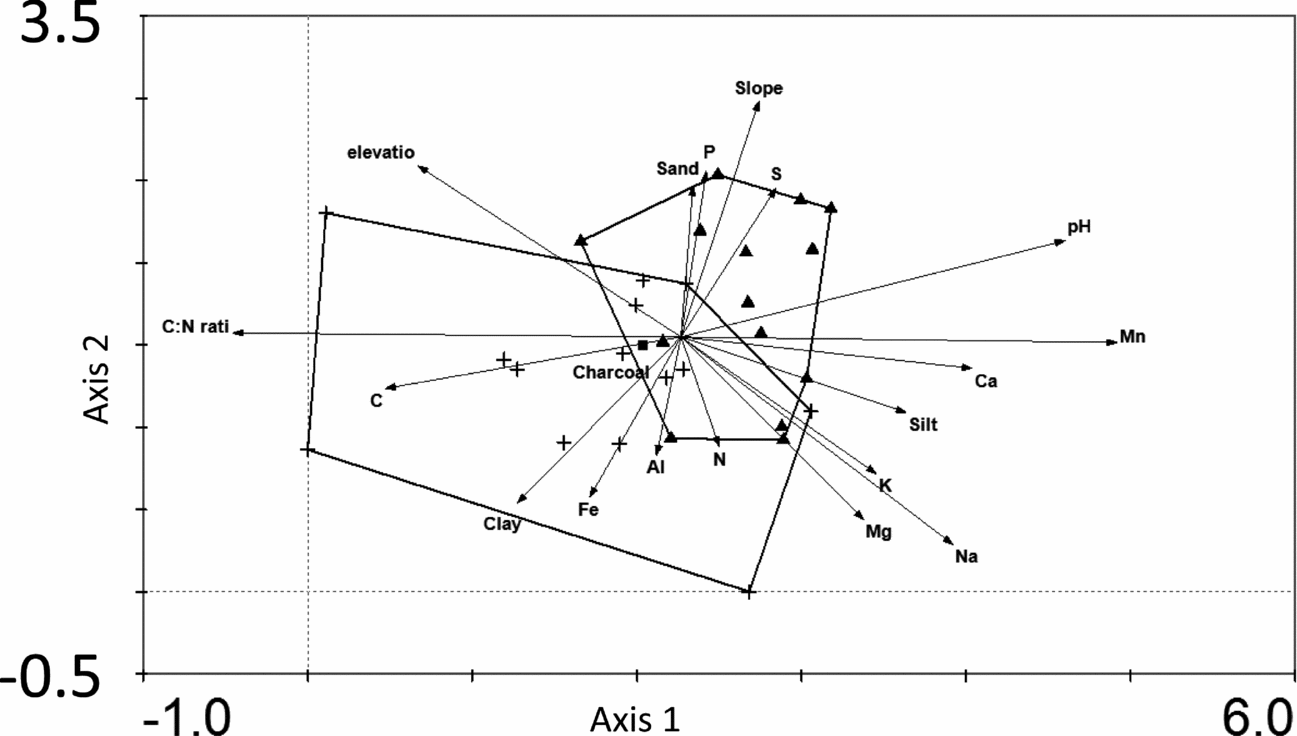
The floristic composition of plots was described with a Detrended Correspondence Analysis (DCA) for trees (Figure 4) and for saplings (Appendix 3). The first axis of the analysis based on trees explained 13.7% of the variation in species composition, and the second axis 5.5%. The first axis was positively associated with C:N ratio (Pearson's r = 0.68) and negatively associated with Mn (r = −0.69) and the second axis was positively associated with slope (r = 0.35) and negatively associated with Mn (r = −0.39). The monodominant forest plots had significantly lower scores on the first axis (t = 4.89, n = 28, P < 0.001) and the second axis (t = 2.14, n = 28, P = 0.04) (Figure 4). A Canonical Correspondence Analysis with forward regression procedure confirmed that species composition of the trees was significantly explained by C:N ratio (F = 13, P = 0.002), followed by Mn (F = 1.54, P = 0.006) and slope (F = 1.35, P = 0.05). These three factors alone explained 17.6% of the variation in species composition.
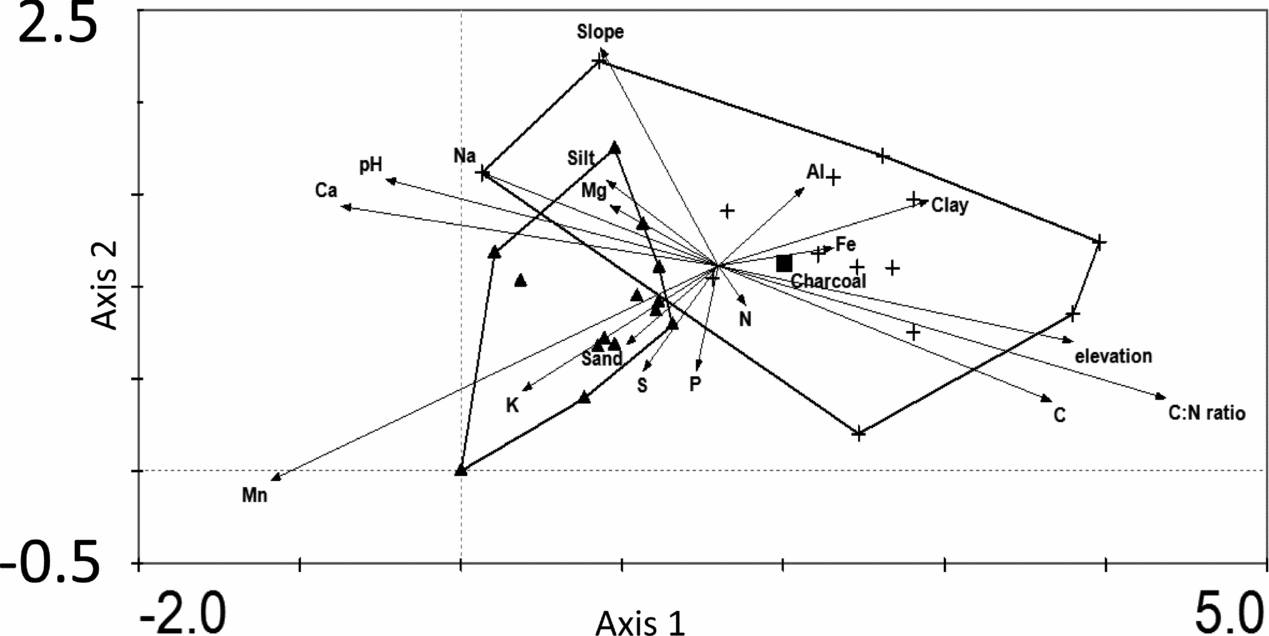
Figure 4. Detrended Correspondence Analysis of the floristic composition of trees (≥ 5 cm dbh) in monodominant patches (triangles) and mixed-forest patches (crosses) in a tropical seasonal rain forest of Xishuangbanna. Arrows show the axis loadings of geographic variables (elevation, slope), soil texture (sand, silt, clay) and edaphic conditions (pH, C, P, K, N, Al, Fe, Mg, Mn, Na and C:N ratio). The presence of charcoal is indicated with a box. Outer boundaries of the two forest types are indicated with lines and show the overlap between the two forest types.
The DCA for the saplings generated similar results to the DCA for trees (Appendix 3). The two forest types differed significantly in their scores on the first axis (t = −3.5, n = 28, P = 0.002) and the second axis (t = −2.1, n = 28, P = 0.04). The first axis was positively associated with Mn (Pearson's r = 0.68) and negatively associated with C:N ratio (r = −0.70), and the second axis was negatively associated with slope (r = −0.41) and clay (r = −0.31). The ordination plot scores of the trees and the saplings were significantly correlated (first axis, r = −0.80, P ≤ 0.01, second axis; r = −0.38, P ≤ 0.044), indicating that species composition of the tree and sapling layer resembled each other, and that floristic differences between the forest types will persist in future when saplings recruit into the tree layer.
Edaphic conditions
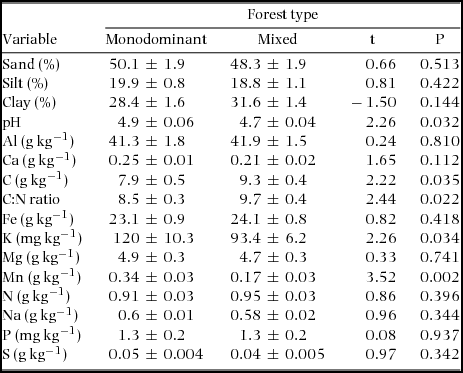
Soil texture consisted mostly of sand (49%) with smaller proportions of silt (18%) and clay (30%). The two forest types did not differ significantly in soil texture (Table 2). Monodominant patches had significantly higher pH (4% higher), Mn concentration (100% higher) and K concentration (29% higher) compared with the mixed forest. Mn concentrations in the monodominant patches were twice (0.34 g kg−1 vs. 0.17 g kg−1) those of the mixed forest. Monodominant patches also had a significantly lower organic carbon concentration (15% lower), and therefore also a lower C:N ratio (12% lower). The other nutrients did not differ significantly between the two forest types. Charcoal was found twice as often (85% vs. 43% of the plots) in mixed compared with monodominant plots, but this was not significantly different (χ2 = 2.29, P = 0.13). A quick visual analysis of the soil pits showed, in both forest types, a high variation of the depth where charcoal was located. The local dominance (RIV) of P. chinensis was positively correlated to Mn (Pearson r = 0.62, n = 28, P < 0.001) and K (r = 0.42, P = 0.028, n = 28) but not related to any of the other soil variables or geographic variables (elevation and slope).
Table 2. Comparisons of soil texture and edaphic conditions of the monodominant and mixed forest plots in a tropical seasonal rain forest of Xishuangbanna. Values are mean ± SE, n = 14 for both forest types. The results of a t-test, the t value, and significance (P) are shown. df = 26 except for K (df = 21.4 based on a t-test with unequal variances).

DISCUSSION
The aim of this study was to evaluate to what degree P. chinensis patches differ from the surrounding forests, and to investigate the underlying mechanisms explaining these differences. The monodominant patches were indeed structurally and floristically different from the surrounding mixed forest. Parashorea chinensis dominance led to reduced species diversity and monodominant patches were, surprisingly, associated with more fertile soils, in contrast to current paradigms about monodominance in the tropics.
Are Parashorea chinensis patches structurally different?
We hypothesized that monodominant patches would be structurally different from the mixed forest, because of the large size of P. chinensis. We indeed found that P. chinensis patches had a larger average stem diameter, and tended to have a larger basal area. Parashorea chinensis patches had, compared with the mixed forest, relatively many large trees and a paucity of trees in the smallest size class. Field observations also suggest that P. chinensis patches were taller and had a more heterogeneous canopy structure. Possibly, shading by these large overstorey trees may have led to less light and reduced tree regeneration in the understorey. Similarly, more large trees were present in the monodominant Gilbertiodendron dewevrei (De Wild.) J. Leonard forest in central Africa (Hart et al. Reference HART, HART and MURPHY1989) and the Peltogyne gracipiles Ducke forest in Brazil (Nascimento et al. Reference NASCIMENTO, PROCTOR and VILLELA1997), compared with neighbouring mixed forest. It is possible that tall tree species that can attain the same maximum height as P. chinensis are absent from the mixed forest, or only found in low densities (Zhu Reference ZHU1992), perhaps because our study area is at the northern limit of the tropical rain-forest zone. Large-tree species that dominate the mixed forest, such as Elaeocarpus varunua Buch.-Ham. ex Mast., Castanopsis hystrix Hook. f. & Thomson ex DC., Pometia pinnata J.R. Forst. & G. Forst., Mezzetiopsis creaghii Ridl. and Cinnamomum tenuipile Kosterm. reach maximum heights of up to 45 m which is substantially lower than the maximum height of P. chinensis that can grow up to 60 m.
Both the monodominant patches and mixed forest showed a negative exponential size distribution. We used stem diameter as an indicator of tree age as thicker trees tend to be older on average, although there is a wide scatter around this relationship (Brienen & Zuidema Reference BRIENEN and ZUIDEMA2006, Condit et al. Reference CONDIT, SUKUMAR, HUBBELL and FOSTER1998). The size distribution may therefore give a first indication of the regeneration behaviour of the species, but this should be confirmed by dynamic data. In general, the negative exponential size distribution indicates that both forest types have a healthy population structure with continuous recruitment (cf. Bongers et al. Reference BONGERS, POPMA, DEL CASTILLO and CARABIAS1988). Parashorea chinensis itself also followed a negative exponential population structure, which indicates that it is a shade-tolerant species (Wright et al. Reference WRIGHT, MULLER-LANDAU, CONDIT and HUBBELL2003). Interestingly, the second diameter class contained more individuals than expected; perhaps reflecting a recent regeneration wave, as P. chinensis is a mast-fruiting species. Chien et al. (Reference CHIEN, ZUIDEMA and NGHIA2008) found a similar negative exponential distribution for P. chinensis in Vietnam and showed with matrix models that it had a stable population. It can therefore be assumed that the local dominance of P. chinensis in Vietnam and South-West China is persistent. Seeds of P. chinensis will germinate and are able to persist under the canopy of the monodominant patches and the mixed forest. Juvenile traits such as relatively large seeds, shade tolerance and ectomycorrhizal associations give it a better chance of survival under nutrient-limited or shaded conditions (Connell & Lowman Reference CONNELL and LOWMAN1989). Parashorea chinensis is able to establish in both the monodominant and the mixed forest. However, in the mixed forest it seems not to be able to grow beyond the sapling stage, as larger individuals are almost completely absent from the mixed forest. This may be attributed to the lower soil fertility and drier conditions in the mixed forest. Alternatively, P. chinensis patches may have only recently started expanding in the mixed forest.
Do Parashorea chinensis patches differ in species composition and diversity?
Boundaries of the P. chinensis patches are abrupt and particularly visible when the emergent trees are flowering. This degree of dominance was also reflected in the importance value of P. chinensis in the patches with RIV scores of P. chinensis far exceeding values of other species. We hypothesized that monodominance would lead to a reduced species diversity, simply because the monodominant species makes up most of the community biomass. Monodominant wet tropical forest often shows significant lower species richness compared with the adjacent mixed forest (Connell & Lowman Reference CONNELL and LOWMAN1989, Hart et al. Reference HART, HART and MURPHY1989, Henkel Reference HENKEL2003, Martijena & Bullock Reference MARTIJENA and BULLOCK1994, Newbery et al. Reference NEWBERY, SONGWE, CHUYONG, Newbery, Prins and Brown1998). Surprisingly, in our study there was no significant difference in average species richness and diversity between the two forest types, however, all diversity indices were significantly negatively correlated with P. chinensis dominance (RIV) within the monodominant patches. Parashorea chinensis patches also had a different species composition compared with the mixed forest, both for the tree and sapling layers and the two forest types had few dominant species in common. This difference is likely associated with differences in edaphic conditions between P. chinensis patches and mixed forest.
Is monodominance associated with soil fertility?
Since P. chinensis is mainly present in valleys and slopes (Cao et al. Reference CAO, ZHU, WANG, LAN, HU, ZHOU, DENG and CUI2008) we hypothesized that monodominance is favoured by soils with a higher fertility and/or wetter soil conditions. Monodominant patches had indeed slightly higher pH in combination with a substantially higher Mn, K and modestly lower C and C:N ratio compared with the mixed forest. A high pH and low C:N ratio is often an indicator of a higher overall soil fertility.
Parashorea chinensis responded strongly to manganese. Manganese is an essential micronutrient that is involved in the light reaction of photosynthesis, and acts as a cofactor in 35 enzymes (Marschner & Marschner Reference MARSCHNER and MARSCHNER2012). Manganese (Mn2+) becomes available when Mn reserves in the soil (MnO2) or unavailable forms of Manganese (Mn3+) are reduced (Hue et al. Reference HUE, VEGA and SILVA2001). This occurs especially in acid soils (pH < 6) and poorly drained, anaerobic soils. Under these conditions Mn may become toxic, leading to leaf chlorosis and necrosis, and a reduced uptake of Ca and Mg (Barker & Pilbeam Reference BARKER and PILBEAM2007, Hue et al. Reference HUE, VEGA and SILVA2001). Species may vary tremendously in their tolerance to manganese (Marschner & Marschner Reference MARSCHNER and MARSCHNER2012). Given the fact that P. chinensis is dominant in acid, waterlogged patches with high Mn concentrations, it may be that P. chinensis can attain dominance because it is tolerant to Mn, whereas the other species are not.
Potassium is involved in fine-tuning the stomatal aperture, and hence, in reducing water loss from leaves (Benlloch-González et al. Reference BENLLOCH-GONZÁLEZ, ARQUERO, FOURNIERA, BARRANCOA and BENLLOCH2008). This may especially be important for an emergent tree species like P. chinensis, which has its exposed crown above the canopy, where it faces dry conditions due to high wind speed, high vapour pressure deficits, and a long water transport pathway from the soil to the leaves. The higher water requirement that comes along with being an emergent tree, may also explain why P. chinensis is associated with valleys and slopes which typically have higher soil water potentials (Markesteijn et al. Reference MARKESTEIJN, IRAIPI, BONGERS and POORTER2010).
With plant-soil associations it is always difficult to disentangle cause and effect. Trees do not only respond to soil, but they can also modify soil nutrient composition to their own benefit (Wardle et al. Reference WARDLE, BARDGETT, KLIRONOMOS, SETALA, VAN DER PUTTEN and WALL2004). For example, three monodominant ectomycorrhizal species in Korup, Cameroon, enhanced soil phosphorus concentrations through their litter input (Newbery et al. Reference NEWBERY, ALEXANDER and ROTHER1997). We feel that our results reflect tree responses to soil conditions as soil nutrients were not determined near the soil surface (where trees would have the largest modifying impact), but at deeper soil layers (25–40 cm depth). However, only (reciprocal transplanting) experiments (Ashton et al. Reference ASHTON, SINGHAKUMARA and GAMAGE2006, Baltzer et al. Reference BALTZER, THOMAS, NILUS and BURSLEM2005) can definitely show how trees respond to soil conditions. An experimental study in a Panamanian rain forest confirms that K may indeed play an important role; 8 y after NPK fertilization in the forest understorey, seedling growth is strongly increased by K addition, whereas N and P have only an effect when applied together (Santiago et al. Reference SANTIAGO, WRIGHT, HARMS, YAVITT, KORINE, GARCIA and TURNER2012).
In combination, our results suggest that despite its ectomycorrhizal status, P. chinensis prefers fertile soils, either because of higher water and nutrient requirements, because it tolerates higher levels of Mn, or because it will be outcompeted by other species under drier and/or infertile soil conditions. This contradicts the popular theory that monodominant species occur mostly on infertile soils where they can outcompete other species. In Ituri, monodominant forest had lower levels of soil nitrogen concentrations (Torti et al. Reference TORTI, COLEY and KURSAR2001) and deep-soil K (Hart et al. Reference HART, HART and MURPHY1989) compared with the neighbouring mixed forest. But overall, most studies do not find conclusive evidence that specific soil conditions lead to monodominance (Martijena Reference MARTIJENA1998, Nascimento & Proctor Reference NASCIMIENTO and PROCTOR1997, Peh et al. Reference PEH, LEWIS and LLOYD2011a, Torti et al. Reference TORTI, COLEY and KURSAR2001), with the exception of a study in Africa, which showed that three co-dominant Caesalpinoids were found on P-richer soils.
Are Parashorea chinensis patches remnants of old-growth forest?
Many hypotheses regarding monodominance focus on disturbance as an explanatory factor. Monodominance of shade-tolerant climax species can arise because of a prolonged absence of exogenous disturbance (Hart et al. Reference HART, HART and MURPHY1989), whereas monodominance of light-demanding pioneer species can arise because of recent large-scale disturbances (Wyatt-Smith Reference WYATT-SMITH1954). We hypothesized that disturbances can shape monodominant P. chinensis patches by affecting the surrounding forest, but not the patches themselves, i.e. P. chinensis patches could be the remnants of old-growth forest in a matrix of disturbed (shifting-cultivation) forest. The high number of large trees and the tendency of a higher basal area in the monodominant patches favour this hypothesis. One way to assess past human disturbance is by measuring charcoal in the soil (Van Gemerden et al. Reference VAN GEMERDEN, OLFF, PARREN and BONGERS2003). Charcoal was indeed more frequently found in mixed forest, but this difference with monodominant forest was not significant. Therefore, it remains uncertain whether the monodominant patches are the result of anthropogenic disturbance in the surrounding matrix. Finally, it should be said that, although this old-growth forest remnant hypothesis may explain the size and position of the patches, and why they contrast with the surrounding forest matrix, it does not explain why P. chinensis is monodominant.
In sum, P. chinensis patches are both floristically and structurally different from the surrounding mixed forest. In contrast to current paradigms, this monodominant species is not associated with infertile, but with fertile soils. Parashorea chinensis seems to be especially associated with manganese, and with edaphic conditions (water, K) that allow this tall and exposed emergent species to maintain its water balance, something that is of critical importance for an emergent species in a strongly seasonal forest at the northern edge of the tropical biome.
ACKNOWLEDGEMENTS
This research could not have been completed without the help and efforts of the people at the Plant geography lab at XTBG (Chinese Academy of Sciences), Kingsly Beng, Liu JiaJia, Yu Fei and Lu Yun, and logistic support of the Xishuangbanna Ecological Field Station. We thank two anonymous reviewers for their helpful comments on the manuscript.
Appendix 1. Method of calculating the relative importance value (RIV) of a species importance in a tropical seasonal rain forest of Xishuangbanna. The RIV is calculated as the sum of the relative dominance (Rdom), relative density (Rden) and the relative frequency (Rfreq).

Appendix 2. Summary of the top ten most important species based on relative importance value of two forest types in a seasonal rain forest of Xishuangbanna. Upper part: top ten of the most important species of trees ≥ 5 cm dbh of the two forest types. Lower part: top ten most important species of saplings ≥ 1 cm–5 cm in dbh. Rdom = relative dominance, Rden = relative density, Rfreq = relative frequency, RIV = relative importance value.


Appendix 3. Detrended Correspondence Analysis of the floristic composition of saplings (1–4.9 cm dbh) in monodominant patches (triangles) and mixed forest patches (crosses). Arrows show the axis loadings of geographic variables (elevation, slope), soil texture (sand, silt, clay) and edaphic conditions (pH, C, P, K, N, Al, Fe, Mg, Mn, Na and C:N ratio). The presence of charcoal is indicated with a box. Outer boundaries of the two forest types are indicated with the lines and show the overlap between the two forest types.


