


Introduction
Tropical forests are responsible for storing around 37% of the terrestrial carbon of the planet in the form of plant biomass (Aguiar et al. Reference Aguiar, Vieira, Assis, Dalla-Nora, Toledo, Santos-Junior, Batistella, Coelho, Savaget, Aragão, Nobre and Ometto2016, USDOE 2010). Forest biomass is stored in about 80% of the aboveground biomass (AGB) (Cairns et al. Reference Cairns, Brown, Helmer and Baumgardner1997) which is related to vegetation structure (Houghton et al. Reference Houghton, Hall and Goetz2009). In tropical forests, more than 50% of primary annual production is returned to the soil in the form of organic debris in litter (Wardle et al. Reference Wardle, Bardgett, Klironomos, Setalã, van der Putten and Wall2004). The Intergovernmental Panel on Climate Change (IPCC) identified litter as one of the five carbon reservoirs in forest ecosystem (Nizami 2012), with 5% of the AGB being stored in litter (Pan et al. Reference Pan, Birdsey, Fang, Houghton, Kauppi, Kurz, Phillips, Shvidenko, Lewis, Canadell, Ciais, Jackson, Pacala, Mcguire, Piao, Rautiainen, Sitch and Hayes2011).
The return of organic matter to the soil is one of the main processes of ecosystem functioning (Alves et al. Reference Alves, Vieira, Scaranello, Camargo, Santos, Joly and Martinelli2010); it represents the transfer route of organic matter and mineral elements from the vegetation to the soil (Camargo et al. Reference Camargo, Giarrizzo and Jesus2015, Silver et al. Reference Silver, Hall and González2014, Vitousek & Sanford Reference Vitousek and Sanford1986). This process is essential in tropical forests as those are environments with highly weathered soils (Poggiani Reference Poggiani and Martins2012) and with low fertility (Vitousek & Sanford Reference Vitousek and Sanford1986). Because of that, the vegetation depends on the cycling of nutrients contained in plant debris for the absorption of nutrients (Kuruvilla et al. Reference Kuruvilla, Jijeesh and Seethalakshm2016, Rawat et al. Reference Rawat, Nautiyal and Nautiyal2010). In addition, litter production becomes essential for the functioning of the ecosystem, transferring nutrients to the soil (Pandey et al. Reference Pandey, Sharma, Tripathi and Singh2007), maintaining soil fertility in forest ecosystems (Guendehou et al. Reference Guendehou, Liski, Tuomi, Moudachirou, Sinsin and Makipaa2014, Montagnini & Jordan Reference Montagnini, Jordan, Guariguata and Kattan2002, Tripathi et al. Reference Tripathi, Sumida, Shibata, Ono, Uemura, Kodama and Hara2006) and for the global carbon cycle (Berg & Mcclaugherty Reference Berg and Mcclaugherty2014).
Litter production occurs by the elimination of vegetative parts of plants, which can be caused by senescence, abiotic factors, stress and these factors combined, as well as by the death of a plant (Chakravarty et al. Reference Chakravarty, Rai, Vineeta, Pala and Shukla2019, Krishna & Mohan Reference Krishna and Mohan2017). The pattern of litter production depends on some factors such as climate (Sayer Reference Sayer2006) and vegetation structure and composition (Nickmans et al. Reference Nickmans, Jonarda, Verheyen and Ponette2019, Vidal et al., Reference Vidal, Pivello, Meirelles and Metzger2007). There is a significant number of studies designed to understand the effect of climate in litter production patterns. For example, the relationship of seasonality with increased litter production (An et al. Reference An, Han, Youn, Lee, Rahman, Dao, Seo, Aung, Choi, Hyun and Park2019), as in the warmer seasons of the year, on increasing light time, plants can prepare for more favourable growth, and thus replace the old leaves with new ones (Devi & Garkoti Reference Devi and Garkoti2013), higher production in the dry season (Barlow et al. Reference Barlow, Gardner, Ferreira and Peres2007) and decrease the production of litter with increase in elevation (Majila et al. Reference Majila, Joshi and Kala2005, Zhou et al. Reference Zhou, Guan, Wei, Zhang, Zhang, Yan, Wen, Liu, Liu, Huang, Kong, Mo and Yu2007).
In addition to climate, vegetation characteristics can modify litter production, such as vegetation structure and composition (Nickmans et al. Reference Nickmans, Jonarda, Verheyen and Ponette2019, Schumacher et al. Reference Schumacher, Truby, Marafiga, Viera and Szymczak2011) and the changes in development strategies of the plants with forest succession (Poorter & Bongers Reference Poorter and Bongers2006). As the forest develops, there is an increase in the size of large trees, increase in the basal area, and the well-developed forest structure reflects a well-developed canopy, which can favour the production of litter (Kunhamu et al. Reference Kunhamu, Kumar and Viswanath2009, Vidal et al. Reference Vidal, Pivello, Meirelles and Metzger2007). Changes in plant functional traits can affect litter production with the change of plants dominance from acquisitive to conservative traits during secondary succession (Craven et al. Reference Craven, Hall, Berlyn, Ashton and van Breugel2015, Facelli & Pickett Reference Facelli and Pickett1991; Werneck et al. Reference Werneck, Pedralli and Gieseke2001).
In theory, litter production pattern is related to the canopy development that occurs differently, depending on the individual characteristics of the species (Carrera et al. Reference Carrera, Bertilier and Larreguy2008). For example, in young secondary forests, the dominant species have resource acquisition characteristics, with high growth and mortality potential (Rozendaal & Chazdon Reference Rozendaal and Chazdon2015), fragile tissues (Reich Reference Reich2014), low-density wood and short-lived leaves (Adler et al. Reference Adler, Salguero-Gómez, Compagnoni, Hsu, Ray-Mukherjee, Mbeau-Ache and Franco2013), contributing more to litter production because they have leaves and branches with less lignified materials, in addition to being rich in N and low C/N ratio that can accelerate litter turnover (Zhou et al. Reference Zhou, Shan Xu, Manzoni, Fang, Yu, Tang, Zhou, Wang, Yan, Wang, Ma, Li, Du, Han, Ma, Zhang, Liu, Liu, Chu, Zhang, Li, Huang, Ren, Lu and Chen2019). With forest development, dominance gradually changes towards species with conservative resource characteristics, which present the production of denser tissues (as a higher density of wood), high C/N ratio, long-lived leaves and low renewal leaves rates (Adler et al. Reference Adler, Salguero-Gómez, Compagnoni, Hsu, Ray-Mukherjee, Mbeau-Ache and Franco2013, Craven et al. Reference Craven, Hall, Berlyn, Ashton and van Breugel2015, Reich Reference Reich2014). Thus, areas in the advanced stage of forest development, with higher species diversity and abundance of late-successional species, show the poorest litter in terms of N concentrations, and with a high C/N ratio, which leads to lower litter turnover rates (Parton et al. Reference Parton, Silver, Burke, Grassens, Harmom, Currie, King, Adair, Brandt, Hart and Fasth2007, Zhou et al. Reference Zhou, Shan Xu, Manzoni, Fang, Yu, Tang, Zhou, Wang, Yan, Wang, Ma, Li, Du, Han, Ma, Zhang, Liu, Liu, Chu, Zhang, Li, Huang, Ren, Lu and Chen2019). In this way, changes in species dominance will modify the quantity and quality of the litter and, consequently, the flows of biomass and nutrients with forest development.
Here, we used a chronosequence of secondary and mature forests of the Atlantic Forest biome in Brazil, to assess changes in litter production with forest development. In addition, we studied the relationship between litter production and standing AGB to detect changes in plant characteristics with forest development. We hypothesized that (a) there would be an increase in litter production because of the increase in standing AGB with forest development; (b) there would be a significant shift in the relationship between litter production and standing AGB with forest development because of changes in dominance from plants with acquisitive to conservative strategies and (c) and the increase of litter production is associated with successional changes in forest structure.
Study site
The study was carried out in the Serra do Conduru State Park - PESC, located in southern Bahia, Brazil, at 14º 30'16” S, and 39º 6'36” W (Figure 1). The Park has an area of approximately 10,000 ha, composed of a forest mosaic in different stages of regeneration, from secondary forests at different ages to well-preserved areas (Piotto et al. Reference Piotto, Montagnini, Thomas, Ashton and Oliver2009). The vegetation is classified as tropical rain forest, in the Atlantic Forest biome, with emergent, canopy, sub-canopy and herbaceous layers and extremely high species diversity (Thomas Reference Thomas, Prado, Landau, Moura, Pinto, Fonseca and Alger2003). The average monthly temperature is 24°C, with an average annual rainfall of 2,000 mm evenly distributed throughout the year (Santos et al. Reference Santos, Terra, Chaer and Monte2018). The selected secondary forest areas were established after deforestation and burnings, followed by 1–2 years of cassava cultivation (Piotto et al. Reference Piotto, Montagnini, Thomas, Ashton and Oliver2009).

Figure 1. Location map of the Serra do Conduru State Park, with the location of the study plots, Bahia, Brazil.
Table 1. Structural features of vegetation present at sites of different ages along the succession, at the ages of 10, 25 and 40 years and mature forests, in the Serra do Conduru State Park, Bahia, Brazil. Mean ± SD

Methods
Classification of chronosequence
Based on aerial photographs and satellite imagery from 1965 to 2009, it was possible to track changes in forest cover and land use in the study region. A total of 95 secondary forest stands larger than 3 ha and adjacent to a mature forest were found in the study region. Then, maps of forest age classes were derived. Ages of secondary forests ranged from 10 to 43 years. Fifteen pairs of secondary forests adjacent to mature forests were randomly selected to represent three age groups of secondary forests: 10 years (10–12 years), 25 years (22–25 years) and 40 years (37–43 years) (Figure 1). Interviews with local farmers were conducted to validate information on forest age and type and intensity of previous land use.
AGB data
In each pair of mature and secondary forests, five plots of 20 × 10 m (200 m2) were established in each age class (10, 25 and 40 years) and one plot of 20 × 30 m (600 m2) in mature forest. A total of 75 plots were installed in secondary forests and 15 plots in mature forests (total of 90 forest inventory plots). All trees with a diameter at breast height (dbh) equal to or greater than 5 cm were identified and measured for dbh and total height. We calculated basal area (m2/ha) and tree density (number of trees with dbh > 5 cm/ha) for each plot. In addition, we estimated AGB using the following allometric equation for tropical forests (Chave et al. Reference Chave, Réjou-Méchain, Búrquez, Chidumayo, Colgan, Delitti, Duque, Eid, Fearnside, Goodman, Martínez-Yrízar, Mugasha, Muller-Landau, Mencuccini, Nelson, Ngomanda, Nogueira, Ortiz-Malavassi, Pélissier, Ploton, Ryan, Saldarriaga and Vieilledent2014):
 $${\rm{AGB}} = 0.0673\,{\left( {\rho {{\rm{D^2}H}}} \right)^{0.976}}$$
based on diameter D (cm), height H (m), and wood-specific gravity ρ (g.cm−3). AGB is in kg. Plot biomass represents the estimated biomass of all trees within a plot, which was then extrapolated to estimate the AGB in Mg/ha. Specific wood density data were collected for each species in the world database (Zane et al Reference Zanne, Lopez-Gonzalez, Coomes, Ilic, Jansen, Lewis, Miller, Swenson, Wiemann and Chave2009), when species data were not available, we used genus data, and when this was not available, we used family data.
Litter and canopy data
Litter production was sampled in each forest inventory plot using 90 collectors established in mature and secondary forests. In each pair of mature and secondary forests, six collectors were installed with a distance of 20 m between each collector, located at the central point of the forest inventory plots. The collectors consisted of a cone of a fine mesh fabric (2 mm) attached to a circular wire of 1 m2, installed at 50 cm aboveground. The collections of material deposited in the collectors were carried out monthly from February 2008 to January 2009. The collected litter was dried in a lab oven at 50º for 48 hours. After drying, each monthly sample was weighted to obtain the monthly dry mass per collector. For the calculations, results from each collector for all months were added and then transformed into hectares, thus obtaining the values of litter in total weight in tons per hectare per year. At every collector, canopy opening was estimated using hemispherical photographs.
Besides AGB and structural variables, we also used as a response variable the ratio between litter biomass and AGB (here considered as a proportion of litter related to AGB), where we consider the percentage of biomass that is stored in litter in relation to AGB. For the calculation of the ratio, litter production values were divided by the AGB values, both in Mg/ha, and were multiplied by 100, to be represented in %.
Statistical analysis
To assess the relation between litter production with age and the relation of AGB and litter biomass with age, we adjusted a linear mixed model (LMM), including the site as a random factor. We used LMM approach to control temporal pseudoreplication (Zuur et al. Reference Zuur, Ieno, Walker, Saveliev and Smith2009). Thus, for each response variable (litter production and relation of aboveground and litter biomass), we use one model with age as an explanatory variable. For the validation of the model, we tested the normality of the residues, using the Shapiro–wilk test and plot of the residues.
Then, we investigated how the density of the stem (number/ha), canopy openness (%) and basal area (m2/ha), can influence litter production and how these variables influence the aboveground and litter biomass ratio. As the forest structure data was considered non-normal, we used generalized linear models (GLM). For each response variable (annual litter production and aboveground and litter biomass ratio), we fit four models for each explanatory variable (stems density (number/ha), canopy openness (%) and basal area (m2/ha)): 1) a model with annual litter production as the response variable in relation to an explanatory variable (stems density or canopy openness or basal area), 2) a model with annual litter production in relation to the log of the explanatory variable (stems density or canopy openness or basal area), 3) model with a log of annual litter production and log of the explanatory variable (stems density or canopy openness or basal area) and finally 4) a model with log annual litter production in relation to an explanatory variable (stems density or canopy openness or basal area). The same was done with the other response variable (aboveground and litter biomass ratio). We considered the best model when its AICc was at least two units lower than the subsequent best model. The relationships were considered significant with P < 0.05. The models were validated using the relationship between standardized residuals and standardized normal quantiles and, the residuals were tested for deviation from the normal distribution using the Shapiro–Wilk test. All analyzes were performed using the free software R 4.0 (R Development Core Team 2020), using the packages “lme4" and “lmerTest” (Bates et al. Reference Bates, Maechler, Bolker and Walker2015, Kuznetsova et al. Reference Kuznetsova, Brockhoff and Christensen2017).
Results
In total, the annual average production of litter was 7.89 Mg/ha1/y−1. The annual average production of 10-year-old secondary forests differed significantly from the other age classes (6.58 ± 2.28 Mg/ha1/y−1; P < 0.05, Figure 2), showing the lowest values of annual litter production. Whereas 25-year-old secondary forests (7.96 ± 1.93 Mg/ha1/y−1), 40-year-old (8.86 ± 2.38 Mg/ha1/y−1, Figure 2) and mature forest (8.31 ± 1.02 Mg/ha1/y−1) presented similar annual litter production. The results showed that annual litter production had a strong positive relation with forest age, with a rapid increase in annual litter production early in succession.
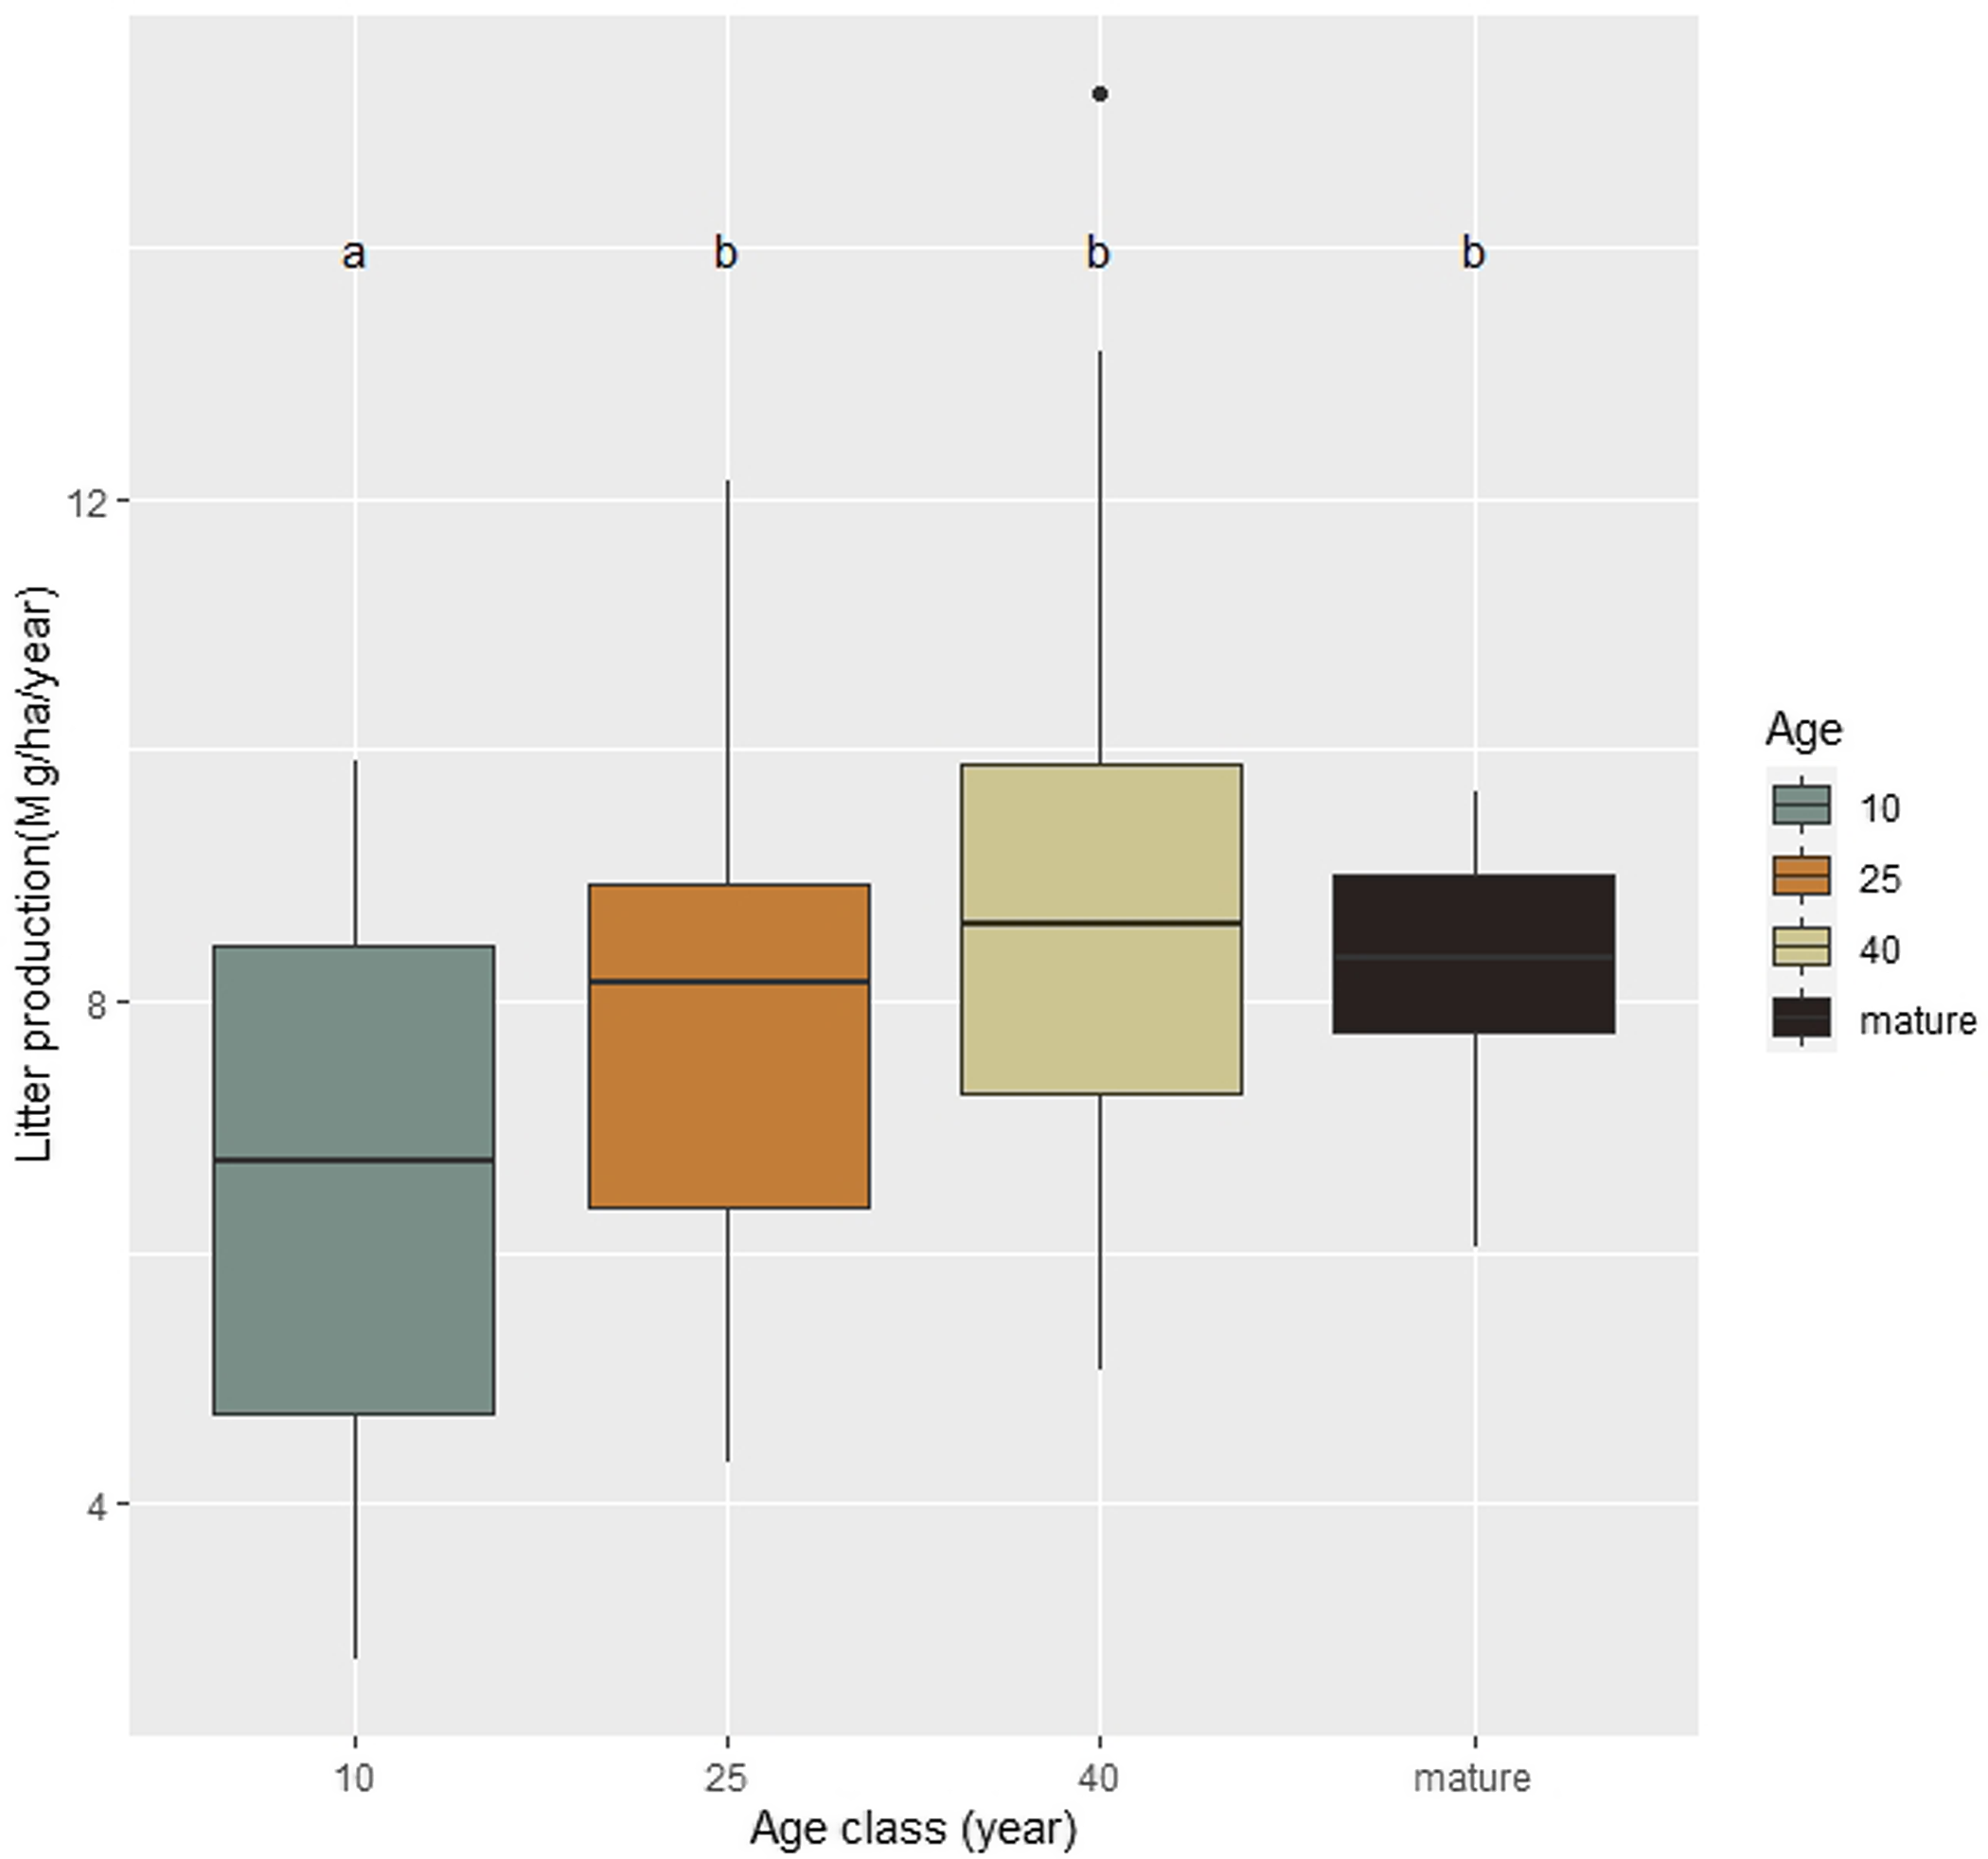
Figure 2. Annual litter biomass production in Mg/ha1/y−1along succession, at the ages of 10, 25 and 40 years and mature forests, in the Serra do Conduru State Park, Bahia, Brazil.
Annual litter production represented 20.36% (from 6,63 to 47,8%) of the total standing AGB in 10-year-old plots. These values decreased significantly with forest development (P < 0.05), with average of 13.16% (3.92 to 37.28%) in 25-year-old plots, 7.14% (2.77 to 34.17%) in 40-year-old plots and 2,33% in mature forests (1.02 to 4.22%) (Figure 3). The results showed a negative and significant effect of age in relation to annual litter production and total standing biomass (P < 0.05) (Figure 3).
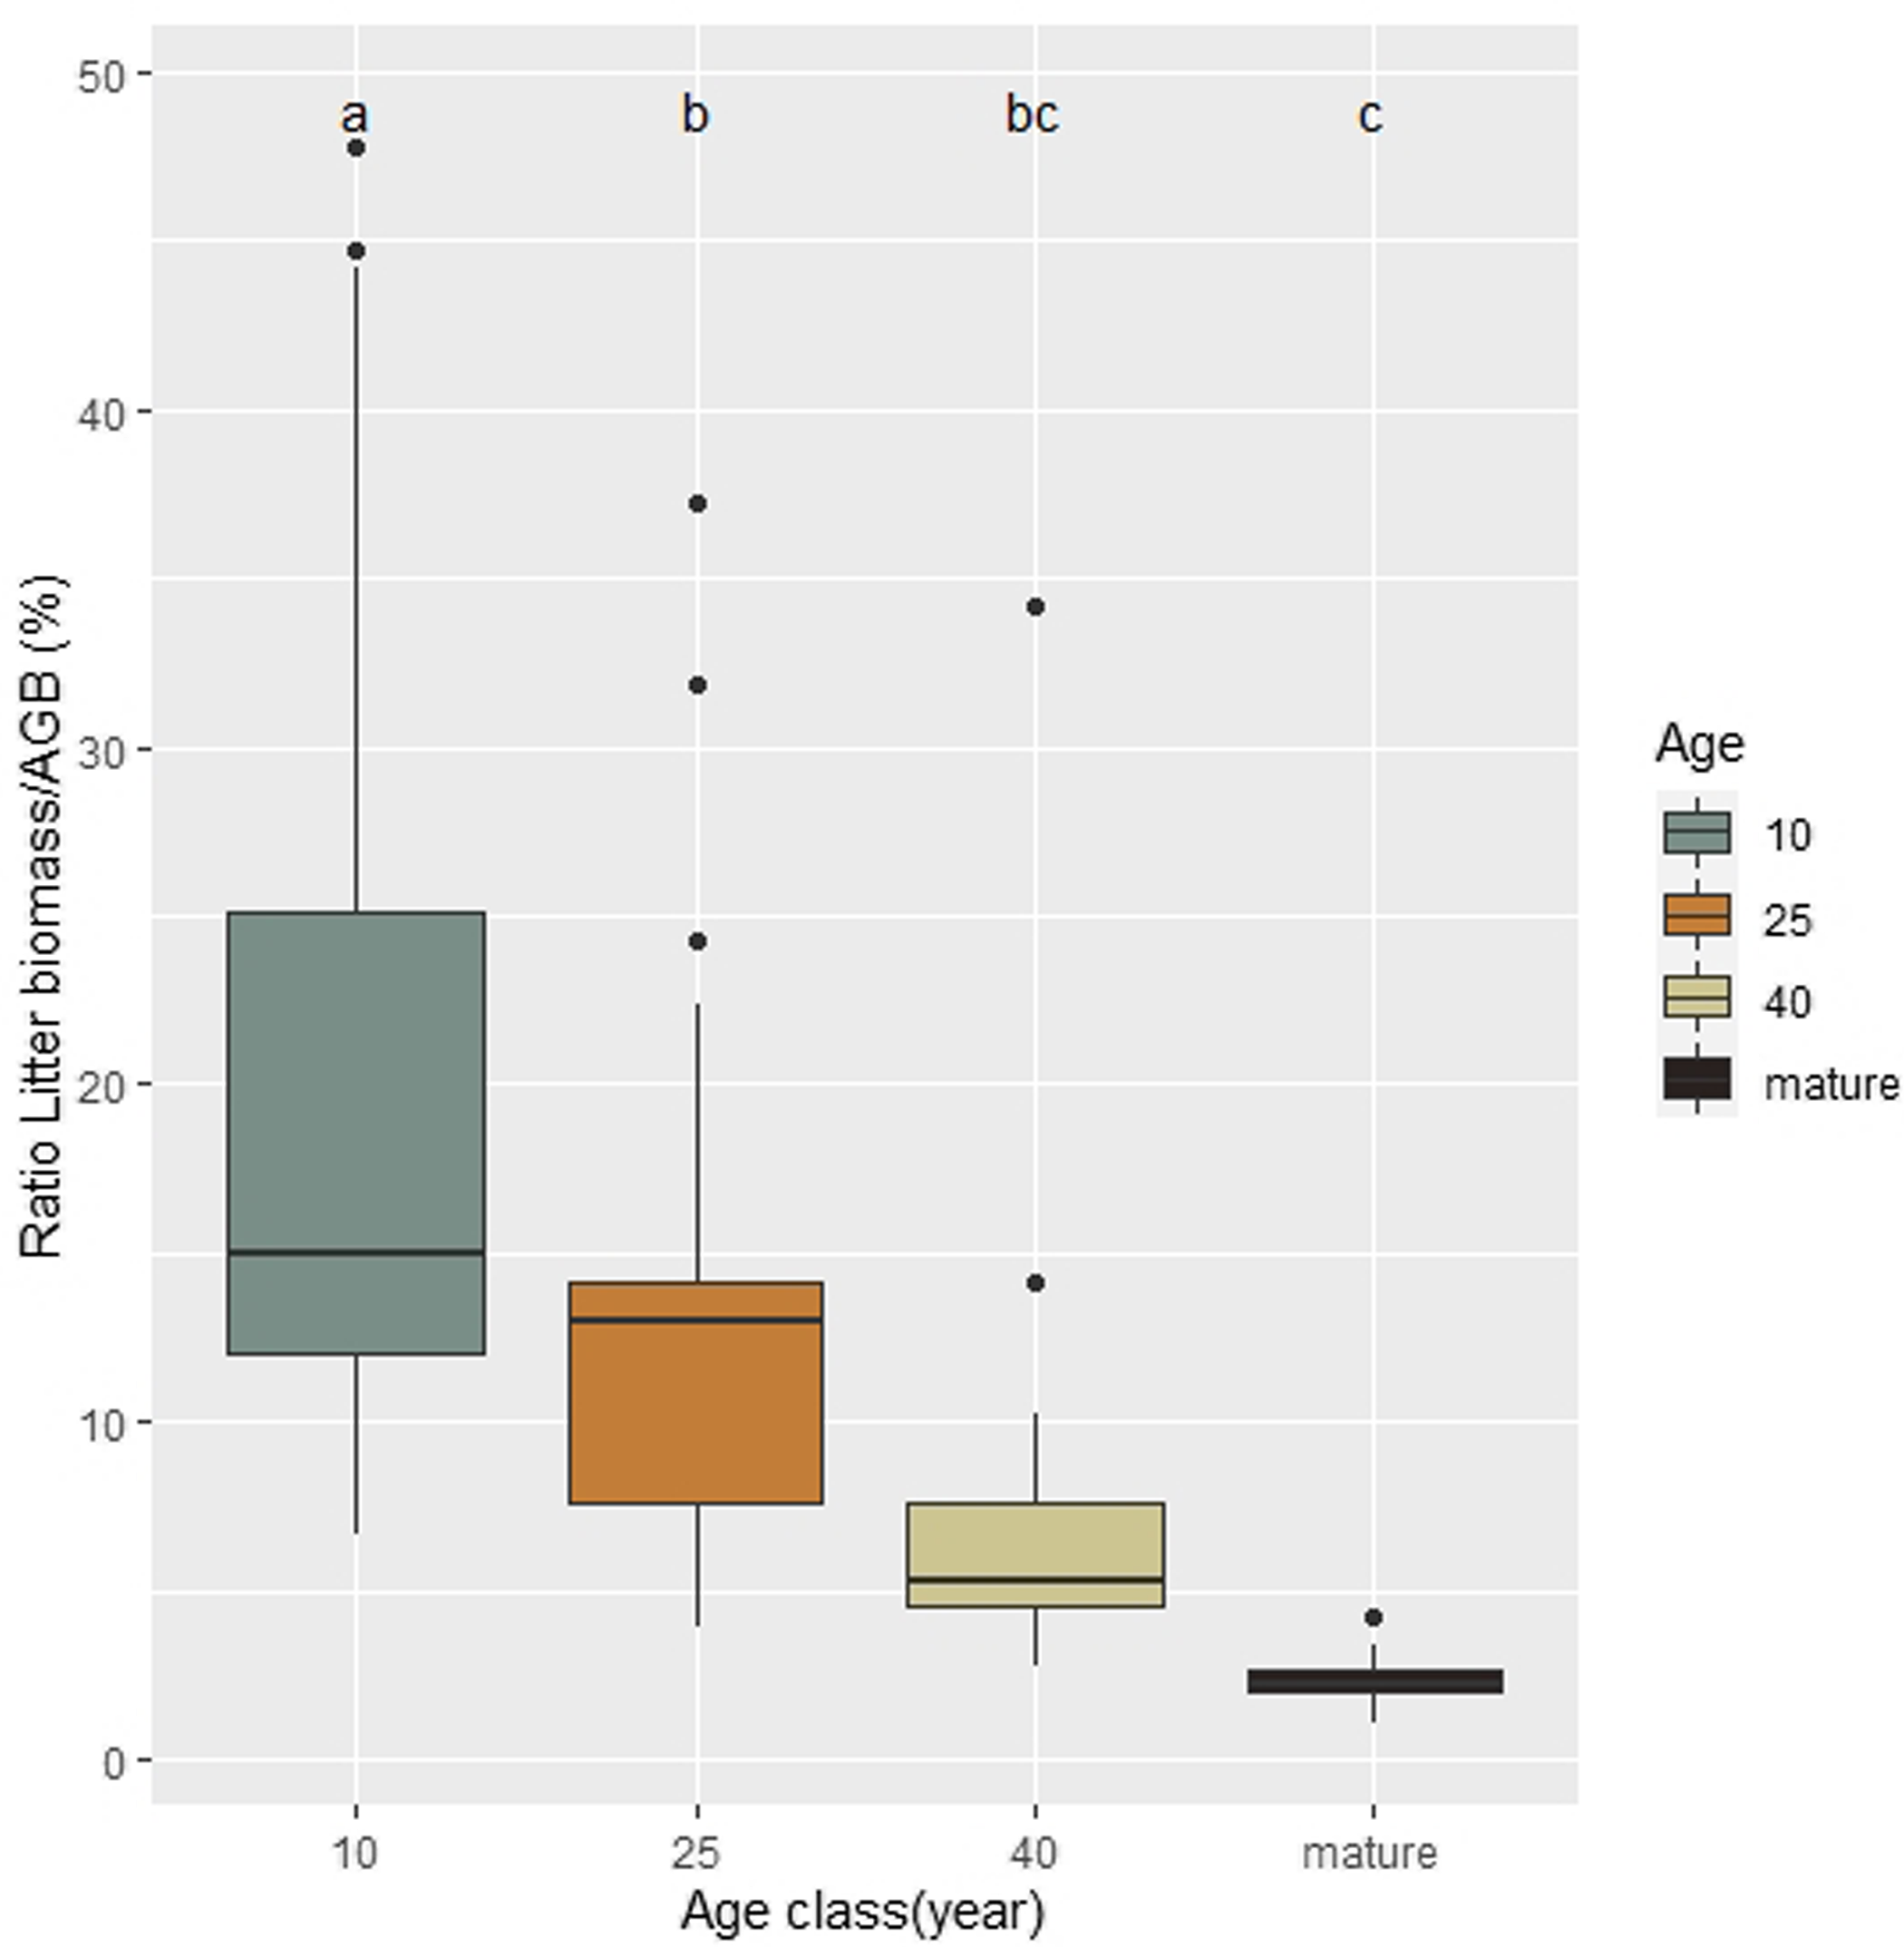
Figure 3. Relation between annual litter production and the total aboveground biomass at the ages of 10, 25 and 40 years and mature forest, in the Serra do Conduru State Park, Bahia, Brazil.
In general, our GLMs showed a significant influence of vegetation structure on annual litter production (Figure 4). The basal area and stem density significantly and positively influenced annual litter production (P < 0.01), whereas canopy opening had a negative influence on annual litter production (P < 0.01; Figure 4).

Figure 4. Relations between annual litter production and structural variables: (a) stems (number/ha), (b) basal area (m2/ha) and (c) percentage of canopy opening.
The ratio of annual litter production in relation to total standing AGB showed a significant association with all forest structure variables. Basal area and stem density significantly and negatively influenced the ratio of annual litter production and total standing AGB (P < 0.001), while canopy opening had a positive influence (P < 0.001; Figure 5).

Figure 5. Relations between the ratio of annual litter production and total standing aboveground biomass and structural variables: (a) stems (number/ha), (b) basal area (m2/ha) and (c) percentage of canopy open.
Discussion
Our results reflect the gradual recovery in aboveground primary productivity during tropical forest succession, which tends to stabilise at around 20 years (Ewel, Reference Ewel1976; Brown & Lugo, Reference Brown and Lugo1990). The recovery and stability in litter production between secondary and mature forests were also reported in other studies carried out in tropical forests (Barlow et al. Reference Barlow, Gardner, Ferreira and Peres2007; Ostertag et al Reference Ostertag, Marın-Spiotta, Silver and Schulten2008). This stability of litter production early in succession (20 and 40 years old) can be effective in restoring ecosystem processes such as litter production and decomposition, which can represent one of the major pathways of nutrient cycling (Camargo et al. Reference Camargo, Giarrizzo and Jesus2015), essential for maintaining soil fertility in forest ecosystems (Li & Ye Reference Li and Ye2014, Montagnini & Jordan Reference Montagnini, Jordan, Guariguata and Kattan2002, Tripathi et al. Reference Tripathi, Sumida, Shibata, Ono, Uemura, Kodama and Hara2006).
In young secondary forests, there is a dominance of pioneer species (Rozendaal & Chazdon Reference Rozendaal and Chazdon2015; van Breugel et al. Reference van Breugel, Martınez-Ramos and Bongers2006). These early successional species generally have the characteristics of being resource acquisitive, presenting less lignified materials with rich N constitution and low C/N ratio (Reich Reference Reich2014; Hantsch et al., 2014). N concentration can have a positive effect on litter mass loss (Cornwell et al. Reference Cornwell, Cornelissen, Amatangelo, Dorrepaal, Eviner, Godoy, Hobbie, Hoorens, Kurokawa, Pérez-Harguindeguy, Quested, Santiago, Wardle, Wright, Aerts, Allison, Van Bodegom, Brovkin, Chatain, Callaghan, Díaz, Garnier, Gurvich, Kazakou, Klein, Read, Reich, Soudzilovskaia, Vaieretti and Westoby2008; Patoine et al, Reference Patoine, Thakur, Friese, Nock, Hönig, Haase, Scherer-Lorenzen and Eisenhauer2017), because the consumption of N-rich plant material is necessary for detritivores (Eisenhauer et al, Reference Eisenhauer, Milcu, Sabais, Bessler, Weigelt, Engels and Scheu2009; Schwarz et al, Reference Schwarz, Dietrich, Cesarz, Scherer-Lorenzen, Auge, Schulz and Eisenhauer2015). The content of nitrogen and carbon are also commonly used as predictors of decomposition rate (Cornwell et al. Reference Cornwell, Cornelissen, Amatangelo, Dorrepaal, Eviner, Godoy, Hobbie, Hoorens, Kurokawa, Pérez-Harguindeguy, Quested, Santiago, Wardle, Wright, Aerts, Allison, Van Bodegom, Brovkin, Chatain, Callaghan, Díaz, Garnier, Gurvich, Kazakou, Klein, Read, Reich, Soudzilovskaia, Vaieretti and Westoby2008; Eichenberg et al. Reference Eichenberg, Trogisch, Huang, He and Bruelheide2014). Pioneer species also have low content of secondary compounds (phenolics and tannins), which can accelerate the decomposition process (Parton et al, Reference Parton, Silver, Burke, Grassens, Harmom, Currie, King, Adair, Brandt, Hart and Fasth2007). What happens in the opposite way to late successional species, with high leaf carbon content, high leaf toughness (Garnier et al. Reference Garnier, Cortez, Billes, Navas, Roumet, Debussche, Laurent, Blanchard, Aubry, Bellmann, Neill and Toussaint2004, Cortez et al. Reference Cortez, Garnier, Pérez-Harguindeguy, Debussche and Gillon2007). Thus, litter quality is expected to change over the course of succession, with high decomposition rates in early successional forests (Garnier et al. Reference Garnier, Cortez, Billes, Navas, Roumet, Debussche, Laurent, Blanchard, Aubry, Bellmann, Neill and Toussaint2004).
In our study, we found litter production as an important biomass reservoir. In recently modified forests, annual litter production represents more than 47% of the total standing biomass, demonstrating its importance as a biomass reservoir early in succession. Our data showed that in these forests (10 years old), the vegetation has a more simplified structure, such as areas with lower average DBH, lower basal area and lower density of individuals. In addition, litter has greater representation when compared to total standing AGB, as well as areas with the largest canopy opening (Figure 5). These areas have a dominance of pioneer species, which have high growth rates, but short longevity (Reich et al. Reference Reich, Tjoelker, Pregitzer, Wright, Oleksyn and Machado2008, Rees 2001), making their litter biomass more representative at this stage of succession. Thus, when compared to forests in more advanced stages, younger areas depend much more on litter biomass to maintain various ecosystem services, such as those related to soils, a favorable soil environment, such as maintaining the microclimate, regulating temperature and humidity of soil (Amatangelo et al.Reference Amatangelo, Dukes and Field2008, Bond-Lamberty & Thomson Reference Bond-Lamberty and Thomson2010, Sayer Reference Sayer2006) and ecosystem services related to climate regulation, as an important carbon reservoir (Sayer et al. Reference Sayer, Powers and Tanner2007), since the vegetation structure is less developed.
In the final stages of the succession, we found a greater basal area and greater density of individuals, as well as greater canopy closure. Forests in the final stages of succession are more complex ecosystems, with a better-developed canopy structure (Werneck et al. Reference Werneck, Pedralli and Gieseke2001), in addition to having a greater surface area of branches and foliage (Lowman & Schowalter Reference Lowman and Schowalter2012). This more complex vegetation structure is generally associated with the majority of species that have a longer life span (Rees et al. Reference Rees, Condit, Crawley, Pacala and Tilman2001), high density of wood, slow growth and thus greater survival (Chave et al. Reference Chave, David, Steven, Simon, Nathan and Amy2009, Rees et al. Reference Rees, Condit, Crawley, Pacala and Tilman2001). In this way, even having a more developed structure, these mature forests produce similar amounts of litter when compared to secondary forests (20 and 40 years old), as their dominant species tend to retain plant parts longer than dominant species present in secondary forests (Rees et al. Reference Rees, Condit, Crawley, Pacala and Tilman2001). Therefore, the litter contributes less to the storage of biomass, which represents less than 4% of the total biomass, while most of the AGB is stored in tree trunks, in resource-conservative species (Reich Reference Reich2014, Adler et al. Reference Adler, Salguero-Gómez, Compagnoni, Hsu, Ray-Mukherjee, Mbeau-Ache and Franco2013). This relation explains that vascular plants change from rapid acquisition of resources to the conservation of resources with successional age (Jackson et al. Reference Jackson, Peltzer and Wardle2013, Poorter & Bongers Reference Poorter and Bongers2006).
Conclusion
Implications for forest management and climate mitigation
High rates of litter production in secondary forests can represent major contributions to organic matter and nutrients for biogeochemical cycles, in addition to representing an improvement of chemical, physical and biological properties of the soil (León & Osorio Reference León and Osorio2014, Sánchez-Silva et al.Reference Sánchez-Silva, De Jong, Aryal, Huerta-Lwanga and Mendoza-Vega2018). Our results highlight the fundamental role of another ecosystem service provided by litter production, as a carbon reservoir in tropical forests, especially in young secondary forests, just as it has been reported for woody debris by Yang et al (Reference Yang, Ciais, Chave, Huang, Ballantyne, Yu, Berzaghi and Wigneron2021), who demonstrated that these woody debris store carbon and delay the release of CO2 to the atmosphere after tree mortality in Amazon and African forests. In general, our results showed that litter production increases with the development of the forest structure, stabilizing at age 40 and that annual litter production represents an important biomass reservoir in the early stages of succession, reaching 47% of the AGB.
Our results demonstrated the importance of conserving secondary forests, mainly by the storage of carbon in litter maintaining some ecosystem services. These services can contribute to the regeneration of modified environments, such as the maintenance of soil microclimate and nutrient cycling that are essential for areas in the initial stage of succession (Guendehou et al. Reference Guendehou, Liski, Tuomi, Moudachirou, Sinsin and Makipaa2014). This highlights the importance of understanding how litter affects the carbon balance of tropical ecosystems. The flows of these carbon storage components should be considered in future work, further improving our forecasts of regional carbon dynamics in future climate scenarios. The results should also be used in conservation strategies with the quantification of litter as a place for carbon storage, contributing as an ecosystem service and mitigating climate change and REDD +.
Acknowledgements
JISR received a doctoral scholarship from the Coordenação de Aperfeiçoamento de Pessoal de Nível Superior - Brasil (CAPES) - Finance Code 001. And I thank the discipline Data Analysis and Writing of Scientific Manuscripts and Dr. Larissa Rocha for the collaboration in the manuscript.
Financial support
This work was supported by the Fundo Brasileiro para a Biodiversidade (Funbio) and Humanize Institute (grant number: 111/2019)
Competing interests
The authors declare none.
Ethical statement
None.


