


Introduction
Reproductive phenology, i.e. the timing of flowering and fruiting events, is a crucial element of the reproductive success of plants. Strong evidence of shifts in reproductive phenology in response to global warming has been reported worldwide and for a variety of organisms (Walther et al. Reference Walther, Post, Convey, Menzel, Parmesan, Beebee, Fromentin, Hoegh-Guldberg and Bairlein2002) including plant species in mid- and high northern latitudes (CaraDonna et al. Reference CaraDonna, Iler and Inouye2014, Cleland et al. Reference Cleland, Chuine, Menzel, Mooney and Schwartz2007, Rosenzweig et al. Reference Rosenzweig, Casassa, Karoly, Imeson, Liu, Menzel, Rawlins, Root, Seguin, Tryjanowski, Parry, Canziani, Palutikof, van der Linden and Hanson2007, Zhang et al. Reference Zhang, Yuan, Liu, Dong and Fu2015). In this regard it is important to identify the climatic factors that control and impact reproductive phenology.
In tropical forests, a great diversity of reproductive phenological patterns has been reported (Newstrom et al. Reference Newstrom, Frankie and Baker1994) ranging from continuous reproduction to more regular patterns (either annual or sub-annual) and irregular phenologies, with supra-annual patterns, and even massive, infrequent, yet synchronized masting events (Norden et al. Reference Norden, Chave, Belbenoit, Caubère, Châtelet, Forget and Thébaud2007). In tropical Africa, annual phenologies have been found to be dominant for tree species in La Lopé, Gabon (Bush et al. Reference Bush, Abernethy, Jeffery, Tutin, White, Dimoto, Dikangadissi, Jump and Bunnefeld2017), in Luki, Democratic Republic of the Congo (Angoboy Ilondea et al. Reference Angoboy Ilondea, Beeckman, Ouédraogo, Bourland, De Mil, Van den Bulcke, Van Acker, Couralet, Ewango, Hubau, Toirambe, Doucet and Fayolle2019), and across several sites from West, Central and East Africa (Adamescu et al. Reference Adamescu, Plumptre, Abernethy, Polansky, Bush, Chapman, Shoo, Fayolle, Janmaat, Robbins, Ndangalasi, Cordeiro, Gilby, Wittig, Breuer, Breuer-Ndoundou Hockemba, Sanz, Morgan, Pusey, Mugerwa, Gilagiza, Tutin, Ewango, Sheil, Dimoto, Baya, Bujo, Ssali, Dikangadissi, Jeffery, Valenta, White, Masozera, Wilson, Bitariho, Ndolo Ebika, Gourlet-Fleury and Beale2018). For species with relatively regular reproductive phenologies, a variety of climatic controlling factors have been identified. For instance, the seasonality of flowering was found to be correlated with seasonal changes in rainfall (Borchert et al. Reference Borchert, Meyer, Felger and Porter-Bolland2004), irradiance (Wright & Calderón Reference Wright and Calderón2018, Wright & van Schaik Reference Wright and van Schaik1994), day length and temperature (Morellato et al. Reference Morellato, Talora, Takahasi, Bencke, Romera and Zipparro2000), or temperature and relative humidity (Daïnou et al. Reference Daïnou, Laurenty, Mahy, Hardy, Brostaux, Tagg and Doucet2012b). All of these studies were conducted in the Neotropics except for the study of Daïnou et al. (Reference Daïnou, Laurenty, Mahy, Hardy, Brostaux, Tagg and Doucet2012b) on Milicia excelsa in south-eastern Cameroon. As such, climatic factors controlling the flowering phenology of tropical African forest trees are still largely unidentified and are probably species-specific (as demonstrated in Panama; Wright & Calderón Reference Wright and Calderón2018), or associated with specific traits, such as seed size (Sun et al. Reference Sun, Kaplin, Kristensen, Munyaligoga, Mvukiyumwami, Kajondo and Moermond1996).
Rainfall seasonality is assumed to primarily control the reproductive phenology of tropical African forest tree species. Large-scale studies on the vegetative phenology of tropical African forests have revealed that the seasonality of canopy photosynthetic activity is correlated with the seasonality of rainfall (Gond et al. Reference Gond, Fayolle, Pennec, Cornu, Mayaux, Camberlin, Doumenge, Fauvet and Gourlet-Fleury2013, Guan et al. Reference Guan, Wolf, Medvigy, Caylor, Pan and Wood2013). If rainfall seasonality primarily controls the reproductive phenology of tropical African forest tree species, we should expect a reverse phenology for populations located north versus south of the latitudinal area (~2°N) where rainfall seasonality reverses, i.e. the climatic hinge. The climatic hinge is also supposed to be an important discontinuity for both intra-specific genetic variation (Blatrix et al. Reference Blatrix, Peccoud, Born, Piatscheck, Benoit, Sauve, Djiéto-Lordon, Atteke, Wieringa and Harris2017, Hardy et al. Reference Hardy, Born, Budde, Daïnou, Dauby, Duminil, Ewédjé, Gomez, Heuertz and Koffi2013) and plant communities (Gonmadje et al. Reference Gonmadje, Doumenge, Sunderland, Balinga and Sonké2012), even though the pattern is not always found (Fayolle et al. Reference Fayolle, Swaine, Bastin, Bourland, Comiskey, Dauby, Doucet, Gillet, Gourlet-Fleury, Hardy, Kirunda, Kouamé and Plumptre2014). Wieringa (Reference Wieringa1999) showed the climatic hinge coincides with a strong disruption in the flowering pattern of Tetraberlinia bifoliolata.
Herbarium material provides an important source to investigate large-scale patterns in plant reproductive phenology and its putative correlation with seasonal climate variability (Davis et al. Reference Davis, Willis, Connolly, Kelly and Ellison2015, Willis et al. Reference Willis, Ellwood, Primack, Davis, Pearson, Gallinat, Yost, Nelson, Mazer, Rossington, Sparks and Soltis2017). Herbarium specimens are mainly made from fertile material in order to improve its identification. Additionally, they are nearly always well labelled with information on collection date and locality. As a result, herbarium specimens contain valuable information on reproductive phenology. In the Neotropics, Borchert (Reference Borchert1996) used herbarium collections to demonstrate that the flowering periodicity of 18 dry-forest tree species was correlated with the timing of the dry season. In addition, based on herbarium specimens, Zalamea et al. (Reference Zalamea, Munoz, Stevenson, Paine, Sarmiento, Sabatier and Heuret2011) noticed that flowering phenology of Cecropia species across the Neotropics was strongly associated with seasonal variation in rainfall and temperature.
In this study we aimed to assess temporal patterns in flowering phenology and their spatial variation for eight tropical African tree species. The study species are of major importance as they belong to the most logged species in central Africa (Bayol et al. Reference Bayol, Demarquez, De Wasseige, Atyi, Fisher, Nasi, Pasquier, Rossi, Steil, Vivien, de Wasseige, de Marcken, Bayol, Hiol Hiol, Mayaux Ph, Nasi, Billand, Defourny and Eba’a2012), and they significantly contribute to forest regional above-ground biomass stocks (Bastin et al. Reference Bastin, Barbier, Réjou-Méchain, Fayolle, Gourlet-Fleury, Maniatis, De Haulleville, Baya, Beeckman, Beina, Couteron, Chuyong, Dauby, Doucet, Droissart, Dufrêne, Ewango, Gillet, Gonmadje, Hart, Kavali, Kenfack, Libalah, Malhi, Makana, Pélissier, Ploton, Serckx, Sonké, Stevart, Thomas, De Cannière and Bogaert2015). For each species we specifically answered the following questions:
(1) Is flowering seasonal and correlated to the seasonality of rainfall?
(2) What is the relative importance of latitude, longitude and spatial variation in seasonality of rainfall in explaining the spatial variation in timing of flowering?
Study species
For the current study, eight tree species were selected: Entandrophragma cylindricum (Sprague) Sprague (Meliaceae), Erythrophleum suaveolens (Guill. & Perr.) Brenan (Leguminosae), Lophira alata Banks ex C.F.Gaertn. (Ochnaceae), Mansonia altissima (A.Chev.) A.Chev. (Malvaceae), Milicia excelsa (Welw.) C.C.Berg (Moraceae), Pterocarpus soyauxii Taub. (Leguminosae), Terminalia superba Engl. & Diels (Combretaceae) and Triplochiton scleroxylon K.Schum. (Malvaceae). These species are hermaphrodite (Réjou-Méchain & Cheptou Reference Réjou-Méchain and Cheptou2015), large-statured canopy species, light-demanding, (briefly) deciduous, and wind-dispersed (Meunier et al. Reference Meunier, Moumbogou and Doucet2015), except for M. excelsa (animal dispersal, dioecious; Daïnou et al. Reference Daïnou, Doucet, Sinsin and Mahy2012a) and E. suaveolens (unassisted and animal dispersal; Gorel et al. Reference Gorel, Fayolle and Doucet2015). Except for M. excelsa which is wind-pollinated (Daïnou et al. Reference Daïnou, Laurenty, Mahy, Hardy, Brostaux, Tagg and Doucet2012b), all other trees are insect-pollinated (E. cylindricum, Palla et al. Reference Palla, Louppe and Forni2002b; L. alata, Palla et al. Reference Palla, Louppe and Doumenge2002a) or probably insect-pollinated species (Akinnagbe et al. Reference Akinnagbe, Gailing and Finkeldey2010, Demenou et al. Reference Demenou, Doucet and Hardy2018, Gorel et al. Reference Gorel, Fayolle and Doucet2015, Palla & Louppe Reference Palla and Louppe2002). The extent of the spatial distribution of the species greatly varies among them. Hereafter we refer to the phytochoria defined by White (Reference White1983) to present species spatial distribution estimated from the RAINBIO database of tropical African vascular plants distributions (Dauby et al. Reference Dauby, Zaiss, Blach-Overgaard, Catarino, Damen, Deblauwe, Dessein, Dransfield, Droissart, Duarte, Engledow, Fadeur, Figueira, Gereau, Hardy, Harris, De Heij, Janssens, Klomberg, Ley, Mackinder, Meerts, Van de Poel, Sonké, Sosef, Stévart, Stoffelen, Svenning, Sepulchre, Van Der Burgt, Wieringa and Couvreur2016). Three species show a restricted distribution within the Guineo-Congolian regional centre of endemism, with T. scleroxylon and M. altissima occurring only in the northern hemisphere and P. soyauxii solely in central Africa. Three species widely spread over the Guineo-Congolian regional centre of endemism: T. superba, L. alata and E. cylindricum, the latter extending into the Lake Victoria regional mosaic. Finally, M. excelsa and E. suaveolens are the most widely distributed species, extending beyond the Guineo Congolian regional centre of endemism into the Sudanian and Zambezian regional centres of endemism as well as the Lake Victoria and the Zanzibar-Inhambane regional mosaics.
Methods
Field flowering data
We compiled phenology data from direct observations of trees collected in seven sites (Figure 1, Table 1; Ouédraogo et al. Reference Ouédraogo, Doucet, Daïnou, Baya, Biwolé, Bourland, Fétéké, Gillet, Kouadio and Fayolle2018) across central Africa in lowland moist and wet forests (Fayolle et al. Reference Fayolle, Swaine, Bastin, Bourland, Comiskey, Dauby, Doucet, Gillet, Gourlet-Fleury, Hardy, Kirunda, Kouamé and Plumptre2014). In all sites individual trees were tagged to be regularly monitored for phenology. In Cameroon, monitoring was conducted between 2004 and 2014 on a monthly basis in the logging concessions managed by the logging companies Pallisco (Mindourou site; Bourland et al. Reference Bourland, Kouadio, Lejeune, Sonké, Phillipart, Daïnou, Fétéké and Doucet2012, Daïnou et al. Reference Daïnou, Laurenty, Mahy, Hardy, Brostaux, Tagg and Doucet2012b, Fétéké et al. Reference Fétéké, Fayolle, Daïnou, Bourland, Dié, Lejeune, Doucet and Beeckman2016, Kouadio Reference Kouadio2009), and Wijma (Mamfe, and Ma’an sites; Biwolé Reference Biwolé2015). In the north of the Republic of the Congo monitoring was conducted monthly between 2005 and 2011 in two logging concessions (Pokola and Kabo sites) managed by the company CIB-Olam. Experienced forest technicians monitored trees for flowering using binoculars. They confirmed phenological activity by observing fallen flowers. In the Democratic Republic of the Congo (DRC) technicians monitored trees for flowering every 10 days between 1947 and 1958 in the Luki Forest Reserve (Luki site; Angoboy Ilondea et al. Reference Angoboy Ilondea, Beeckman, Ouédraogo, Bourland, De Mil, Van den Bulcke, Van Acker, Couralet, Ewango, Hubau, Toirambe, Doucet and Fayolle2019, Couralet et al. Reference Couralet, Van Den Bulcke, Ngoma, Van Acker and Beeckman2013) located in the Mayombe forest, in the south-westernmost margin of the Congo basin. In the Central African Republic, monitoring was conducted on a weekly basis between 1998 and 2003, and twice a month between 2005 and 2013, in the M’Baïki experimental site (M’Baïki site) for different subsets of trees and species over the two study periods. Technicians monitored trees for flowering and recorded the presence of flowering but only when the phenophase was dominant (when fruiting was the dominant stage of the tree, flowering was no longer recorded).

Figure 1. (a) Location of the study sites (black crosses) on a map with grid cells coloured according to the first axis scores of the principal component analysis of mean monthly rainfall (from negative scores in blue to positive scores in red). The inset shows the correlation circle of monthly rainfall (January = 1; February = 2, March = 3, April = 4, May = 5, June = 6, July = 7, August = 8, September = 9, October = 10, November = 11 and December = 12; 7 is hidden behind 8), the distribution of grid cells on the factorial plan (Axis 1 and Axis 2), as well as the position of field sites (Luki (Luk), Maan (Maa), Pokola (Pok), Kabo (Kab), Mindourou (Min), M’Baïki (Mbk) and Mamfe (Mam)). Coloured grid cells are those where specimens were collected. (b, c, d, e, f, g) Field sites mean rainfall patterns with mean annual rainfall in parentheses.
Table 1. Characterization of the flowering pattern of the eight species in field sites in Cameroon (Mindourou, Mamfe, Ma’an), Central African Republic (M’Baïki), Republic of the Congo (Pokola, Kabo) and Democratic Republic of the Congo (Luki), with sampling information (period of monitoring and number N of census). The flowering cycles at population level were graphically determined following Newstrom et al. (Reference Newstrom, Frankie and Baker1994) (Figure 2). The timing of flowering was characterized using circular statistics, with Ntree the number of reproductive trees, N the number of individual flowering observations, rho the length of the mean vector indicating the concentration of flowering activity around a specific date, P the significance of rho, and Date the mean time of occurrence of flowering

The sites correspond to semi-deciduous forests, except the Mamfe site, which corresponds to an evergreen forest and the Ma’an site, which corresponds to a transition forest between semi-deciduous and evergreen forests (Letouzey Reference Letouzey1985). All sites were standardized for data analysis of monthly flowering phenology by scoring the presence/absence of flowering. We assumed that the comparison of phenology data from the Luki site which was monitored in the 1950s to phenology data from the other sites which were monitored in the 2000s is valid as rainfall seasonality is similar between the two periods (B. Angoboy Ilondea, unpubl. data).
In the end, information on the flowering phenology of 25 populations (a population being a species in a site) across central Africa was available on a monthly basis: Entandrophragma cylindricum (three sites; 2005–2011, 2005–2013, 2010–2013), Erythrophleum suaveolens (four sites; 1948–1958, 1998–2003, 2005–2011), Lophira alata (three sites; 2005–2011, 2011–2014, 2012–2014), Mansonia altissima (one site; 2004–2007), Milicia excelsa (four sites; 1947–1958, 2004–2010, 2005–2011, 2005–2013), Pterocarpus soyauxii (two sites; 1998–2003, 2005–2011), Terminalia superba (four sites; 1947–1958, 1998–2003, 2005–2010, 2005–2011), and Triplochiton scleroxylon (four sites; 2004–2008, 2005–2011, 2005–2012).
Herbarium-derived flowering data
For the eight species investigated here, we examined the herbarium collections of Meise Botanic Garden (Meise, Belgium; n = 322, P. Stoffelen, pers. comm.) and of the herbarium of Naturalis Biodiversity Center (Leiden, the Netherlands; n = 206, J.J. Wieringa, pers. comm.). Additionally, the online collections of the French National Museum of Natural History (Paris, France; n = 197) and of the Royal Botanical Gardens Kew (Kew, UK; n = 23) were examined. These four herbaria provide a very good coverage for the studied region and hold specimens of far more than 80% of all the available material for the region (P. Stoffelen, pers. comm.), though the whole region still remains largely under-sampled (Sosef et al. Reference Sosef, Dauby, Blach-Overgaard, Van Der Burgy, Catarino, Damen, Deblauwe, Dessein, Dransfield, Droissart, Duarte, Engledow, Fadeur, Figueira, Gereau, Hardy, Harris, De Heij, Janssens, Klomberg, Ley, Mackinder, Meerts, Van De Poel, Sonké, Stévart, Stoffelen, Svenning, Sepulchre, Zaiss, Wieringa and Couvreur2017, Stropp et al. Reference Stropp, Ladle, Malhado, Hortal, Gaffuri, Temperley, Skoien and Mayaux2016). For all fertile specimens, the flowering status, the collection date (month-year) and geographic coordinates were recorded. Specimens with flowers just before anthesis, open flowers or old flowers were categorized as ‘flowering’. Specimens annotated with a range of collection dates were discarded unless all dates belonged to the same month of the same year, in this case we used the 15th day of the month as collection date. For specimens without available coordinates but with an identifiable locality name we used this information to assign geographic coordinates using Google Earth software (n = 173 or 23% of all specimens). The least precise coordinates were recorded in degrees-minutes.
Overall, we gathered 53 specimens for Entandrophragma cylindricum, 111 specimens for Erythrophleum suaveolens, 31 specimens for Lophira alata, 17 specimens for Mansonia altissima, 89 specimens for Milicia excelsa, 56 specimens for Pterocarpus soyauxii, 28 specimens for Terminalia superba and 31 specimens for Triplochiton scleroxylon. The contribution of each herbarium to the total number of flowering specimens is detailed in Appendix 1. All specimens were collected from 1861 to 2017.
Rainfall data
We computed mean monthly rainfall over the period 1981–2000 from the CHIRPS estimates of monthly rainfall for Africa which are based on remote sensing (Funk et al. Reference Funk, Peterson, Landsfeld, Pedreros, Verdin, Shukla, Husak, Rowland, Harrison, Hoell and Michaelsen2015, ftp://ftp.chg.ucsb.edu/pub/org/chg/products/CHIRPS-2.0/africa_monthly/). To model species distribution, climate data derived from remote sensing such as the CHIRPS database perform better than the widely used interpolation of ground observations such as the WorldClim database (Hijmans et al. Reference Hijmans, Cameron, Parra, Jones and Jarvis2005), especially in areas with sparse weather stations such as tropical Africa (Deblauwe et al. Reference Deblauwe, Droissart, Bose, Sonké, Blach-Overgaard, Svenning, Wieringa, Ramesh, Stévart and Couvreur2016). Mean monthly rainfall values were then extracted for a large area (Figure 1) which include the seven study sites for which field observations of tree phenology were available, as well as all geographic locations covered by the herbarium collections (and thus including non-forested areas).
Data analyses
First, temporal patterns in flowering phenology (frequency and seasonality) were identified using the standardized phenological data collected in field sites. Only reproductive trees were kept for analysis (i.e. trees that have flowered at least once over the study period). We used the graphical analysis developed by Newstrom et al. (Reference Newstrom, Frankie and Baker1994) to determine the frequency of flowering (continuous, sub-annual, annual or supra-annual) at population level, based on the proportion of flowering trees across time. Flowering with sporadic brief breaks corresponds to the continuous class, flowering in more than one cycle per year corresponds to the sub-annual class, flowering in only one major cycle per year corresponds to the annual class, and flowering in one cycle over more than 1 year corresponds to the supra-annual class (Newstrom et al. Reference Newstrom, Frankie and Baker1994). We used circular statistics to assess the seasonality of flowering. Calendar dates (day-month) of flowering were converted to 1–360° angles to calculate in a circular manner a mean angle and vector length for each population. The length of the mean vector (which varies between 0 and 1) indicates the concentration of phenological activity around the mean date of flowering (which is the mean angle back-converted to calendar date). We performed a Rayleigh’s test to test whether the flowering events were significantly aggregated around the mean date (significant mean vector length).
Second, we assessed the spatial variation in the timing of flowering using herbarium-derived flowering data and testing the relative influence of latitude, longitude and spatial variation in the seasonality of rainfall, on the collection date (in day-month) of flowering specimens. At this step we also visually checked whether the flowering specimens well covered the distribution area of the species. The latter was estimated using the RAINBIO database of tropical African vascular plants distributions (Dauby et al. Reference Dauby, Zaiss, Blach-Overgaard, Catarino, Damen, Deblauwe, Dessein, Dransfield, Droissart, Duarte, Engledow, Fadeur, Figueira, Gereau, Hardy, Harris, De Heij, Janssens, Klomberg, Ley, Mackinder, Meerts, Van de Poel, Sonké, Sosef, Stévart, Stoffelen, Svenning, Sepulchre, Van Der Burgt, Wieringa and Couvreur2016). To summarize the main pattern of rainfall variation over the area we performed a principal component analysis (PCA) on CHIRPS monthly rainfall estimates (12 variables). The first axis of the PCA (depicting the timing of the dry season) was used as an index of rainfall seasonality. Then we converted dates of collection of flowering specimens into radians, and tested the relative influence of latitude, longitude and first-axis scores of the PCA on monthly rainfall on the radians using a Bayesian circular generalized linear model (Mulder & Klugkist Reference Mulder and Klugkist2017). We also checked that year and day-month of collection were not correlated using the same model but with year as unique covariate. Given that latitude, longitude and index for the timing of dry season were often strongly correlated (absolute value of correlation coefficient > 0.7, Dormann et al. Reference Dormann, Elith, Bacher, Buchmann, Carl, Carré, Marquéz, Gruber, Lafourcade, Leitão, Münkemüller, McClean, Osborne, Reineking, Schröder, Skidmore, Zurell and Lautenbach2013, Appendix 2), we also ran the model for each of these variables separately and checked the consistency of the results. For all models, we performed 100 000 iterations with a burn-in of 1000 and thinning of 10. All analyses were performed using R 3.4.4 (https://www.R-project.org/).
Results
Flowering patterns observed in field sites
For the eight species studied, field observations demonstrated annual flowering for 20 out of the 25 populations monitored, and supra-annual flowering for the remaining five populations (Table 1, Figure 2). Four species showed annual flowering regardless of site (Lophira alata three sites, Mansonia altissima one site, Terminalia superba four sites and Triplochiton scleroxylon four sites). We identified supra-annual flowering for Pterocarpus soyauxii in the two sites where the species was monitored. Three species showed a variation in flowering cycle depending on site. Entandrophragma cylindricum flowered annually at Mindourou (N = 65 trees) and M’Baïki (N = 60), and flowered supra-annually at Pokola (N = 12). Erythrophleum suaveolens flowered annually at Mindourou (N = 40), Pokola (N = 24) and Luki (N = 8), and flowered supra-annually at M’Baïki (N = 4). Milicia excelsa flowered annually at Mindourou (N = 56), M’Baïki (N = 30) and Luki (N = 22, but the pattern was less clear at the end of the monitoring period), and flowered supra-annually at Pokola (N = 5). For these three species, supra-annual cycles may result from the small number of trees monitored (12 for E. cylindricum at Pokola, four for E. suaveolens at M’Baïki and five for M. excelsa at Pokola). Similarly, the supra-annual flowering identified for P. soyauxii may result from the small number of trees monitored (three and six trees at Pokola and M’Baïki, respectively).

Figure 2. For the eight study species Entandrophragma cylindricum (a), Erythrophleum suaveolens (b), Lophira alata (c), Mansonia altissima (d), Milicia excelsa (e), Pterocarpus soyauxii (f), Terminalia superba (g) and Triplochiton scleroxylon (h), proportion of trees flowering in each month of each year, in the sites where the species was monitored. The total number (N) of flowering trees in each site is indicated in parentheses with flowering cycle, and grey vertical lines indicate the beginning of the year (January).
Circular analysis of dates of flowering confirmed that flowering activity was significantly (P < 0.05) concentrated around a specific date for all population studied, with rho the length of the mean vector ranging from 0.50 (M. excelsa, Luki, N = 22 trees) to 1 (P. soyauxii, Pokola, N = 3) (Table 1). In the northern part of central Africa (all sites but Luki), six species flowered in December–March, and two species in July–August (M. altissima and P. soyauxii, Table 2, Figure 2). A slight between-site variation in the timing of flowering was observed for three species that were monitored both at the northern sites and at the southern site Luki (E. suaveolens, M. excelsa and T. superba). On average E. suaveolens flowered in January–February at the northern sites (rho ranging between 0.64 and 0.89, Table 1) but flowered in April at the southern Luki site (rho = 0.75); M. excelsa flowered in February–March at the northern sites (rho ranging between 0.77 and 0.96) but flowered in November at Luki (rho = 0.50); and T. superba flowered in February at the northern sites (rho ranging between 0.58 and 0.98) yet flowered in November at Luki (rho = 0.74). We also found between-site variation in the timing of flowering of T. scleroxylon even though all populations were monitored in the northern part of central Africa. The mean flowering peak for this species was in January–February at Pokola (rho = 0.55), Mindourou (rho = 0.76) and M’Baïki (rho = 0.75), whereas flowering occurred on average in September at Kabo (rho = 0.67).
Table 2. Between-site variation in the timing of flowering for the eight species (data from Table 1). The cycle corresponds to the phenological pattern graphically determined at population level following the approach of Newstrom et al. (Reference Newstrom, Frankie and Baker1994) (Figure 2). The most frequent cycle found among populations (i.e. a species in a site) is reported, and when another cycle was identified for one population it is indicated in parentheses. For each population, the mean date of flowering during the monitoring period is indicated with the corresponding season (long_dry = major dry season, short_dry = short dry season, wet = major wet season). Sites are ordered according to the timing of the dry season (i.e. the score on the first axis of the PCA on monthly rainfall values indicated in parentheses)

Variation in the timing of flowering: insights from herbarium specimens
The spatial distribution of flowering specimens of the eight species studied covered their species-specific distribution ranges well (Figure 3). For the three species with a narrow distribution, flowering specimens of T. scleroxylon were mainly collected in January (42% of the specimens), those of M. altissima in July–August (58%), and those of P. soyauxii in July (29%; Figure 3). For the species with an intermediate distribution size, flowering specimens were mainly collected in February (29%), January (38%) and December–January (67%) for T. superba, E. cylindricum and L. alata, respectively (Figure 3). Finally, for the most widely distributed species M. excelsa and E. suaveolens, their flowering specimens were mainly collected in March (20%) and in February (26%; Figure 3), respectively.

Figure 3. Location of flowering herbarium specimens (black crosses, number n indicated in black) across Africa for the eight species Entandrophragma cylindricum (a), Erythrophleum suaveolens (b), Lophira alata (c), Mansonia altissima (d), Milicia excelsa (e), Pterocarpus soyauxii (f), Terminalia superba (g) and Triplochiton scleroxylon (h). Species spatial distribution i.e. location of RAINBIO occurrences (Dauby et al. Reference Dauby, Zaiss, Blach-Overgaard, Catarino, Damen, Deblauwe, Dessein, Dransfield, Droissart, Duarte, Engledow, Fadeur, Figueira, Gereau, Hardy, Harris, De Heij, Janssens, Klomberg, Ley, Mackinder, Meerts, Van de Poel, Sonké, Sosef, Stévart, Stoffelen, Svenning, Sepulchre, Van Der Burgt, Wieringa and Couvreur2016) is indicated with grey circles (number n indicated in grey). Insets show the frequency of flowering herbarium collections by month (represented from December to November for clarity).
Rainfall seasonality and spatial variation in the timing of flowering
The principal component analysis of mean monthly rainfall separated grid cells along a first axis that explained 52% of the total variance, and along a second axis that explained 34% of the total variance. The first axis depicted the timing of the dry season that differs between the northern and southern hemisphere, with negative values indicating a southern climate with a main dry season occurring in July–August, and positive values indicating a northern climate with a main dry season occurring in December–January–February (Figure 1). The second axis was highly negatively correlated with mean annual rainfall (Pearson’s correlation r = −0.95, P < 0.001). Among the sites where phenological monitoring was conducted, we found that Luki displayed a unique dry season centred around July–August (southern climate, first axis scores of −2.4) opposed to M’Baïki and Mamfe that displayed a unique dry season in December–January–February (northern climate, first axis scores of 2.1 and 6.5, respectively). The Maan, Pokola, Kabo and Mindourou sites, having positive first axis scores of 1.1, 1.1, 1.3 and 1.8, respectively, showed a major dry season from December to February, but also displayed a reduction in rainfall in July (Figure 1).
To investigate the spatial variation in the timing of flowering, we analysed the relative influence of latitude, longitude and timing of the dry season (i.e. first axis score of the PCA on monthly rainfall values) on the collection date of flowering specimens. We found significant effects (regression coefficients significantly different from 0) indicating a shift in the timing of flowering with latitude for E. suaveolens, and with timing of the dry season for M. excelsa and L. alata (Table 3). For L. alata however, the effect of timing of the dry season was not significant when included as a single variable in the model, suggesting that the effect was weak. For E. suaveolens and M. excelsa it seems that the flowering peak roughly occurred around October at low latitude (south of 1°S) and around February–March at high latitude (north of 2°N), the area around the equator showing both peaks (Figure 4a, b). Because of its more restricted distribution and lower number of specimens we could not evaluate whether L. alata had the same pattern (Figure 4c). For the other species studied, none of latitude, longitude or timing of the dry season had an effect (Table 3). We also did not find any significant relationship between the year of collection and timing of flowering for any species (Table 3).
Table 3. For the eight species, latitudinal range (in decimal degrees) of collected fertile specimens in square brackets, total number of specimens (N), and results of the Bayesian circular generalized linear model testing the relative influence of latitude, longitude, and timing of the dry season (first axis score of the PCA on monthly rainfall) on dates of collection (day-month) of flowering herbarium specimens converted in radians (Latitude + Longitude + Rainfall). Results of the models testing the influence of year of collection (Year), latitude (Latitude), longitude (Longitude) and timing of the dry season (Rainfall) are also reported. For each model, the posterior means of the regression coefficients are given with their credible intervals in square brackets, as well as the Widely Applicable Information Criterion (WAIC, first formulation of the WAIC as given in Bayesian Data Analysis; Gelman et al. Reference Gelman, Carlin, Stern and Rubin2003). Posterior means of regression coefficients significantly different from zero are indicated with symbols (*).
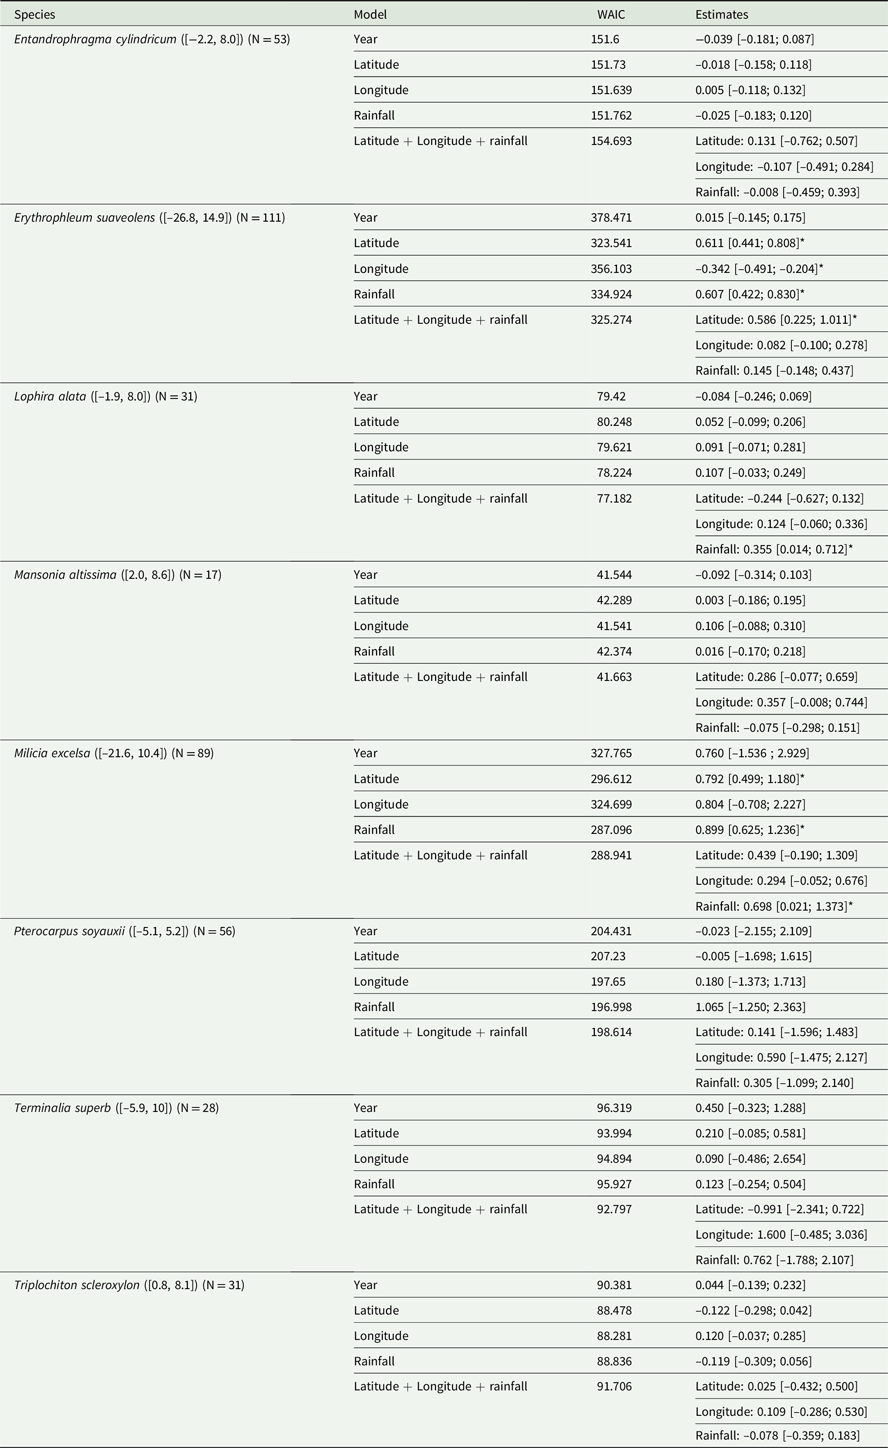

Figure 4. Relationship between calendar dates of flowering herbarium specimens (in Julian days) and the variable explaining their variation, that is latitude for Erythrophleum suaveolens (a) and timing of the dry season (first axis score of the PCA on monthly rainfall) for Milicia excelsa (b) and Lophira alata (c). In a, b and c, open circles represent specimens collected at south of 1°S, black circles those collected between 1°S and 2°N, and grey circles those collected at north of 2°N. For clarity, the second y-axis indicates the months corresponding to Julian days.
Discussion
Annual flowering dominates
Studying eight large-statured (briefly) deciduous canopy tropical African tree species showed that an annual flowering phenology was the most common pattern at population level (20 out of the 25 populations monitored in time showed an annual flowering, and annual flowering was the most common pattern for seven out of the eight species examined). We identified supra-annual flowering for the remaining five populations but this likely resulted from the small number of trees monitored. The dominance of an annual cycle in the reproductive phenology has been previously reported in central Africa for specific species in specific sites such as Milicia excelsa in south-eastern Cameroon (Mindourou site; Daïnou et al. Reference Daïnou, Laurenty, Mahy, Hardy, Brostaux, Tagg and Doucet2012b) or Millettia laurentii in the Mai Ndombe area, DRC (Menga et al. Reference Menga, Nasi, Bayol and Fayolle2012). Similar patterns were reported in Luki, western DRC at the community level (Couralet et al. Reference Couralet, Van Den Bulcke, Ngoma, Van Acker and Beeckman2013) and for most species at La Lopé National Park, Gabon (Bush et al. Reference Bush, Abernethy, Jeffery, Tutin, White, Dimoto, Dikangadissi, Jump and Bunnefeld2017) where Fourrier analyses showed that 88% of the species displayed annual flowering phenology. At a larger scale, annual phenology was also reported for most trees across tropical Africa (Adamescu et al. Reference Adamescu, Plumptre, Abernethy, Polansky, Bush, Chapman, Shoo, Fayolle, Janmaat, Robbins, Ndangalasi, Cordeiro, Gilby, Wittig, Breuer, Breuer-Ndoundou Hockemba, Sanz, Morgan, Pusey, Mugerwa, Gilagiza, Tutin, Ewango, Sheil, Dimoto, Baya, Bujo, Ssali, Dikangadissi, Jeffery, Valenta, White, Masozera, Wilson, Bitariho, Ndolo Ebika, Gourlet-Fleury and Beale2018), including sites in West Africa (N = 1), central Africa (N = 5) and East Africa (N = 5). Elsewhere in the tropics, the predominant flowering type was the sub-annual pattern at La Selva, Costa Rica (a wet forest without a severe dry season) and the supra-annual pattern in dipterocarp forests of South-east Asia (where fluctuation in rainfall is quite unpredictable) (Sakai Reference Sakai2001). The strong seasonality of the African climate, and specifically rainfall seasonality, might explain the dominance of annual cycles.
Timing of flowering and its spatial variability
In our study sites located north of the climatic hinge, flowering was generally associated with the occurrence of the dry season. Flowering peaked during the major dry season for six species and during the short dry season for two species. Flowering in the dry season has been already observed for M. excelsa in south-eastern Cameroon (Mindourou site; Daïnou et al. Reference Daïnou, Laurenty, Mahy, Hardy, Brostaux, Tagg and Doucet2012b) and Millettia laurentii in the Mai Ndombe area, DRC (Menga et al. Reference Menga, Nasi, Bayol and Fayolle2012), and at the community level in Luki, western DRC south of the equator (Angoboy Ilondea et al. Reference Angoboy Ilondea, Beeckman, Ouédraogo, Bourland, De Mil, Van den Bulcke, Van Acker, Couralet, Ewango, Hubau, Toirambe, Doucet and Fayolle2019, Couralet et al. Reference Couralet, Van Den Bulcke, Ngoma, Van Acker and Beeckman2013). Elsewhere in the tropics, flowering in the dry season has already been noticed in several neotropical forests (reviewed in Janzen Reference Janzen1967, Sakai Reference Sakai2001, Wright & van Schaik Reference Wright and van Schaik1994). This pattern was hypothesized to be the result of selection for sexual reproduction during a period of lack of interference with vegetative processes, to allow full competitive (vegetative) activity during the rainy season (Janzen Reference Janzen1967). It was also hypothesized that it is the result of selection to coincide with peak irradiance when water is available (Wright & van Schaik Reference Wright and van Schaik1994), and recently it has been shown in central Panama that high and increasing levels of irradiance are the proximate cues for flowering in many (but not all) tree species (Wright & Calderón Reference Wright and Calderón2018). Increasing levels of irradiance during the dry season intuitively result from lack of clouds, but may also result from particular cloudy conditions that increase diffuse light (Pau et al. Reference Pau, Wolkovich, Cook, Nytch, Regetz, Zimmerman and Wright2013). Indeed the light-use efficiency of forests can be higher under cloudy or partly cloudy conditions (low irradiance conditions) because diffuse light is scattered more uniformly throughout the canopy and understorey, whereas on clear-sky days sunlight comes from a single direction and many leaves remain in shade. Another hypothesis to explain flowering during the dry season is the availability of pollinators. Since most herbs will not flower in this period there are in general fewer flowers available so flowers may need to produce less nectar to be competitive for attracting pollinators.
The flowering during dry season at the north of the climatic hinge suggests a correlation between the timing of flowering and rainfall seasonality. However, for the three species Erythrophleum suaveolens, Milicia excelsa and Terminalia superba that were also monitored south of the climatic hinge (i.e. in site Luki), flowering occurred at the beginning or the end of the wet season. As such the north-south between-site variation in flowering phenology for these species does not perfectly match with the inversion of the timing of the dry season. Also, in Gabon, Doucet (Reference Doucet2003) observed that the majority of the tree species monitored (16 out of 19 species) flowered during the wet season. Likewise, all nine Gabonese tree legume species tested by Wieringa (Reference Wieringa1999) that showed a significant flowering period flowered during the rainy season. This suggests that other factors partially correlated with rainfall seasonality drive the flowering phenology of these species. For instance, Daïnou et al. (Reference Daïnou, Laurenty, Mahy, Hardy, Brostaux, Tagg and Doucet2012b) showed that flowering of M. excelsa at Mindourou in Cameroon was significantly correlated with a decrease in relative air humidity 3 mo prior to flowering. If the decrease in relative air humidity during the dry season differs either north or south of the climatic hinge due to the influence of other factors than rainfall (e.g. wind or temperature), this may explain why we did not observe a shift in flowering that matches the inversion of the dry season.
Van Schaik et al. (Reference Van Schaik, Terborgh and Wright1993) reported for tropical forests around the equator (in Africa, Asia and America) a 6-month shift in community-level peak flowering linked to the month of peak irradiance (when the sun passes directly over the localities). Here we showed at population level a slightly different pattern. The analysis of herbarium collections revealed a shift in flowering peak from northern sites toward southern sites for E. suaveolens and M. excelsa (and to a lesser extent L. alata), with the coexistence of two flowering peaks near the equator where monthly rainfall is bimodal with two dry seasons and two rainy seasons. These results suggest that the spatial variation in the timing of flowering could be explained by the spatial variation in rainfall seasonality, but this was true only for M. excelsa (and to a lesser extent L. alata). For M. excelsa, we may even expect a stronger correlation with the spatial variation in seasonal patterns of air relative humidity. For E. suaveolens, the spatial variation in the timing of reproduction may be due to the spatial variation in a climatic factor other than rainfall seasonality. In this context, the role of light in particular should be further explored.
Conclusion
The analysis of field observations of flowering for the eight species studied showed a strong seasonality of flowering, which usually occurred during dry seasons. Our field sites were however almost all located at the north of the climatic hinge, and the pattern is likely to be different at the south (as observed here for three species). Although rainfall seasonality may play a role in driving the flowering for some species, more discriminating climatic variables such as air humidity have to be explored. Further research is needed to identify the drivers (either abiotic or biotic) of flowering of these economically important species. In particular, the influence of soil fertility on the probability of flowering should be explored, with lower probabilities of flowering (e.g. supra-annual flowering) expected on low-fertility sites (Monks et al. Reference Monks, Monks and Tanentzap2016). Finally, the analysis of herbarium collections revealed for two widely distributed species a shift in flowering peak from northern sites toward southern sites, with the coexistence of two flowering peaks near the equator where precipitation is bimodal. This indicates that the hypothesis of genetic discontinuities due to a 6-month north-south shift in flowering phenology preventing gene flow between northern and southern populations (Hardy et al. Reference Hardy, Born, Budde, Daïnou, Dauby, Duminil, Ewédjé, Gomez, Heuertz and Koffi2013) is not supported for the species here studied.
Acknowledgements and financial support
The phenological data from the Republic of the Congo were collected thanks to Jean-François Gillet, B. Ngalouo, the logging company CIB-Olam, the NGO Nature+ and the funding of FFEM (Fonds Français pour l’Environnement Mondial) through the CIB FFEM project (convention No. CCG1071.01A). The phenological data from Cameroon was collected thanks to Kasso Daïnou, Achille Bernard Biwolé, Nils Bourland, Fousséni Fétéké, Yao Lambert Kouadio, the logging companies Pallisco and Wijma, the NGO Nature+ and the funding of FFEM by the DynAfFor and P3FAC projects (conventions No. CZZ1636.01D, No. CZZ1636.02D and No. CZZ2101.01R). The phenological data from M’Baïki in Central African Republic was collected thanks to the ARF Project (Appui la Recherche Forestière) and its seven funding partners: AFD (Agence Française de Développement), CIRAD (Centre de Coopération Internationale en Recherche Agronomique pour le Développement), ICRA (Institut Centrafricain de Recherche Agronomique), MEFCP (Ministère centrafricain des Eaux, Forêts, Chasse et Pêche), SCAC/MAE (Service de Coopération et d’Actions Culturelles, Ministère des Affaires Etrangères), SCAD (Société Centrafricaine de Déroulage) and the University of Bangui. We are also grateful to Laurent Cerbonney (SCAC/MAE) and Hervé Moinecourt (SCAC/MAE) who participated in the phenological data collection and data capture. The phenological data from Luki in Democratic Republic of the Congo was collected thanks to INERA (Institut National pour l’Etude et la Recherche Agronomique). We also acknowledge the efforts of all field workers involved in data collection at all sites and countries. We are grateful to the French National Museum of Natural History and to the Royal Botanical Gardens Kew for providing online access to their herbarium collections. We are also grateful to Joseph Langridge for English editing. S.B. Janssens has received funding from the European Union’s Horizon 2020 research and innovation programme under the Marie Sklodowska-Curie grant agreement No. 765000. The post-doctoral position of Dakis-Yaoba Ouédraogo was funded by the HERBAXYLAREDD research project (BR/143/A3/HERBAXYLAREDD).
Appendices
Appendix 1
For the flowering herbarium specimens of the eight species, number of specimens coming from each herbarium (Meise: Meise Botanic Garden; Paris: National Museum of Natural History in Paris; Leiden: Naturalis Biodiversity Center in Leiden; Kew: Royal Botanical Gardens Kew) and total number of specimens (N Total).

Appendix 2
For the eight study species Entandrophragma cylindricum (a), Erythrophleum suaveolens (b), Lophira alata (c), Mansonia altissima (d), Milicia excelsa (e), Pterocarpus soyauxii (f), Terminalia superba (g) and Triplochiton scleroxylon (h), correlation matrix of the variables used to explain the variation in the collection month of flowering herbarium specimens. ‘Year’ corresponds to the year of collection, ‘Latitude’ to specimen’s latitude coordinate, ‘Longitude’ to specimen’s longitude coordinate, and ‘Timing dry season’ corresponds to the first axis scores of a principal component analysis on monthly rainfall, with positive scores indicating that the major dry season occurs in December–January–February, and negative scores indicating that the major dry season occurs in July–August. Pearson’s correlation coefficients are displayed below the diagonal, and associated P values above the diagonal.


