


INTRODUCTION
Savanna structure and composition are thought to be mainly subject to the influence of fire and herbivory (Solbrig et al. Reference SOLBRIG, MEDINA, SILVA, Solbrig, Medina and Silva1996). However, recent studies suggest that termite activity plays an integral part in generating savanna vegetation patterns and dynamics (Okullo & Moe Reference OKULLO and MOE2012a, Sileshi et al. Reference SILESHI, ARSHAD, KONATE and NKUNIKA2010), while large herbivores maintain and amplify patterns and processes (Okullo & Moe Reference OKULLO and MOE2012b). Termites influence patterns of savanna vegetation directly through foraging and indirectly through reallocation of soil, water and nutrients (Sileshi et al. Reference SILESHI, ARSHAD, KONATE and NKUNIKA2010, Wood & Sands Reference WOOD, SANDS and Brian1978). Several species of termite construct above-ground earthmounds that incorporate the colony's nest. Termites, particularly those of the fungus-cultivating genus Macrotermes, have been described as ecosystem engineers (Dangerfield et al. Reference DANGERFIELD, MCCARTHY and ELLERY1998, Jouquet et al. Reference JOUQUET, TRAORE, CHOOSAI, HARTMANN and BIGNELL2011) influencing abiotic and biotic properties of savannas. Several authors have outlined similar influences of termite mound building on soils and, hence, on savanna vegetation, proposing that the creation of nutrient hot-spots leads to more heterogeneous ecosystems (Levick et al. Reference LEVICK, ASNER, KENNEDY-BOWDOIN and KNAPP2010, Pringle et al. Reference PRINGLE, DOAK, BRODY, JOCQUÉ and PALMER2010).
It has been reported that mounds support a greater diversity of plants compared with surrounding areas (Moe et al. Reference MOE, MOBAEK and NARMO2009, Okullo & Moe Reference OKULLO and MOE2012a, Traoré et al. Reference TRAORÉ, TIGABU, OUEDRAOGO, BOUSSIM, GUINKO and LEPAGE2008a). In particular, a greater diversity of woody plant species has been noted on mounds compared with the surrounding savanna. Mounds have been discussed in this context as focal points for tree regeneration within savannas (Cole Reference COLE1963, Moe et al. Reference MOE, MOBAEK and NARMO2009, Traoré et al. Reference TRAORÉ, TIGABU, OUEDRAOGO, BOUSSIM, GUINKO and LEPAGE2008a).
However, most studies have focused on the local impact of termite mounds on vegetation and have mainly been conducted at a single site. The overarching importance of mounds for savanna vegetation and their dynamics across savanna types and vegetation zones are still unclear. The aim of this study was to investigate differences between termite-mound vegetation and adjacent savanna vegetation both on a local scale and along a regional climatic gradient. We expected the phytodiversity on mounds to be higher than in the surrounding savanna along a climatic gradient, particularly with regard to woody plants. We further hypothesized that the phytodiversity of savanna vegetation and mound vegetation would increase along a climatic gradient from drier to more humid areas. Compared with the surrounding savannas, enrichment of clay and related soil parameters (i.e. increased field moisture capacity and nutrient concentrations) was expected to occur on mounds in similar magnitude along the climatic gradient. Finally, we aimed to reveal whether there were plant species characteristic of termite mounds to improve ecological understanding of the role of termite mounds in creating vegetation heterogeneity.
METHODS
Study sites
This study was conducted in five protected areas (PA) in Burkina Faso and Benin, representing a climatic gradient from the Sahel zone to the limit of the southern Sudanian vegetation zone (Figure 1). Annual precipitation ranges from less than 400 mm in the Sahel to approximately 1000 mm in the Sudanian zone, with a distinct unimodal dry season of 5–7 mo occurring throughout the study area. The study sites were located in the Sahel Partial Reserve (Réserve Sylvo-Pastorale et Partielle de Faune du Sahel, abbreviated as RPS; 14°48΄N, 0°42΄W), Niouma Classified Forest (Forêt Classée de Niouma, FCN; 12°55΄N, 2°41΄W), Gonsé Classified Forest (Forêt Classée de Gonsé, FCG; 12°23΄N, 1°18΄E), W Transborder Park (Parc National du W, PNW; 11°48΄N, 2°10΄E) and Pendjari National Park (Parc National de la Pendjari, PNP; 11°22΄N, 1°33΄E). At each study site, we sampled the most abundant savanna types, excluding temporarily waterlogged or seasonally inundated localities, as these represent ecologically extreme situations. Savanna types were identified based on surveys we performed and on vegetation classifications for the respective sites. Appendix 1 presents an overview of the sampled savanna types and mean annual precipitation (MAP) at our study sites.

Figure 1. Study sites in protected areas along a climatic gradient in West Africa (Burkina Faso and northern Benin). Rectangles indicate approximate location of study sites. Sites from north to south: Sahel Partial Reserve (RPS, 360 mm MAP), Niouma Classified Forest (FCN, 670 mm), Gonsé Classified Forest (FCG, 760 mm), W National Park (PNW, 840 mm), and Pendjari National Park (PNP, 950 mm). Broken lines indicate approximate limits of Sahelic and Northern Sudanian vegetation zones.
In West Africa, conspicuous thicket clumps can be found on termite mounds, which are usually delimited by a distinct boundary from the adjacent savanna vegetation. Due to erosion, this boundary may be situated several metres from the actual mound slope. This pediment may also consist of areas bare of vegetation, emphasizing the contrast between the mound thicket and savanna. For brevity, we will refer to termite-mound vegetation as mounds.
Survey design
In a paired design, we sampled the vegetation of 128 mounds built by Macrotermes colonies and adjacent savanna plots. Within our study area, two Macrotermes species build the type of mounds that we studied with respect to architecture and size: M. subhyalinus (Rambur) and M. bellicosus(Smeathman). Species identification was confirmed by field work carried out in association with termite specialists (J. Korb & collaborators). The two Macrotermes species in our study area occur sympatrically, with the northern limit of M. bellicosus occurring within our study area (Ruelle Reference RUELLE1970). Unfortunately, no detailed data on the distribution of M. bellicosus and M. subhyalinus in this region are currently available. Mounds containing living colonies of these two species may be identified based on architectural attributes (Korb Reference KORB, Bignell, Roisin and Lo2011). In general, eroded and vegetated mounds in our study area do not contain living colonies, but re-colonization, mainly by Microtermes and Ancistrotermes spp., may occur (J. Korb, pers. comm.). We did not sample mounds where there was visible colonization. Because abandoned, eroded M. bellicosus mounds can be confounded with eroded M. subhyalinus mounds, we cannot report which Macrotermes species built the mounds. However, all of the studied termite mounds were comparable with respect to their structure and were distinguished from mounds built by other Macrotermitinae (e.g. Odontotermes spp.).
The topography of the selected savannas is almost flat. When selecting termite mounds, we avoided shallow depressions (bas-fonds) and hillsides. After identifying localities where mounds occur, we randomly selected mounds for vegetation sampling and determined their surface area as the longest diameter of the mound multiplied by its perpendicular diameter. A squared plot of corresponding size was established 15 m north of the limit of the mound to investigate the vegetation of the surrounding savanna. If additional mounds occurred within 15 m of the savanna plot, we rotated the direction from the corresponding mound anticlockwise in steps of 15°.
To avoid interpersonal differences in phytosociological cover estimations, all sampling was done by the first author. Estimations were performed separately for the tree layer (woody plants > 5 m), the shrub layer (woody and partially ligneous plants from 0.5 to 5 m), and the herbaceous layer (all plants up to 0.5 m in height). Vegetation was recorded twice, at the beginning (May–July) and the end of the rainy season (September–November), to account for variation in phenology. For the analysis, we used the maximum cover of each species (expressed in %) from the two samplings. The plant species nomenclature followed the African Plants Database (http://www.ville-ge.ch/musinfo/bd/cjb/africa).
Environmental data
We collected samples of 10 cm3 from the upper topsoil horizon of mounds and savannas, pooling samples from four directions in each case. Mound soil was collected from the slope of the mound. Savanna soil was sampled at a distance of 15 m from the edge of the mound, and all samples were subsequently sieved and air dried. For each mound and savanna plot, several descriptive soil parameters were used. We determined pH in aqueous suspension and 0.1 M KCl solution. Concentrations of plant-available phosphorus and potassium were determined spectroscopically using the calcium acetate lactate method. Nitrogen was determined using the Kjeldahl method. Organic and inorganic carbon were determined spectroscopically by wet and dry combustion, respectively (DIN ISO 10694), after volumetric determination of carbonates (DIN ISO 10693 1997-05).
Additionally, we selected at least three plot pairs in every savanna type at random, and determined cation exchange capacity (CEC), together with individual ion concentrations of sodium, potassium, calcium and magnesium (DIN ISO 13536:1997-04). For these samples, particle size distribution (PSD) also was determined, using the Köhn pipette method in seven grain size fractions.
Moreover, we used a set of 18 bioclimatic variables (Table 1) from the WORLDCLIM database with a spatial resolution of 30 arc seconds, i.e. approximately 1 km2 (Hijmans et al. Reference HIJMANS, CAMERON, PARRA, JONES and JARVIS2005). We added potential evapotranspiration (PET) and the Global Aridity Index (AI) to this dataset (Zomer et al. Reference ZOMER, TRABUCCO, BOSSIO and VERCHOT2008), which also takes the radiation budget into account.
Table 1. Spearman's rank correlation coefficients considering climatic variables and measured soil variables, correlated with DCA axes scores for 256 termite mounds and adjacent savanna plots along a climatic transect in West Africa. Climatic data were extracted from the WORLDCLIM database and the Global Aridity and PET database on a resolution of 30 arc seconds for each mound- and savanna-plot geolocation. Spearman's rho is given for the correlation between the DCA scores of the first two axes with environmental variables; P-value for rank correlation test.

Statistical analysis
Prior to analyses, vegetation data were arcsine-square-root-transformed. Environmental data were standardized to zero mean unit variance (pH values were previously antilogged). We used detrended correspondence analysis (DCA) to reveal differences in vegetation composition, as this technique provides eigenvalues that allow estimation of gradient length as a measure of variation between samples (Eilertsen et al. Reference EILERTSEN, ØKLAND, ØKLAND and PEDERSEN1990, Hill & Gauch Reference HILL and GAUCH1980). Downweighting of rare species was carried out because 57% of the species in our dataset were recorded in fewer than five sampling plots. We investigated the influence of climate and soil on vegetation differentiation by calculating Spearman's rank correlation coefficients between environmental data and the DCA scores of the first two axes. We calculated species richness, inverse Simpson's Index of Diversity, and the evenness index Evar (Smith & Wilson Reference SMITH and WILSON1996) separately for the three plant layers. Inverse Simpson's Index is a measure of diversity giving less weight to rare species (Tuomisto Reference TUOMISTO2010). Separate treatment of herbaceous and woody layers is advisable due to their relative phytosociological independence in West African savannas (Hahn-Hadjali Reference HAHN-HADJALI1998), which was especially pronounced in our datasets. To examine species-sampling relations, we calculated species-accumulation curves by permuted random sample addition, with the x axis scaled by plot sampling area. As a net measure of differences in diversity between equal-sized paired mound and savanna plots, we chose the logarithmic response ratio, calculated as the natural logarithm of the quotient of mound and comparison-plot values (Hedges et al. Reference HEDGES, GUREVITCH and CURTIS1999). A positive ratio indicates greater diversity in mound plots, whereas a negative ratio indicates greater diversity in savanna plots. For the woody plant layers, we removed pairs where no woody cover occurred in one of the paired plots. Statistical significance of differences between mounds and adjacent savannas were tested using Welch's two-sample t-test.
We calculated indicator values for each species using the IndVal method (Dufrene & Legendre Reference DUFRENE and LEGENDRE1997), where 0 denotes no indication and 100% denotes perfect indication. We conducted 1000 iterations for each research site independently, using the groups of mound plots and savanna plots set a priori. We used the IndVal procedure to identify species that typically occur on termite mounds. Identification of characteristic species promotes understanding of savanna diversity. This method has the advantage of being based on field data rather than on expert knowledge, which is only partially available via floristic works. Species with significant indicator values greater than 60% (McGeoch et al. Reference MCGEOCH, VAN RENSBURG and BOTES2002) were considered to be characteristic termite-mound species.
All data analyses were performed using R 2.11.1 with the packages vegan 1.17–6 and labdsv 1.4–1.
RESULTS
Gradient analysis
DCA produced eigenvalues of 0.60 and 0.44, and gradient lengths of 5.99 and 3.85 for the first two axes, respectively. The first axis of the DCA showed plots in the latitudinal order of the five research sites from north to south. While the mound and savanna plots followed the first axis in parallel and approximately to the same extent, the second axis showed clear separation between mound and savanna plots (Figure 2).
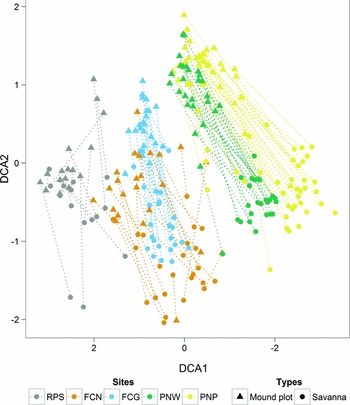
Figure 2. DCA plot of 128 sample pairs (mounds and adjacent savanna plots) and 561 species along a climatic gradient in West Africa. DCA produced eigenvalues of 0.60 and 0.44, and gradient lengths of 5.99 and 3.85 for the first two axes, respectively. Paired samples are connected by lines. Length of first axis: 6.5 SD units. Symbols indicate the plot type (mound or savanna), colours indicate research sites: Sahel Partial Reserve (RPS), Niouma Classified Forest (FCN), Gonsé Classified Forest (FCG), W National Park (PNW), Pendjari National Park (PNP).
The variation in vegetation composition depicted by the first axis was strongly correlated with bioclimatic variables (Table 1). Mean annual precipitation (MAP) and the Global Aridity Index (AI) correlated strongly with the axis scores (MAP: rho 2 = 0.66, AI: rho 2 = 0.65). The second axis was strongly correlated with soil variables, with the highest correlation occurring with the sum of base concentrations (S-value; rho 2 = 0.66). Other CEC-related variables, such as clay content and the concentrations of K+, Ca2+ and Mg2+ ions as well as potential CEC and base saturation (V-value), were also correlated significantly with this axis. Among the set of soil variables available for all plots, pH (rho 2 = 0.54) and potassium concentration (rho 2 = 0.43) showed the strongest correlations.
Diversity analysis
Analysis of the mounds’ impact on diversity indicated complex patterns. We detected a total of 561 species in our plots, 323 (57.6%) of which occurred in fewer than five plots. The lowest numbers of species on termite mounds were recorded in the Sahel (RPS, MAP 360 mm), and the highest were recorded in the central part of the north Sudanian vegetation zone (FCG, MAP 760 mm). Considering 30 × 30-m woody-layer savanna plots only, species-accumulation curves exhibited similar patterns with strongly overlapping confidence intervals for all research sites except the Sahel (Figure 3). Also, curves for woody savanna vegetation showed the strongest notion of saturation. Termite-mound plots showed an overlapping pattern for two groups, with Pendjari National Park (PNP) and RPS both showing low overall species richness compared with the other sites. For adjacent savannas, PNP and RPS also showed congruence, but the species-accumulation curves for the other sites showed distinct differences and little overlap of confidence intervals (Figure 3). It should be noted that mound size (and, therefore, paired comparison site area) vary strongly between research sites, with smaller mounds in the Sahel. The overall mean species richness did not differ between termite mounds (25.6 ± 11.9) and the adjacent savanna (25.5 ± 15.3, P = 0.84, t-value = 0.19, df = 127). When we partitioned our dataset by research sites (Figure 4), sites PNW (MAP 840 mm) and PNP (MAP 950 mm) in the south were observed to exhibit significantly higher species richness (SpR) on mounds (PNW SpR: 29.9 ± 5.76, PNP SpR 19.0 ± 5.22) than in savanna plots (PNW SpR: 25.0 ± 4.71, PNP SpR: 13.3 ± 4.98). No significant differences were found in the northern parts of the transect (RPS, MAP 360 mm; FCN, MAP 670 mm). Remarkably, the savanna vegetation at the central north Sudanian site (FCG, MAP 760 mm, SpR in savannas: 43.7 ± 9.12) was found to be significantly more diverse than the mound vegetation (FCG SpR on mounds: 36.2 ± 8.4). This also held true for the inverse Simpson's Index of Diversity (SI), which showed a greater diversity corrected for rare species at FCG (SI in savannas: 13.8 ± 6.35, on mounds: 8.56 ± 4.46), whereas there were no significant differences found for the other research sites.

Figure 3. Plant species-accumulation curves for termite mounds (a), paired adjacent savanna plots (b) and 30 × 30-m woody-plant savanna plots (c) along a climatic gradient in West Africa. Vertical bars indicate confidence intervals after 100 permutations of randomly adding sites. For (a) and (b), x-axes are scaled by sampling plot area. Sites from north to south: Sahel Partial Reserve (RPS), Niouma Classified Forest (FCN), Gonsé Classified Forest (FCG), W National Park (PNW), and Pendjari National Park (PNP).

Figure 4. Log response ratio of plot pairs as measure of net diversity differences between termite-mound microhabitat and adjacent savannas. Boxplots (boxes represent the area between the first and third quartile, the whiskers extend to the most extreme data point which is no more than 1.5 times the length of the box away from the nearest end of the box) for each research site from north to south (RPS: Sahel Partial Reserve, FCN: Niouma Classified Forest, FCG: Gonsé Classified Forest, PNW: W National Park, PNP: Pendjari National Park, each given with MAP). Columns for boxplots of all layers (a–c), woody plant layers (d–f) and herbaceous layers (g–i) are shown separately. Response ratios above the broken line indicate higher values on mounds, while those below the line indicate higher values in corresponding savanna plots. Significant values are indicated by asterisks (*, P < 0.05; **, P < 0.01; ***, P < 0.001).
When woody layers were analysed alone, both southern sites showed significantly higher diversities on mounds for both species richness (PNW SpR on mounds: 12.5 ± 4.11, in savannas: 7.54 ± 3.3; PNP SpR on mounds: 9.92 ± 2.98, in savannas: 6.05 ± 2.86) and inverse Simpsons's Index (PNW SI on mounds 12.1 ± 3.93, in savannas: 7.25 ± 3.22; PNP SI on mounds: 9.39 ± 2.73, in savannas: 5.93 ± 2.76), whereas no significant difference was detected at any other site.
With respect to the herbaceous layer, we found a significantly higher species richness on mounds only at PNP (SpR on mounds: 12.2 ± 5.09, in savannas: 9.26 ± 4.51), whereas savanna herb layers exhibited greater species numbers than mounds at FCG (SpR in savannas: 40 ± 8.71, on mounds: 34.0 ± 8.23). Inverse Simpson's Index for herbaceous layers presented significantly higher values on mounds both at the north (RPS, SI on mounds: 5.04 ± 1.4, in savannas: 3.53 ± 1.85) and the south of the transect (PNW SI on mounds: 12.08 ± 3.93, in savannas: 7.25 ± 3.22; PNP SI on mounds: 9.39 ± 2.73, in savannas: 5.93 ± 2.76), though this was not the case for the central sites on the transect.
The evenness (Evar) of all species was significantly higher on mounds only at FCN (Evar on mounds: 0.27 ± 0.05, in savannas: 0.22 ± 0.05). Herbaceous evenness was also significantly higher on mounds only at FCN (Evar on mounds: 0.32 ± 0.06, in savannas: 0.28 ± 0.04), while evenness for woody species was significantly lower on mounds than in savannas for RPS (Evar in savannas: 0.9 ± 0.17, on mounds: 0.7 ± 0.21), FCN (Evar in savannas: 0.74 ± 0.22, on mounds: 0.58 ± 0.21), and PNP (Evar in savannas: 0.75 ± 0.23, on mounds: 0.61 ± 0.22).
Indicator species analysis
We found a total of 11 species that were characteristic of termite mounds (Table 2). More characteristic termite-mound species were found at study sites with higher precipitation. At the driest, Sahelic site (RPS, MAP 360 mm), we detected no characteristic termite-mound species (only Boscia angustifolia presented a significant indicator value, which was 31.3% and therefore below the set threshold). At FCN (MAP 670 mm), several species exhibited significant indicator values, but none exceeded the chosen cut-off value. Among the characteristic species, Capparis sepiaria and Feretia apodanthera had indicator values higher than 80% and were characteristic mound species for three sites (FCG, PNW and PNP).
Table 2. Characteristic species for 128 termite mounds separated by research sites along a climatic gradient in West Africa derived by the IndVal method. Sites from north to south: Sahel Partial Reserve (RPS, no characteristic species), Niouma Classified Forest (FCN, no characteristic species), Gonsé Classified Forest (FCG, five characteristic species), W National Park (PNW, six characteristic species), and Pendjari National Park (PNP, eight characteristic species). Significant indicator values between 60% and 100% are shown (100%: perfect indicator, P ≤ 0.05, 1000 iterations). *, significant indicator, < 60% IndVal; n.s., present, but not significant; –, absent.

The characteristic termite-mound species consist of nine shrubs and three ligneous forbs (Ampelocissus multistriata, Asparagus flagellaris and Wissadula amplissima). The last three species and both Combretum aculeatum and Capparis sepiaria exhibit a scrambling or climbing habit. Notably, at the family level, three Capparaceae were found to be characteristic of mounds (Capparis sepiaria, Cadaba farinosa and Maerua oblongifolia).
DISCUSSION
This study provides quantitative evidence of differences between termite-mound vegetation and adjacent savanna vegetation as well as of similar variability between termite-mound vegetation and adjacent savanna vegetation along a climatic gradient. However, mound vegetation was not shown to be more diverse at all of our sites, which we attribute partly to certain traits of the indicator plant species on the termite mounds addressed in this study.
Gradient analysis
We found that the mound and savanna plots formed separate groups along the second DCA axis: mound vegetation differed considerably from the surrounding savanna along the entire climatic gradient. This finding is in accord with those of a wide range of studies reporting mound vegetation to be distinct from savanna vegetation (Fanshawe Reference FANSHAWE1968, Malaisse Reference MALAISSE, Miège and Stork1976, Schmitz Reference SCHMITZ1963).
The higher cation concentrations of mound soils compared with the surroundings can be considered an explanation for pronounced differences between mound and savanna vegetation. Nutrient levels and exchangeable cation concentrations have already been described as higher in termite mounds than in surrounding soils (Holt & Lepage Reference HOLT, LEPAGE, Abe, Bignell and Higashi2000, Jouquet et al. Reference JOUQUET, TRAORE, CHOOSAI, HARTMANN and BIGNELL2011). We hypothesize that biopedoturbation, particularly the selection and transport of base-rich soil of the silt and clay fraction from deeper layers to the surface, as described by other authors (Abe et al. Reference ABE, YAMAMOTO and WAKATSUKI2009, Arshad Reference ARSHAD1982, Mujinya et al. Reference MUJINYA, VAN RANST, VERDOODT, BAERT and NGONGO2010), is crucial for the specific vegetation on termite mounds and represents a driving factor of general small-scale heterogeneity in African savannas. On a local scale, various studies report lower infiltration rates, but higher water availability on mounds (Dangerfield et al. Reference DANGERFIELD, MCCARTHY and ELLERY1998, Sileshi et al. Reference SILESHI, ARSHAD, KONATE and NKUNIKA2010). It has been suggested that the existence of mounds allows colonization of a savanna by forest species and that the termite-mound vegetation in a particular vegetation zone is adapted to the conditions of a more humid vegetation zone (Bloesch Reference BLOESCH2008, Cole Reference COLE1963). However, our regional analysis showed that vegetation differentiation can be attributed mainly to differences in MAP along a climatic gradient. Moreover, the observed changes on mounds were as pronounced as in the savanna matrix.
Diversity analysis
Overall species richness did not differ between termite mounds and the adjacent savanna vegetation. However, we found differences in the shape of the species-accumulation curves considering woody species and the vegetation including herbaceous species. High local heterogeneity in herbaceous vegetation of the paired mound and savanna plots leads to lower slopes for these plots. The surprisingly low species richness of the sampling in Pendjari National Park (PNP) might be considered a sampling artefact, as the majority of sites in PNP could not be visited during the wet season due to flooding. Also, local outcompeting of other species by herbaceous plants with higher productivity could be an explanation, which is supported by the species accumulation curve for 30 × 30-m woody-plant savanna plots. However, (also temporally) paired sampling allows for a direct comparison of net compositional differences between mounds and savannas, quite irrespective of differences in sampling time, or differences in the size of different plot-pairs. Net differences of species richness expressed as log response ratio showed no correlation with plot area. In this study, species richness was not found to be significantly higher on mounds when the whole dataset was considered, but even significantly lower on mounds in Gonsé Classified Forest (FCG). Higher plant diversity on mounds than in the surrounding savanna has been reported in several studies, especially for woody plants (Moe et al. Reference MOE, MOBAEK and NARMO2009, Traoré et al. Reference TRAORÉ, NYGÅRD, GUINKO and LEPAGE2008a). Considering woody layers alone, mound richness in FCG was no longer significantly lower, while both species richness and inverse Simpson's Index were still higher on mounds at W Transborder Park (PNW) and Pendjari National Park. FCG and FCN are considerably smaller than PNP and PNW, and are classified as forest reserves under higher anthropogenic pressure. FCG in particular, which is situated close to the Burkina Faso metropolis of Ouagadougou, is subject to a moderate but ongoing disturbance regime. As synanthropic herbaceous species contributed to the species richness at this site, disturbance might also explain why the overall species richness peaked here, in accordance with the intermediate disturbance hypothesis (Connell Reference CONNELL1978, Huston Reference HUSTON1979).
The increase in precipitation from north to south leads to an increasing share of phanerophytic life forms in the local flora (Schmidt et al. Reference SCHMIDT, KREFT, THIOMBIANO and ZIZKA2005). Enhanced woody plant establishment rates on mounds (Fleming & Loveridge Reference FLEMING and LOVERIDGE2003, Traoré et al. Reference TRAORÉ, TIGABU, OUEDRAOGO, BOUSSIM, GUINKO and LEPAGE2008b) could explain the considerably higher species richness and inverse Simpson's Index of Diversity on mounds at higher precipitation. Furthermore, separate treatment of vegetation layers is important, not only due to their phytosociological independence (Hahn-Hadjali Reference HAHN-HADJALI1998), but also because of the influence of canopy density. Shading by species with a long foliage period as well as a pronounced occurrence of climbers characterizes mound communities. A single specimen can often present a high cover value on a mound. In our dataset, for instance, single adult tamarind trees exhibited cover values of up to 90% per plot, shading out the herbaceous layer and thus lowering overall diversity.
However, diversity patterns may also be influenced by taxon-specific differences in mound architecture. Within the research area, Macrotermes subhyalinus is better able to cope with drier environmental conditions than M. bellicosus. Both species are subject to the same environmental constraint regarding homoeostasis of their obligate fungi symbionts, but their mound architecture is different (Korb Reference KORB, Bignell, Roisin and Lo2011). Different architecture might fundamentally influence the ability of plants to become established on mounds. The locations and concentrations of nutrients in mounds differ between species and genera of termites (Wood Reference WOOD1988, Wood & Sands Reference WOOD, SANDS and Brian1978), and we can expect that further differences between the two Macrotermes species will be detected. However, we could not test this assumption because severely eroded Macrotermes mounds could not be attributed to a particular species.
Indicator species analysis
The identified indicator plant species exhibited different functional traits that might be related to their frequent and abundant occurrence on mounds. All species reaching significant indicator values >60% are ligneous or subligneous perennials. A large proportion presents scrambling or climbing habits, i.e. Capparis sepiaria, Wissadula amplissima, Grewia bicolor, Ampelocissus multistriata, Asparagus flagellaris and Combretum aculeatum. The preference of indicator species for termite-mound microhabitats might be due to several benefits associated with the mounds, e.g. favourable soil conditions, accessible ground water and a certain degree of protection from fire. The higher number of characteristic mound plant species in areas with greater precipitation may be related to increases in overall woody species richness (Schmidt et al. Reference SCHMIDT, KREFT, THIOMBIANO and ZIZKA2005).
Termite mounds have often been recognized as refuges for woody plants within seasonally burned savannas (Fanshawe Reference FANSHAWE1968, Joseph et al. Reference JOSEPH, CUMMING, CUMMING, MAHLANGU, ALTWEGG and SEYMOUR2011, Traoré et al. Reference TRAORÉ, TIGABU, OUEDRAOGO, BOUSSIM, GUINKO and LEPAGE2008b, Troll Reference TROLL, Louis and Panzer1936). Specifically, plants with evergreen leaves (as the Capparaceae indicator species) are sensitive to burning. A previous study (Colonval-Elenkov & Malaisse Reference COLONVAL-ELENKOV and MALAISSE1975) specifically described the xerophytic features of termite mound vegetation in a Miombo savanna woodland.
However, the sclerophyllous Capparis sepiaria exhibited the deepest roots in a study of termite-mound-thicket root distribution in Ghana (Okali et al. Reference OKALI, HALL and LAWSON1973), and showed high rates of transpiration in a study of mound microclimate (Lawson & Jenik Reference LAWSON and JENIK1967). We assume that the characteristic Capparaceae species included in our study develop deep roots as well. Dependency on continuous access to ground water can also be assumed for Feretia apodanthera (also found in gallery forests and transient watercourses).
Shading and vertical structure provided by woody vegetation could favour lianescent species as well as mesophytic species in the understorey. Lianas are a life-form that is especially adapted to compete for light, and because these plants depend on available water, they develop deep roots (DeWalt et al. Reference DEWALT, SCHNITZER, CHAVE, BONGERS, BURNHAM, CAI, CHUYONG, CLARK, EWANGO, GERWING, GORTAIRE, HART, IBARRA-MANRIQUEZ, ICKES, KENFACK, MACIA, MAKANA, MARTINEZ-RAMOS, MASCARO, MOSES, MULLER-LANDAU, PARREN, PARTHASARATHY, PEREZ-SALICRUP, PUTZ, ROMERO-SALTOS and THOMAS2009). In several instances in the present study, a single shade-tolerant species, such as Wissadula amplissima, comprised the herbaceous cover as a result of forming monotypic stands. The mound microhabitats provide a wide range of benefits for other groups of organisms, such as birds (Joseph et al. Reference JOSEPH, CUMMING, CUMMING, MAHLANGU, ALTWEGG and SEYMOUR2011), large herbivores (Levick et al. Reference LEVICK, ASNER, KENNEDY-BOWDOIN and KNAPP2010, Okullo & Moe Reference OKULLO and MOE2012b), small vertebrates (Fleming & Loveridge Reference FLEMING and LOVERIDGE2003), insects and other invertebrates, and their predators (De Visser et al. Reference DE VISSER, FREYMANN and SCHNYDER2008, Pringle et al. Reference PRINGLE, DOAK, BRODY, JOCQUÉ and PALMER2010).The identification of characteristic plant species associated with mounds gives a starting point for subsequent studies of their functional traits and biology, also addressing their role as resources for both the human population and for wildlife in West African savannas. Only recently, a first study from a single reserve in South Africa reported differences in functional traits of plants on and off mounds (van der Plas et al. Reference VAN DER PLAS, HOWISON, REINDERS, FOKKEMA and OLFF2012, in press). Our account of some functional characteristics can be a precursor to similar analyses in West Africa.
Unfortunately, processes of succession in these de novo microhabitats as well as their role in the long-term dynamics of savanna ecosystems remain unclear, as long-term studies are lacking.
Additionally, the population dynamics of mound vegetation in landscapes undergoing rapid land-use changes, as are occurring in West African savannas (Reij et al. Reference REIJ, TAPPAN and BELEMVIRE2005, Tappan et al. Reference TAPPAN, SALL, WOOD and CUSHING2004, Vincke et al. Reference VINCKE, DIÉDHIOU and GROUZIS2010), remain unaddressed. It is likely that the termite abundance, thus the termite-mound abundance outside of protected areas, will further decline. We would like to specifically encourage ongoing research on and the protection of viable mound-building termite populations and vegetation on mounds to elucidate the degree of interdependence of mounds and plants.
ACKNOWLEDGEMENTS
We are grateful to Prof. Dr. Brice Sinsin, University of Abomey-Calavi (Benin) and his group for their cooperation and support. We are also grateful to the national, regional and local authorities in charge of protected areas in Burkina Faso and Benin for issuing research permits and the endorsement of our work. Judith Korb and collaborators very kindly helped with termite species identification. The Institute of Physical Geography, University of Frankfurt, kindly provided help in soil analysis. We thank Kate Parr for the helpful and very constructive comments on an earlier version of the manuscript, and Ian Turner and the anonymous referees of JTE for their much valued input on the current paper. This study was funded as part of BIOTA West Africa (support code 01LC0617D1, Federal Ministry of Science and Education, Germany, www.biota-africa.org). We also thank the ‘LOEWE Program’ (Landes-Offensive zur Entwicklung Wissenschaftlich-ökonomischer Exzellenz) of the State of Hesse (Germany) for their financial support of the Biodiversity and Climate Research Centre (BiK-F).
Appendix 1. Research sites, mean annual precipitation (MAP) and number of mound/savanna plot pairs for each site per sampled savanna type. Vegetation zones according to White (Reference WHITE1983). Tiger bush is a vegetation type composed of alternating, densely vegetated bands and bare areas parallel to the contour.


