


INTRODUCTION
The use of stable isotope ratios of hydrogen (δD) in animal ecology studies has grown significantly in the previous decade. Animal tissues generally reflect precipitation δD values of the geographic area where they were synthesized, and can be used to trace spatial movements (Hobson Reference HOBSON, Hobson and Wassenaar2008, Hobson & Wassenaar Reference HOBSON and WASSENAAR1997). Geographic resolution of δD can be broad (tens of degrees of latitude/longitude, or several hundred metres in altitude; Farmer et al. Reference FARMER, CADE and TORRES-DOWDAL2008, Hardesty & Fraser Reference HARDESTY and FRASER2010), imposing limits on the scale at which animal movements may be tracked. Many questions remain regarding factors driving variation of δD within populations (Betini et al. Reference BETINI, HOBSON, WASSENAAR and NORRIS2009, Hobson Reference HOBSON, Hobson and Wassenaar2008, Langin et al. Reference LANGIN, REUDINK, MARRA, NORRIS, KYSER and RATCLIFFE2007, Powell & Hobson Reference POWELL and HOBSON2006), which in some cases can preclude tracking of movement at any scale (Rocque et al. Reference ROCQUE, BEN-DAVID, BARRY and WINKER2006, Wunder et al. Reference WUNDER, KESTER, KNOPF and RYE2005).
Small-scale spatial or temporal differences in source moisture and food-web δD may exert an influence on animal tissue values (Betini et al. Reference BETINI, HOBSON, WASSENAAR and NORRIS2009, Fraser et al. Reference FRASER, McKINNON and DIAMOND2010). A spatial model and temporal variation in rainfall patterns best explained variation in feather δD within a single population of the wood thrush (Hylocichla mustelina) (Powell & Hobson Reference POWELL and HOBSON2006) and spatially stratified insect prey values were a significant predictor of tree swallow (Tachycineta bicolor) nestling blood δD values (Betini et al. Reference BETINI, HOBSON, WASSENAAR and NORRIS2009). Hydrological studies support the notion that δD may vary at small spatial scales in terrestrial ecosystems. Soil moisture in rain forest may become significantly enriched in deuterium in the dry season relative to precipitation and groundwater due to the influence of evaporative and fog drip cycles (Liu et al. Reference LIU, LIU, LI, GAO, SHEN, WANG, ZHANG and LI2007). Despite the potential value of these patterns for tracking spatial and temporal resource use, there have been few direct tests of the influence of seasonal and microgeographical hydrological effects on δD in animal tissues.
Physiology may also influence δD tissue values. Birchall et al. (Reference BIRCHALL, O'CONNELL, HEATON and HEDGES2005) found that animals feeding at a higher trophic level had significantly higher δD. Similarly, Fraser et al. (Reference FRASER, McKINNON and DIAMOND2010) suggested that enriched δD in sanguinivorous bats may have been driven by a biomagnification effect. Other than the study by Birchall et al. (Reference BIRCHALL, O'CONNELL, HEATON and HEDGES2005), there have been no direct tests of trophic effects on δD values in animal tissues (Hobson Reference HOBSON, Hobson and Wassenaar2008, Martínez del Rio et al. Reference MARTÍNEZ DEL RIO, WOLF, CARLETON and GANNES2009).
We tested spatio-temporal and physiological hypotheses to explain variation in δD tissue values (claws and feathers) of 22 resident bird species in a Nicaraguan cloud forest. We examined the microgeographic effects of foraging on the forest floor versus foraging above the ground, and foraging within the forest versus in adjacent coffee plantation on δD in bird tissues. Considering the influence of evaporation and fog drip on forest soil moisture δD (Liu et al. Reference LIU, LIU, LI, GAO, SHEN, WANG, ZHANG and LI2007), we predicted that birds foraging on the ground in the forest interior would have significantly higher δD tissue values than those foraging above the ground and in adjacent open areas (coffee plantation). For temporal effects on δD, we expected that claw values would be significantly correlated with sampling date. Claws grow continuously and thus may incorporate temporal changes in food web δD. Most birds moult tail feathers once annually (Pyle Reference PYLE1997), and considering annual differences in precipitation δD (Hardesty & Fraser Reference HARDESTY and FRASER2010, http://isohis.iaea.org), we predicted that year would be a significant factor influencing feather δD. For the trophic-level hypothesis (Birchall et al. Reference BIRCHALL, O'CONNELL, HEATON and HEDGES2005), we predicted that birds feeding at a higher trophic level (reflected by δ15N values) would show higher δD tissue values.
METHODS
Field methods
Birds were sampled at three different locations in the Cordillera Isabella, Nicaragua. These were the Finca y Reserva Silvestre Privada Nebliselva El Jaguar (Farm and Private Reserve El Jaguar Cloud Forest, hereafter ‘El Jaguar’) (1350 m asl; 13°10′ N, 86°02′ W), Datanli-el Diablo Natural Reserve (1390 m asl, 13° 7’ N, 85° 55’ W, hereafter ‘Datanli’), and Reserva Natural Sierra Quirragua (500–1300 m asl, 12°50′ N, 85°27′ W, hereafter ‘Quirragua’). All three sampling sites are lower montane forest and incorporate primary and secondary forest as well as, in the case of El Jaguar and Datanli, organic shaded coffee plantations. At the first two sites, sampling efforts were divided between plantation and adjacent forest. In order to examine isotopic patterns in a whole community of cloud-forest birds, we sampled all birds captured at El Jaguar and Datanli for this study. Samples were collected opportunistically from the long-tailed manakin (Chiroxiphia linearis) at Quirragua during another species-specific study. For more details on the capture locations see Fraser et al. (Reference FRASER, McKINNON and DIAMOND2010) and Martínez Salinas (Reference MARTÍNEZ SALINAS2008).
Birds were captured using two to 27 mistnets (12 × 2.5 m, 36- or 30-mm mesh). Nets were set up at roughly 50-m intervals along trails and checked every 40 min. At El Jaguar, during 2-d mist-netting bouts, samples were collected in most months between December 2007 and September 2009 (with the exceptions of January, February and April 2008 and March, April, June and July 2009). Birds at Datanli were sampled in March 2008 and at Quirragua between February and April in 2007. A tail feather (third retrix, ‘R3’) and two claw clippings (1–3 mm depending upon species, middle claw of both feet) were collected and stored in paper envelopes until analysis. All birds, with the exception of hummingbirds, were ringed. The chances of re-sampling an unringed hummingbird were low, as trapping effort was rotated between areas and short-term recaptures at a particular site could be identified by evidence of sampling (missing R3 and blunt claws lasting ~2–4 mo). All data collected in the field followed protocols outlined by Monitoreo de Sobrevivencia Invernal (De Sante et al. Reference DE SANTE, SARACCO, DE VIVAR ALVAREZ and MORALES2009).
Rain water was collected in 500-ml open-mouthed, polypropylene bottles, covered with screen and with 1 cm of mineral oil in the bottom (to prevent water evaporation) (http://water.usgs.gov./nrp/proj.bib/hawaii/precip_methods.htm). Two of these receptacles were secured off the ground, away from overhanging vegetation, in the coffee plantation at El Jaguar only. Every month, 5 ml of water was extracted and deposited in a sealed, polypropylene bottle using a syringe and the remaining water was discarded. We collected rainwater in 2009 to compare to that collected at the same location in 2008 (presented in Fraser et al. Reference FRASER, McKINNON and DIAMOND2010). Models of precipitation δD based on long-term (40 y) growing-season means weighted by amount and corrected for altitude can be powerful tools for determining locally expected animal tissue values (Bowen et al. Reference BOWEN, WASSENAAR and HOBSON2005). However, moisture contributed to the food web in this study likely comes from both precipitation and fog. Both of these sources were likely captured in our year-round sampling. We did not weight these sources by amount contribution as these moisture sources may have varying spatial influence within our study area. Rather, we present these values as an indicator of the range of moisture δD that is contributed to the study area over an annual cycle. We also collected two forest spring-water samples in early March 2008 (end of dry season) at El Jaguar.
We collected small fleshy fruits of a size (1–3 cm) commonly consumed by small (< 100g) frugivores (Moermond & Denslow Reference MOERMOND and DENSLOW1985) opportunistically during netting bouts in 2008 at El Jaguar. We also collected arthropods from the leaf litter and vegetation within the height of mist nets during the same period. We searched for fruit and arthropods and sampled items as encountered (an approximation of bird foraging methods). Within 24 h of collection, arthropod and fruit samples were dried in an oven at 60 °C for 24 h and then stored at room temperature until analysis.
Laboratory methods
Stable-isotope analyses of all bird tissues were performed at the Stable Isotopes in Nature Laboratory (SINLAB) at the University of New Brunswick. Claws and feathers were washed to remove lipids and particles in a 2 : 1 chloroform : methanol solution for 24 h and left to air dry. Feather samples were prepared by cutting from the distal end with dissection scissors. As values may differ slightly along the length of a single feather (Wassenaar & Hobson Reference WASSENAAR and HOBSON2006), we prepared only the tip of each feather for analysis. Claw samples were included whole, or were trimmed from the proximal end to reach optimal target weight. Fruit and arthropods were ground using mortar and pestle.
Stable-hydrogen isotope analysis. In order to account for potential air-tissue H exchange, we use a comparative equilibration technique with standards of known hydrogen isotope ratios (Wassenaar Reference WASSENAAR, Hobson and Wassenaar2008, Wassenaar & Hobson Reference WASSENAAR and HOBSON2000, Reference WASSENAAR and HOBSON2003). Three standards (Bowhead Whale Baleen (BWB), Cow Hoof (CHS), and Chicken Feather (CFS)) were weighed into silver capsules at approximately 0.18–0.2 mg alongside samples and allowed to freely equilibrate with local water vapour for a minimum of 72 h. Samples and standards were then loaded into a zero blank autosampler. After pyrolysis in a High Temperature Conversion/Elemental Analyzer (TC/EA) and analysis in a Thermo Finnigan Delta XP mass spectrometer, all values were adjusted to bring BWB, CHS and CFS to δD values of −108‰, −187‰ and −147‰ respectively (Wassenaar Reference WASSENAAR, Hobson and Wassenaar2008, Wassenaar & Hobson Reference WASSENAAR and HOBSON2000, Reference WASSENAAR and HOBSON2003). This technique adjusts all values relative to the Vienna Standard Mean Ocean Water (VSMOW) scale. To estimate analytical precision across runs, an internal laboratory keratin standard (unhomogenized feathers of one individual clay-coloured thrush, Turdus grayi) was used which yielded mean values of −48‰ ± 4‰. Replicate feather and claw samples within runs varied by < 5‰. Rainwater samples were analysed at Environment Canada's Stable Isotope Hydrology and Ecology Laboratory in Saskatchewan (Wassenaar & Hendry Reference WASSENAAR and HENDRY2008).
Stable-nitrogen isotope analysis. Feathers and claws were weighed to 0.2 ± 0.02 mg into tin capsules. All samples were then combusted in a Carlo Erba NC2500 elemental analyser. Resultant gases (CO2 and N2) were delivered via continuous flow to a Finnigan Mat Delta Plus isotope ratio mass spectrometer and were analysed for isotopes of nitrogen and carbon. Data were brought to an international scale using commercially available and in-house standards (nicotinamide, BLS and SMB) that were calibrated using International Atomic Energy Association standards CH6 (−10.4‰), CH7 (−31.8‰), N1 (0.4‰), N2 (20.3‰). Analytical precision across runs was determined using the same internal standard as for hydrogen analyses (clay-coloured thrush feathers). This standard yielded nitrogen isotope values of 9.8‰ ± 2.3‰. Replicate samples within runs varied by < 0.25‰.
Statistical analysis
For data exploration, we followed protocols outlined in Zuur et al. (Reference ZUUR, IENO and ELPHICK2010) and Zuur et al. (Reference ZUUR, IENO, WALKER, SAVELIEV and SMITH2009) where we tested for outliers and collinearity of explanatory variables. Based on the available literature and our own pilot studies, we chose a suite of explanatory variables for their potential effect on δD tissue values. These variables included species, trophic level, habitat use (forest interior or exterior), foraging level (forest understorey versus overstorey), sampling date and year. These variables are described in Table 1. The effect of chosen explanatory variables on δD in feathers was explored using general linear models (GLM). For claws, scatterplots of δD against sampling date suggested a curvilinear relationship and that the application of a linear model was inappropriate. Such a relationship could also be anticipated a priori, as values of claws collected in January may be like those collected in December due to slow isotopic turnover in this tissue-type, but these values would be plotted at opposite ends in a scatterplot potentially contributing to a non-linear pattern. Therefore, for claws, we used a generalized additive model (GAM). To rank models, we used Akaike's Information Criterion with a correction for small sample size (Burnham & Anderson Reference BURNHAM and ANDERSON2002). We evaluated models where each variable was independent as well as all two-way interactions. Models were run separately for claws and feathers as these two tissues reflect different temporal periods of integration. Claws reflect a period of integration of 2–5 mo (Bearhop et al. Reference BEARHOP, FURNESS, HILTON, VOTIER and WALDRON2003, Carleton et al. Reference CARLETON, KELLY, ANDERSON-SPRECHER and MARTÍNEZ DEL RIO2008, Fraser et al. Reference FRASER, KYSER, ROBERTSON and RATCLIFFE2008, Fraser unpubl. data). Individual tail feathers grow over a period of 20–25 d (Grubb & Pravosudov Reference GRUBB and PRAVOSUDOV1994) and reflect foraging around the time of moult (Hobson & Wassenaar Reference HOBSON and WASSENAAR1997). After ranking models, we conducted significance testing of the best model and each main-effect term with alpha = 0.05. We compared fruit and arthropod samples in open versus closed habitats (t-test). We also conducted significance testing of both claws and feathers of understorey versus overstorey and interior versus exterior forest (t-test) and claw versus tail feather values for each species (paired t-test). The relationship between δD and trophic level, as well as claw δD and sampling date, were compared using linear regression. All analyses were conducted using R (version 2.11.1).
Table 1. Description of model variables examined to explain feather and claw δD values of a Nicaraguan Neotropical forest bird community using general linear models (GLM) and general additive models (GAM).

RESULTS
Water and prey results
Rainwater δD values varied widely over the course of both years but followed a similar pattern, with lower values obtained in the wet season (May–November) and higher values in the dry season (December–April) (Figure 1). δD values varied from −46.5‰ to 11.5‰ between March 2007 and February 2008 (Fraser et al. Reference FRASER, McKINNON and DIAMOND2010) and between −131‰ and 3.51‰ between March 2008 and February 2009. Mean inter-annual δD varied by 14‰; however, yearly comparisons were not significantly different (t-test, t = 1.63, df = 32.9, P = 0.113). Spring-water samples collected at the end of the dry season (early March 2008) yielded values of −41‰ and −54‰. Arthropods of five orders were sampled (Araneae, Coleoptera, Hemiptera, Lepidoptera, Orthoptera). Arthropod prey values (N = 24) ranged from −160‰ to −58.7‰ and fruit (N = 52) ranged from −136‰ to 10.1‰. Arthropods and fruit collected in the study area differed significantly in δD (t-test, t = −5.64, df = 45.9, P < 0.0001) (Figure 2). Arthropods collected inside and outside the forest also differed significantly (t-test, t = 6.06, df = 16.9, P < 0.0001), and fruit samples approached significance (t-test, t = 2.0, df = 32.0, P = 0.05), (Figure 2). Only fruit samples collected in the forest had values greater than −40‰ (six observations).

Figure 1. Monthly δD rainwater values for the Nicaraguan cloud forest study site from March 2007 to February 2008 (solid line, from Fraser et al. Reference FRASER, McKINNON and DIAMOND2010) and March 2008 to February 2009 (dashed line, this study). These values incorporate the influence of both precipitation and fog derived from evapotranspired moisture.

Figure 2. Comparisons of δD in potential prey of Nicaraguan cloud-forest birds. Closed circles indicate arthropod values, open circles indicate fruit values. δD values were significantly different for arthropods and fruit (t-test, t = −5.64, df = 46, P < 0.0001). Arthropod values were significantly different between samples collected inside and outside the forest (t-test, t = 6.06, df = 17, P < 0.0001) and fruit samples approached significance (t-test, t = 2.0, df = 32, P = 0.05). Plots show mean and ± SD.
Bird and model results
We sampled 211 individual birds of 22 species. Mean claw δD values (and SD) among species varied from −83.2‰ ± 4.21‰ to −19.2‰ ± 14.5‰ and feather values ranged from −80.5‰ ± 7.67‰ to −24.2‰ ± 0.13‰ (Table 2). Claw values were higher than tail feather values in most cases and, where sample size permitted paired tests, these differences were significant for six of seven species (Table 2). The most parsimonious model to explain δD variation in claws included foraging level (ground vs. above ground), foraging location (forest interior vs. exterior), sampling date, an interaction between foraging level and species and trophic position (δ15 N). This model carried 56.7% of the AICc weights in claw δD (Table 3). The second-best claw model included foraging location, an interaction between foraging level and sampling date, an interaction between foraging level, species and trophic position. This model carried 43.1% of the AICc weights. The best AIC model of feather δD included foraging level, foraging location, trophic-level position and species and carried 52% of the AICc weights (Table 3). The second-best model included year in addition to factors in the first model and carried 42.8% of the AICc weights. All variables in top claw and feather models were significant with the exception of trophic position for the claw model which approached significance (Tables 4, 5). Claw and feather δD values of ground foragers were higher (mean ± SD: claws = −30‰ ± 15‰; feathers = −60‰ ± 13‰) than overstorey values (mean ± SD: claws = −50‰ ± 15‰; feathers = −70‰ ± 12‰) and differed significantly (t-test, claws: t = 5.16, df = 67, P < 0.0001; feathers: t = 4.87, df = 95, P < 0.0001) (Figure 3). Using species means for comparisons, δD of claws and feathers were higher for understorey foragers, but these were significant only for claws (t-test, claws: t = 2.49, df = 13, P < 0.0271; feathers: t = 1.35, df = 13.25, P = 0.20). δD of claws tended to be higher in the forest interior but comparisons were not significant using individuals (t-test, claws: t = 1.52, df = 21, P = 0.144; feathers: t = 1.44, df = 55, P = 0.155) or species means (t-test, claws: t = 1.86, df = 5, P = 0.119; feathers: t = 1.85, df = 10, P = 0.092) (Figure 3). Claw δD correlated with sampling date (Figure 4a). δD of claws and feathers was more positive in birds at a higher trophic position, although trophic position explained little of the variation (claws: R2 = 0.09, F = 6.9, P < 0.0106, feathers: R2 = 0.0388, F = 8.4, P < 0.0041) (Figure 4b, c).
Table 2. Species included in the study as well as sample size (N) and mean (± SD) δD values (‰) for claws and feathers of Nicaraguan cloud-forest birds. Species (American Ornithologists’ Union 1998) are ordered from those with the lowest to highest tail-feather δD values. P-values are results of a paired t-test comparing claws and feathers of each species (the smaller N denotes sample size for paired tests). Based upon observations at the study site and Stiles & Skutch (Reference STILES and SKUTCH1989), species were categorized by foraging level (ground versus overstorey; G and O) and foraging location (forest interior versus exterior; I and E).

Table 3. Akaike's Information Criterion for top four competing generalized additive models (GAM) used to explain variation in claw δD (n = 69, 18 species) and four general linear models (GLM) used to explain variation in tail feather (n = 211, 22 species) δD. Models were ranked using Akaike's Information Criterion corrected for small sample size (AICc). ΔAICc is the difference between a model and the model with the lowest AICc; AICw is Akaike weight.

Table 4. Results of the most parsimonious generalized additive model (GAM) to describe variation in δD values in claws (n = 69, df = degrees of freedom, edf = estimated degrees of freedom).
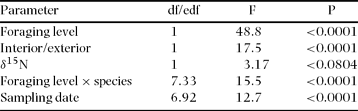
Table 5. Results of the most parsimonious general linear model (GLM) to describe variation in δD values in feathers (n = 211). Feathers of ground foraging and interior forest birds exhibited higher values than overstorey foragers and exterior forest birds.


Figure 3. Comparisons of claws and feathers of ground vs. above-ground foragers and forest-interior vs. exterior foragers in Nicaraguan cloud-forest study sites. Closed circles indicate feather values, open circles indicate claw values. Claws and feathers of ground foragers differed significantly from above-ground foragers (t-test, t = 5.16, df = 67, P < 0.0001; t = 4.87, df = 95, P < 0.0001). Claws and feathers of forest-interior foragers did not differ significantly from forest-exterior foragers (t-test, t = 1.52, df = 21, P = 0.144; t = 1.44, df = 55, P = 0.155). Plots show mean ± SD.

Figure 4. Plots of three explanatory variables retained in the best models used to explain variation in claw and feather δD, (a) plot of the relationship between claw δD and sampling date (fitted line reflects smoothing function in the optimal GAM) and (b) plot of the relationship between claw δD and δ15N (R2 = 0.09, F = 6.9, P < 0.0106), (c) plot of the relationship between feather δD and δ15 N (R2 = 0.0388, F = 8.4, P < 0.0041).
DISCUSSION
Consistent with hypotheses proposed to explain variation in δD of animal tissues, we found that microgeographic and temporal effects, trophic level and species significantly influenced δD values in Neotropical bird tissues. Our best claw and feather models suggest there are multiple effects influencing claw- and feather-tissue δD.
In both the best claw and feather models, foraging level (forest floor or above) and foraging location (interior forest versus exterior coffee plantation/open scrub) were significant predictors of δD values. Birds that commonly forage in forest leaf litter tended to have the highest claw and feather values. This suggests sources of moisture available to the food web of these birds were higher in δD than those encountered by birds foraging above ground, and in the coffee plantation. Direct comparisons of understorey versus overstorey feathers and claws show that values differ significantly at a micro-spatial scale but these differences were more consistent using claws. These results suggest a future application of δD to track vertical movement and habitat use in cloud-forest species. While forest-interior feather and claw δD values tended to be higher than those sampled outside the forest, direct comparisons were not significant. These results may reflect an overlap in habitat use between species considered forest-interior species or use of forested habitats by birds usually associated with more open habitats. Further, species-specific work and the use of other isotopes may permit future resolution and tracking of interior-forest versus open-habitat use. Ratios of stable-carbon isotopes vary between wet forest and dry, open habitats (Marra et al. Reference MARRA, HOBSON and HOLMES1998) and could be used in combination with δD for this purpose. Such an investigation may yield important insights into seasonal habitat use and current classification of species based on habitat associations.
Species that dwell exclusively in the humid forest understorey and forage on the ground such as the Catharus mexicanus (Table 2) and Grallaria guatimalensis (Stiles & Skutch Reference STILES and SKUTCH1989) had tissue values higher than −20‰. Hydrological studies show that δD values become higher with evapotranspiration and repeated evaporation and condensation of the same water source produces increasingly higher values (Lachniet & Patterson Reference LACHNIET and PATTERSON2002). These effects may be particularly prevalent within tropical rain forest, where evaporated moisture, falling as fog drip within the forest, is higher in δD than precipitation or groundwater. Most fog drip occurs in the dry season (as much as 86%; Liu et al. Reference LIU, MENG, ZHANG, LIU and LI2004), when it contains more recycled moisture and contributes to a significant δD increase of soil moisture (Liu et al. Reference LIU, LIU, LI, GAO, SHEN, WANG, ZHANG and LI2007). This provides a strong explanation for the patterns of claw deuterium enrichment that we observed, particularly in forest understorey species. Considering that claws may reflect 2–5 mo of integration time, dependent upon species (Bearhop et al. Reference BEARHOP, FURNESS, HILTON, VOTIER and WALDRON2003, Carleton et al. Reference CARLETON, KELLY, ANDERSON-SPRECHER and MARTÍNEZ DEL RIO2008, Fraser et al. Reference FRASER, KYSER, ROBERTSON and RATCLIFFE2008, Fraser unpubl. data), and that the dry season lasts for 4 mo (December–March), it is not surprising that some understorey species retain higher claw values (> −30‰) throughout the year. Similar patterns of deuterium enrichment have been found in the tissues of forest understorey birds in Belize and the Dominican Republic (K. C. Fraser unpubl. data, J. Nocera, unpubl. data).
In the wet season, soil moisture δD values are more influenced by precipitation and thus become more depleted in the heavier isotope (Liu et al. Reference LIU, ZHANG, LI and LIU2005). This is the season when most species in this study moult their tail feathers (L. Chavarría unpubl. data). Our precipitation data show that values are much more depleted in deuterium in the period leading up to, and during moult. This may explain why eight out of 13 species, including understorey species, exhibited feather δD values that were significantly lower than claws. For example, mean Catharus mexicanus claw values were −19.2% ±14.5‰ whereas feathers were −59.2% ±11.9‰.
We can rule out groundwater sources as directly providing enriched baseline δD to the forest food web, as analysis of spring water yielded values less than −40‰ and groundwater sources show less seasonal variability and are recharged primarily by precipitation and not by evapotranspiration and recycled water sources (Liu et al. Reference LIU, ZHANG, LI and LIU2005). Temperature may also influence δD values, in that greater temperatures increase evapotranspiration and subsequently enrich animal tissue δD (Betini et al. Reference BETINI, HOBSON, WASSENAAR and NORRIS2009, McKechnie et al. Reference MCKECHNIE, WOLF and MARTÍNEZ DEL RIO2004). However, we may also rule out temperature as the driver of the enriched values in forest understorey birds, as this habitat is buffered from radiative heat and experiences cooler daytime temperatures as compared to the adjacent open, coffee plantation (K. Fraser pers. obs.).
Our study was not designed to exhaustively sample potential prey types and their location within and outside the forest. The grouping of multiple types of arthropods and plants into broad categories (e.g. forest interior versus exterior) is admittedly coarse. Thus, our results comparing these factors should be seen as preliminary. However, the initial patterns shown in prey, which are mirrored in the larger sample for the birds, suggest that there may be inherent differences in δD at smaller spatial scales than has previously been reported. Both arthropod and plant prey collected in the forest interior tended to be higher in δD than prey collected in the open, coffee plantation and scrub areas. These patterns should be explored in greater detail in future studies.
Our results regarding the effect of trophic level (δ15 N) on δD are consistent with previous studies, where carnivores reportedly have higher δD values than herbivores (Birchall et al. Reference BIRCHALL, O'CONNELL, HEATON and HEDGES2005, Fraser et al. Reference FRASER, McKINNON and DIAMOND2010). For example, species in our study with the most positive δD feather values are reported to feed on arthropods and small vertebrates (Grallaria guatimalensis, Laniocera rufescens, Xiphorhynchus erythropygius, Dendrocincla homochroa; Stiles & Skutch Reference STILES and SKUTCH1989). These species also had δ15 N values consistent with an arthropod diet (Fraser et al. unpubl. data). The potential biomagnification effect that we observe here has not been tested in controlled laboratory experiments (Hobson Reference HOBSON, Hobson and Wassenaar2008, Martinez del Rio et al. Reference MARTÍNEZ DEL RIO, WOLF, CARLETON and GANNES2009), thus the mechanism for such an effect remains unexplained. Several of the insectivorous species in our study exhibited δD tissue values higher than arthropod, fruit or collected precipitation values. Alternatively, the link between high δ15 N and δD values may have been driven by other factors. In a study of spatial structure of δ15 N in a tropical rain forest, δ15 N values in soil were significantly higher than in canopy leaves (Hyodo et al. Reference HYODO, MATSUMOTO, TAKEMATSU, KAMOI, FUKUDA, NAKAGAWA and ITIOKA2010). Higher soil δ15N could influence the food web of ground-foraging birds. Considering that we found a link between ground foraging in the forest and higher δD, this interaction could have driven the inclusion of δ15N in the best feather model. Such an effect may also explain higher δD values in sanguinivorous bats as compared with frugivores and nectarivores (Fraser et al. Reference FRASER, McKINNON and DIAMOND2010). The common vampire bat (Desmodus rotundus) in Fraser et al. (Reference FRASER, McKINNON and DIAMOND2010) would have drawn blood from ground-foraging cattle, whose δD tissue values may have been influenced by enriched soil δD.
Our rainwater results show broad shifts in δD values over the year, with higher values during the drier season (December to March) suggesting a greater contribution of evapotranspired water to our samples. Rainwater in both years tracked similar patterns of depletion and enrichment. The most depleted values were measured during the wetter part of the year (April–November), likely driven by the ‘amount effect’ (Dansgaard Reference DANSGAARD1964) as values of tropical precipitation are not strongly driven by temperature (Fricke & O'Neill Reference FRICKE and O'NEILL1999). Unfortunately, we did not collect water within and outside the forest during this study, thus our values reflect those of rainwater and fog collected in the coffee plantation only. While forest fog drip could not have contributed to our collected precipitation values, enriched values in the dry season suggest some influence of overall recycled moisture from land sources.
As predicted, sampling date significantly influenced claw values suggesting that shifts in precipitation δD were incorporated into growing claws. The second-best claw model also included an interaction between foraging level and sampling date, which may also reflect a seasonal shift in understorey values between rainy and dry periods. Considering these results and that claws grow continuously, they may be better than feathers for tracking micro-scale or seasonal habitat shifts. We did not sample prey throughout the year to determine if these values track rainwater shifts but this is an important area for future investigation since animal δD tissue values may be influenced by both drinking water (26–32%) and prey (Hobson et al. Reference HOBSON, ATWELL and WASSENAAR1999). The 14‰ difference in mean annual rainwater δD between 2008 and 2009 was not statistically significant and year was not retained in the best feather model. However it was included in the second-best feather model suggesting there may be an influence of year on feather δD values, as was found in a recent study examining yellow warbler (Dendroica petechia) feathers grown at wintering sites in Mexico (Quinlan & Green Reference QUINLAN and GREEN2011). Sampling feathers over a number of years in the same location would allow further exploration of potential year effects.
CONCLUSION
Our results are consistent with previous investigation of factors influencing δD on animal tissues, where microgeographic variation, temporal effects and trophic position significantly influenced δD. We have also identified a pattern of microgeographic and temporal variation that has not previously been observed: birds foraging in the forest understorey tend to have higher δD than those foraging in adjacent open areas and in the forest overstorey. Not only will accounting and controlling for this variability improve attempts to track movement at altitudinal or latitudinal scales, but there is also the potential to use this variation to track movement and habitat use at a local scale. Foraging level significantly influenced both feather and claw values suggesting a role for δD in tracking vertical movements within cloud forest. Our data highlight the importance of recycled moisture to the food webs of some forest understorey species. Both climate change and patterns of fragmentation and deforestation may disrupt forest hydrological cycles (Lachniet & Patterson Reference LACHNIET and PATTERSON2002). Tracking δD in forest understorey birds may be a reliable way in which to track sources of moisture in this food web, and how they may change over time. The spatio-temporal patterns we have uncovered may also be present in other vertebrate and invertebrate species living in similar tropical cloud-forest systems.
ACKNOWLEDGEMENTS
We thank Georges Duriaux-Chavarría for facilitating fieldwork, Alejandra Martínez Salinas for providing C. linearis samples and Hubert Askanas, Moisés Siles, Oscar and Johnny Rodríguez, Miguel Meribreno, Juan Cruz Gomez and Rodrigo Lopez for field assistance. Thank you to Anne McGeachy, Brittany Graham, Mireille Savoie and Christine Paton for their assistance at the SINLAB, and Len Wassenaar at Environment Canada for analysis of water samples. We thank Meredith Clayden, Trina Du and Maddison Proudfoot for preparing samples for isotope analysis. Funding was provided by NSERC post-graduate scholarship to KCF. We thank Keith Hobson for helpful comments on an earlier draft of this manuscript.


