INTRODUCTION
A topical debate amongst ecologists is the role of large herbivores in the top-down regulation of ecosystems (Moe et al. Reference MOE, RUTINA, HYTTEBORN and DU TOIT2009). It is now well established that mesobrowsers influence the regeneration of woody plants (e.g. in temperate biomes: cervids (Ward et al. Reference WARD, WHITE, WALKER and CRITCHLEY2008), beavers (Rosell et al. Reference ROSELL, BOZSER, COLLEN and PARKER2005); in savanna biomes: impala (Prins & Van der Jeugd Reference PRINS and VAN DER JEUGD1993), kudu (Barnes Reference BARNES2001), black rhino (Birkett & Stevens-Wood Reference BIRKETT and STEVENS-WOOD2005) and non-elephant browsers in general (Sharam et al. Reference SHARAM, SINCLAIR and TURKINGTON2006)). Savanna biomes are structurally heterogeneous (Ben-Shahar Reference BEN-SHAHAR1996) and the impacts of browsers are unlikely to be evenly distributed across the landscape (Levick & Rogers Reference LEVICK and ROGERS2008). However, although patch-dynamics have been inferred in savanna systems (Gillson Reference GILLSON2004, Moustakas et al. Reference MOUSTAKAS, SAKKOS, WIEGAND, WARD, MEYER and EISINGER2009), the effects of variation in the spatial distribution of a browser's impacts on woody vegetation have not been studied in any depth (Levick & Rogers Reference LEVICK and ROGERS2008, Mourik et al. Reference MOURIK, VAN LANGEVELDE, VAN TELLINGEN, HEITKONIG and GAIGHER2007). Moreover, despite increasing recognition of the role that mesobrowsers play in woodland dynamics (Moe et al. Reference MOE, RUTINA, HYTTEBORN and DU TOIT2009), the spatial component of their impact, as opposed to that of browsers in general, has not been directly investigated. This variation in impact is thought to be important in maintaining diversity (Noss Reference NOSS1990).
Where home-ranges of different browser species overlap, separating the species-specific impacts on woody vegetation becomes difficult (Guldemond & van Aarde Reference GULDEMOND and VAN AARDE2009). Three broad approaches have been used: visual separation based on characteristic markings left by different browsers on plants (Barnes Reference BARNES2001, Sharam et al. Reference SHARAM, SINCLAIR and TURKINGTON2006), correlating episodic growth of woodlands with population collapses of specific browser species (Prins & Van der Jeugd Reference PRINS and VAN DER JEUGD1993) and, most commonly, the use of exclosures that exclude particular browser species (Augustine & McNaughton Reference AUGUSTINE and MCNAUGHTON2004, Belsky Reference BELSKY1984, Goheen et al. Reference GOHEEN, KEESING, ALLAN, OGADA and OSTFELD2004, Moe et al. Reference MOE, RUTINA, HYTTEBORN and DU TOIT2009). Results from exclosure experiments may be confounded by a wide variety of factors. Small mammals (Goheen et al. Reference GOHEEN, KEESING, ALLAN, OGADA and OSTFELD2004) and invertebrates (Braak Reference BRAAK1995, Gandar Reference GANDAR, Huntley and Walker1982, Hagenah et al. Reference HAGENAH, MUNKERT, GERHARDT and OLFF2009) have been shown to impact woody vegetation, in some cases more heavily than large mammals, and yet exclusion of large mammals may result in increases in both small mammal (Keesing Reference KEESING1998) and invertebrate abundance (Shaw et al. Reference SHAW, KEESING and OSTFELD2002). Interspecific competition between woody plants (Riginos & Young Reference RIGINOS and YOUNG2007), between grasses and woody plants (Seymour Reference SEYMOUR2008) and facilitation between woody plants (Russell & Fowler Reference RUSSELL and FOWLER2004) may further confound exclosure results. Furthermore, where exclosures are erected on areas already impacted by herbivores, they monitor the recovery phase and not necessarily landscape-level effects (Bergström & Edenius Reference BERGSTRÖM and EDENIUS2003). Alternative approaches to studying impacts by browsers are therefore useful.
The impala is the quintessential southern African mesobrowser and is found at high densities throughout the region (Smithers Reference SMITHERS1983). Here we describe a novel sampling design, not utilizing exclosures, devised to determine the impact of impala on the recruitment of woody species within their home-ranges. We hypothesized that impact on woody plant recruits is greatest in areas of an impala herd's home-range in which the greatest number of impala spend the most time, and on those woody species that are well utilized.
METHODS
Study site
The study ran from November 2008 to July 2009 in the iMfolozi section of Hluhluwe–iMfolozi Park (HiP), KwaZulu–Natal, South Africa (28°00′–28°26′S; 31°43′–32°09′E). HiP is a 900-km2, completely fenced nature reserve, situated in the foothills of the first escarpment on the west side of the Zululand coastal plain (Whateley & Porter Reference WHATELEY and PORTER1983). The majority of HiP is savanna, classified as Northern Zululand Sourveld and Zululand Lowveld (Mucina & Rutherford Reference MUCINA and RUTHERFORD2006). Mean annual rainfall in iMfolozi is 635 mm, with April to September being the dry season (Balfour & Howison Reference BALFOUR and HOWISON2001). Terrain varies between valleys, hills and plains. The soils are mainly derived from sandstone, shale and dolerite intrusions and are generally eutrophic (Balfour & Howison Reference BALFOUR and HOWISON2001). iMfolozi is typified by Acacia nigrescens, A. tortilis and Spirostachys africana woodlands (Whateley & Porter Reference WHATELEY and PORTER1983). About 50% of iMfolozi is covered by open woodland (A. nigrescens/A. tortilis, A. nilotica, A. burkei and Combretum apiculatum), with closed woodland (dominated by S. africana/Euclea racemosa and A. grandicornuta (Pooley Reference POOLEY2003) in roughly equal percentages) covering about 25% of the terrain. The principal browsers in HiP, and their current estimated crude densities (KZN Wildlife, unpubl.), are elephant Loxodonta africana Blumenbach (0.56 km−2), giraffe Giraffa camelopardalis Linnaeus (0.89 km−2), black rhino Diceros bicornis Lichtenstein (0.35 km−2), kudu Tragelaphus strepsiceros Pallas (1.3 km−2), nyala Tragelaphus angasii Gray (7.3 km−2) and impala Aepyceros melampus Lichtenstein (26.1 km−2).
Sampling design
We used GPS collars to detect zones of different density of impala in the landscape and to thus define a fine-grain browsing gradient. At the start of the study period, four female impala in different breeding herds were fitted with GPS collars. These transmitted, via the mobile telephone network, the coordinates of the wearer every 6 h.
Impala breeding herds in iMfolozi were observed to remain spatially distinct during the study period; mixing of herds was observed only after the study ended, at the height of the dry season. Monthly field observations, utilizing the VHF-transmitting facility built into the collars, showed that all collared individuals stayed within their original herd over the study period. Numbers of adults in each of the four herds showed little variation over the study period (± < 15%). GPS locations showed, utilizing a GIS (ArcGIS 9 by ESRI), that home ranges for all four collared individuals changed little in either size or location of core and peripheral areas over the study period. This demonstration of stability in herd membership and size and fidelity to area of home ranges agrees with previous findings on impala breeding herds (Jarman Reference JARMAN1970, Murray Reference MURRAY1982). Thus the movements of each collared individual can be taken to represent the movements of its herd, which, over the period of the study, was stable in size, spatially distinct from other herds and occupied a home range that varied little in size or location.
Overlaying the GPS downloads after the 9 mo of data collection onto the GIS vegetation layer for the reserve, showed that open and closed woodland, two similar vegetation types, were the most commonly occupied vegetation types. For each of the collared individuals’ home ranges, 50% and 95% kernels were determined using Hawths Tools (hawthorne@spatialecology.com) and its Fixed Kernel Density Estimator. As the area of the 50% kernel was much smaller than that of the fringing (95%–50%) kernel, a core area of high occupancy (the 50% kernel), and an outer band of lower occupancy (95% kernel minus the 50% kernel) were defined. Densities of impala in each of these areas were then calculated. This was achieved by taking the number of GPS downloads in an area, multiplied by the average number of impala in that herd, divided by the area (ha) and all divided again by the number of days that the relevant collar functioned. This produced a value for impala density expressed as the number of impala per unit time per unit area. The 50% and 95%–50% kernels and the two different vegetation types thus provided four treatments within each of the home ranges (area of high impala density versus area of low impala density, in open woodland and in closed woodland). However, for one of the four collars, home range fell entirely within only open woodland, giving two treatments (area of high impala density versus area of low impala density in open woodland).
Impact on woody recruits by other browsers
Additionally we determined densities, by vegetation type, for all the reserve's principal browsers in the same local region of the reserve as the four impala home ranges. This was achieved by monthly repeated road and foot transects, over a 2-y period immediately prior to this study. We also estimated the comparative abundance of impala, nyala and kudu within each home-range study site, using those transect counts falling within the overlap of home-range and transect area (as determined in the GIS). Furthermore we determined, over the same period, feeding heights of the principal browsers and which woody plant species they utilized and to what extent (O'Kane et al. Reference O'KANE, DUFFY, PAGE and MACDONALD2011).
Impact on woody recruits by each principal browser species prevalent in HiP other than impala, within the treatment areas, was considered to be minimal for the following reasons: (1) Elephant. Although elephant biomass densities (closed woodland: 1500 kg km−2; open woodland: 1250 kg km−2) were similar to those of impala (closed woodland: 1500 kg km−2; open woodland: 1600 kg km−2), we determined that there was no significant overlap (Schoener's Index 0.16 to 0.35 (O'Kane et al. Reference O'KANE, DUFFY, PAGE and MACDONALD2011)) between elephant and impala in feeding height in any season. Less than 6% of elephant feeding records were in the height range ≤ 0.5 m, compared with 47% of impala's. Boundja & Midgley (Reference BOUNDJA and MIDGLEY2010), also working in HiP, concluded that elephants had little impact on woody saplings < 1 m in height. Various authors have similarly reported minimal feeding by elephants on woody plants below 1 m (Augustine & McNaughton Reference AUGUSTINE and MCNAUGHTON2004, Croze Reference CROZE1974, Dublin et al. Reference DUBLIN, SINCLAIR and MCGLADE1990, Stokke & du Toit Reference STOKKE and DU TOIT2000), whilst smaller browsers commonly utilizing woody recruits is equally well established (Augustine & McNaughton Reference AUGUSTINE and MCNAUGHTON1998, Belsky Reference BELSKY1984, Hobbs Reference HOBBS1996). When elephants do feed on seedlings, the damage caused (tearing marks and uprooting) is very characteristic (Sharam et al. Reference SHARAM, SINCLAIR and TURKINGTON2006); we found no evidence of such feeding within the experimental treatments. We also determined that there was no significant overlap (Schoener's Index = 0.32–0.39) between elephant and impala in woody plant species utilized; Makhabu (Reference MAKHABU2005) also found no significant overlap (Schoener's Index = 0.22–0.24) in woody species utilized by the two herbivores. (2) Kudu and nyala. Both species utilized woody recruits, with nyala showing significant overlap in feeding height with impala in all seasons. However, kudu and nyala densities by vegetation type and estimated abundance within each impala home range were consistently < 10% of those of impala (Table 1). (3) Giraffe. There was no significant overlap (Schoener's Index = 0.07–0.11) between giraffe and impala in feeding height in any season. Giraffe very rarely feed below 0.5 m (< 0.5% of woody feeding records), agreeing with the findings of others (du Toit Reference DU TOIT1990). (4) The black rhino makes a very distinctive 45° bite mark on vegetation (Emslie Reference EMSLIE1999), and thus its potential role in woody impact could be confidently excluded during data collection.
Table 1. Comparative prevalence of kudu, nyala and impala in the localized study area in iMfolozi Park. Densities of these herbivores (numbers km−2) in closed and open woodland vegetation types, derived from 2 y of road transects in the localized study area, are shown for wet and dry seasons. Additionally, estimates of abundance of these herbivores within each of the four separate impala home ranges assessed (home ranges a, b, c and d) are shown. These estimates are the total number of road-transect counts occurring within the area of overlap between home-range and transect area.

For these reasons, it was argued that variation in impact on woody recruits across treatments in the same vegetation type would be principally due to variation in impala density.
Data collection
Density of woody recruits. We defined woody recruits as recruits of woody plant species ≤ 0.5 m height. Within each treatment, woody recruits were sampled in 100 randomly located 1 × 1-m quadrats, giving 400 quadrats within each home-range. In each quadrat, the numbers of woody recruits were counted and, for each recruit, the plant species, whether it had been browsed and an estimate of the percentage of canopy remaining were recorded. For the fourth collar, 200 quadrats were sampled in each of the two treatments (area of high impala density versus area of low impala density in open woodland). Sampling was undertaken in the early part of the dry season (July) when impact of browsing by impala, after a full wet season (November–March) and 4 mo of dry season (April–July), would be most apparent.
Data analysis
Differences in density of woody recruits. The null hypothesis was that there was no difference in the mean density of woody recruits, or the mean percentage of their remaining canopy, between areas of high impala density versus areas of low impala density. Fisher's F test was used to determine whether variances in means were significantly different, with the standard two-sample t-test (equal variances) or Welch's modified two-sample t-test (unequal variances) (Crawley Reference CRAWLEY2005) then used to test the null hypothesis. P-values ≤ 0.05 resulted in rejection of the null hypothesis, i.e. represented significant differences between areas of high impala density versus areas of low impala density. Differences in number of recruits and number of quadrats with no woody plants were analysed by constructing contingency tables, and then testing the null hypothesis using Pearson's Chi-squared test with Yates’ continuity correction (Crawley Reference CRAWLEY2005). To assess impact on different height classes of recruits, the densities of recruits in 100-mm classes in areas of high impala density versus areas of low impala density were calculated and plotted (with 95% CIs).
Influence of impala density on density of woody recruits. To explore the relationship between density of impala and density of woody recruits, we used a generalized linear model having counts of recruits as the response variable (thus requiring a Poisson link), and impala density (continuous), woodland type (categorical) and interactions as explanatory variables. All statistical procedures were carried out in S-PLUS (Mathsoft 1999, Lucent Technologies, Inc., Murray Hill, USA).
RESULTS
Density of recruits was significantly lower in areas of high impala density (mean = 0.61 m−2) than in areas of low impala density (mean = 1.04 m−2: t = 6.92, P < 0.001 (two-tailed), df = 1598). Percentage of remaining canopy of recruits was also significantly lower in areas of high impala density (mean = 48.7%) than in areas of low impala density (mean = 63.3%: t = 9.44, P < 0.001 (two-tailed), df = 1632). Statistically more empty quadrats were found in areas of high, versus low, impala density (χ2 = 6.3, df = 1, P = 0.012). The average reduction in numbers of recruits going from areas of low to high impala density was 48% (range = 32–75%). Of recruits that showed greater impact in areas of high versus low impala density, 74% were amongst the top 20 woody species previously determined as the most utilized by impala. Differences in recruit density between areas of high versus low impala density were especially marked in the 0–200-mm height range, with these differences apparently carried through to larger recruit height classes (Figure 1).

Figure 1. Impact on different height classes of woody plants ≤ 0.5 m in iMfolozi Park. Variation between areas of high (filled) and low (open) impala density in terms of the density of woody plants ≤ 0.5 m m−2 is shown, with error bars displaying 95% CIs.
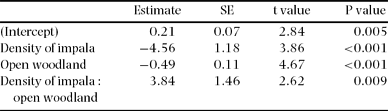
The generalized linear model showed a highly significant correlation between increasing density of impala and decreasing density of recruits of the 20 woody species previously determined as the most utilized by impala (slope = −2.59, SE = 0.696, t = 3.72, P < 0.001, df = 1599). The slope of this correlation was significantly greater in closed woodland compared with open woodland (Table 2). Although there was a correlation between increasing density of impala and decreasing density of all recruits, this was not significant (P = 0.088).
Table 2. Output of a generalized linear model of woody recruits versus density of impala in iMfolozi Park. The model (df = 1599) has counts of woody recruits (response variable) against density of impala (continuous explanatory variable), type of woodland (categorical explanatory variable) and interactions.

DISCUSSION
Our results strongly suggest that impala breeding herds significantly impact woody recruits in iMfolozi Park. Moe et al. (Reference MOE, RUTINA, HYTTEBORN and DU TOIT2009) recently demonstrated, using an exclosure experiment, that ungulate browsing reduces woody seedling survival along the Chobe riverfront, with impala strongly inferred as the cause. Prins & van der Jeugd (Reference PRINS and VAN DER JEUGD1993) convincingly related similar-aged stands of Acacia woodlands in East Africa to anthrax-induced impala population crashes. Our study thus further emphasizes the role of non-elephant browsers of high population-biomass in controlling savanna woodland dynamics. We showed a positive relationship between increasing density of impala and greater impact on woody recruits. The strong correspondence between impacted woody species and those previously recorded as utilized by impala, strengthens the validity of our findings. As far as we are aware, this is the first time GPS collars, combined with herd monitoring, have been used to determine fine-grain, quantifiable ungulate densities across home ranges that have been related to woody impact.
Over the 9-mo period (March–November) of their exclosure experiment, which monitored four woody species, Moe et al. (Reference MOE, RUTINA, HYTTEBORN and DU TOIT2009) reported a reduction in mean seedling survival due to ungulate browsing of ~50%. Although the two studies had different approaches, this value compares favourably with the mean 48% reduction in numbers of recruits reported here, quantitatively emphasizing the heavy mortality impala may inflict on young woody plants. Stability of home ranges may imply that in a reserve such as HiP, where the high impala population presumably translates into a mosaic of adjacent home ranges across the entire landscape, areas currently impacted will continue to be so. That the slope of the correlation between increasing density of impala and decreasing density of recruits was significantly greater in closed woodland compared with open woodland, suggests that increasing impala density impacts recruits more severely in closed woodland. This may be because less grass is available in closed woodland, forcing impala to browse more.
However, two caveats should be borne in mind. We have, as have Moe et al. (Reference MOE, RUTINA, HYTTEBORN and DU TOIT2009) and Prins & van der Jeugd (Reference PRINS and VAN DER JEUGD1993), demonstrated a correlation between impala and marked impact on woody recruits, not proven a causal relationship between the two. Secondly, other mesobrowsers (e.g. the larger kudu) although markedly less prevalent than impala, are likely to contribute to impact on woody recruits in a manner related to their localized total biomass.
The smaller the plant utilized the greater the proportion of the canopy removed when a bite is taken; for example a single bite from a small seedling by an impala removes nearly all of the leaves (and cotyledons if present) or uproots the seedling totally (pers. obs.), and the resultant impact is high. This is probably the explanation for the marked difference in plant density within the smaller height classes between areas of high versus low impala density.
A hypothesis of impala-induced patch dynamics
Optimal foraging theory (Stephens & Krebs Reference STEPHENS and KREBS1986) suggests that, at least initially, core areas of home ranges should occur where resources are highest within the home range. Subsequently, however, browsing lowers density of woody recruits in the core compared with the area surrounding it, in proportion to the density of impala. Further our data indicate that the core areas in each home range have been stable over at least the period of the study. Impact on seedlings, as would be expected, is translated to higher size classes. Thus, if the core persists for long enough, a patch of woody species at relatively low densities will be created not only in the < 0.5-m-height layer, but also in the larger classes. Although other variables will also influence shifts in home range, it seems likely that as woody recruit density declines, the core should shift into the current area of high woody recruit density and low impala density. This might occur suddenly at some threshold, or gradually over a period of time. Thus, dependent on core persistence, patch dynamics (MacArthur & Pianka Reference MACARTHUR and PIANKA1966) are established, whereby high- and low-density patches of woody species occur at the scale of the core(s). In this way a shifting mosaic of patches might be created and sustained by impala browsing. Similar proposals have been made for grazers affecting the structural heterogeneity of grasslands (Farnsworth et al. Reference FARNSWORTH, FOCARDI and BEECHAM2002, Verweij et al. Reference VERWEIJ, VERRELST, LOTH, HEITKÖNIG and BRUNSTING2006).
CONCLUSIONS
Impala appear to have a markedly negative effect on woody species recruitment. This impact was patchy and increased with increasing density of impala. A potential shifting mosaic of high- and low-density patches of recruits and older trees, may be induced by the effects of impala feeding in restricted home ranges of high fidelity. Thus impala may function as a key determinant of landscape heterogeneity. Although the elephant is often perceived by management as a keystone species and hence of overriding importance in woodland dynamics, our findings further highlight the role of other herbivores of high population-biomass in the long-term structure and composition of savanna woodlands. Indeed, it seems possible that long-term impact caused by different species within the browser guild may be proportionate to their population biomass, and thus the prominent impact of elephant may merely be a manifestation of its high total biomass in many areas.
ACKNOWLEDGEMENTS
We would like to thank the reserve management of Hluhluwe–iMfolozi Park, South Africa and Geoffrey Clinning for assistance with data collection. We thank Johan du Toit, Marion Valeix, Atle Mysterud and Jason Marshal for valuable comments on an earlier draft of this paper. We are deeply grateful to Nick and Katy Vetch and to Sabine and Richard Wood, who principally funded this study. This study was also funded by the National Research Foundation, South Africa.