INTRODUCTION
Ants are known to have distinct habitat preferences and also are quick to respond to even small-scale environmental changes and habitat heterogeneity (Alsonso Reference ALSONSO, Agosti, Majer, Alsonso and Schultz2000, Andersen Reference ANDERSEN1990, Kaspari & Majer Reference KASPARI, MAJER, Agosti, Majer, Alsonso and Shultz2000, Lassau & Hochuli Reference LASSAU and HOCHULI2004, Pacheco & Vasconcelos Reference PACHECO and VASCONCELOS2012, Spiesman & Cumming Reference SPIESMAN and CUMMING2007, Tews et al. Reference TEWS, BROSE, GRIMM, TIELBORGER, WICHMANN, SCHWAGER and JELTSCH2004). Different biotic and abiotic habitat characteristics, e.g. plant community structure, soil properties and habitat structure (Andersen et al. Reference ANDERSEN, LANOUE and RADFORD2010, Armbrecht et al. Reference ARMBRECHT, PERFECTO and VANDERMEER2004, Gotelli & Ellison Reference GOTELLI and ELLISON2002, Wang et al. Reference WANG, STRAZANAC and BUTLER2001, Wittman et al. Reference WITTMAN, SANDERS, ELLISON, JULES, RATCHFORD and GOTELLI2010) have been reported to be associated with ant community structure. However, the specific habitat characteristics that affect or shape the composition of ant assemblages in different habitats are understudied in many eco-regions (Hill et al. Reference HILL, SUMMERVILLE and BROWN2008). This is even more so with respect to the ant fauna of the Indian Subcontinent where reports relating ant fauna and habitat factors are scarce.
The ant functional group scheme (in relation to environmental stress and disturbance) was primarily developed based on studies of arid-zone fauna of Australia (Greenslade Reference GREENSLADE and Low1978) and it has been successfully applied in a number of studies in Australia (Andersen Reference ANDERSEN1986, Reference ANDERSEN1990; Burbidge et al. Reference BURBIDGE, LEICESTER, MCDAVITT and MAJER1992, Reichel & Andersen Reference REICHEL and ANDERSEN1996) and also in other parts of the world (Andersen Reference ANDERSEN1997, Bestelmeyer & Wiens Reference BESTELMEYER and WIENS1996, Gómez et al. Reference GÓMEZ, CASELLAS, OLIVERAS and BAS2003, Pfeiffer et al. Reference PFEIFFER, CHIMEDREGZEN and ULYKPAN2003). Such functional categorization helps in better assessment of ant community responses to disturbances rather than individual species (Hoffmann & James Reference HOFFMANN and JAMES2011, Stephens & Wagner Reference STEPHENS and WAGNER2006) The core functional groups include the dominant Dolichoderinae, generalized Myrmicinae and the opportunists which represent the dominant, subdominant and ruderal taxa respectively (Lach et al. Reference LACH, PARR and ABBOTT2010).The functional group dominant Dolichoderinae is found to be competitively dominant in Australian ecosystems characterized by hot, open habitats, but not in other types of ecosystem. Earlier studies have reported generalized Myrmicinae to prevail in forest habitats in the absence of dominant dolichoderines (Andersen Reference ANDERSEN1995, Hoffmann & Andersen Reference HOFFMANN and ANDERSEN2003, King et al. Reference KING, ANDERSEN and CUTTER1998). In India, although the presence of the dolichoderine ant Iridomyrmex anceps has been recorded (Hoffmann et al. Reference HOFFMANN, ANDERSEN and ZHANG2011), no study has reported any dominance from it (Bharti et al. Reference BHARTI, SHARMA, BHARTI and PFEIFFER2013, Narendra et al. Reference NARENDRA, GIBB and ALI2011). Narendra et al. (Reference NARENDRA, GIBB and ALI2011) reported tropical-climate specialists to dominate the evergreen and deciduous forest habitats and generalized Myrmicinae in all the other habitats. A negative relationship between generalized Myrmicinae and opportunists has been reported in earlier studies (Hoffmann & Andersen Reference HOFFMANN and ANDERSEN2003).
In this study across a habitat gradient in a mixed deciduous forest in Eastern India, we investigated whether structurally complex habitats differed from low complexity habitats in terms of ant species richness and community composition. We further examined which environmental variables were associated with abundance of different functional groups and on the basis of the rich literature on the distribution of functional groups across landscapes, we hypothesized that: (1) Dominant Dolichoderinae and hot-climate specialists will be absent or scarce in shaded habitats. (2) In absence of dominant Dolichoderinae, generalized Myrmicinae will prevail in the shaded forest habitats. (3) Opportunists will occur across all habitats, but will be particularly abundant in open habitats and where generalized Myrmicinae are low in number.
MATERIALS AND METHODS
Study area
The study was conducted in the Kuldiha Wildlife Sanctuary, Orissa, India, between November 2010 and August 2012. The sanctuary is located in the southern part of the Balasore district of Orissa state. The mean annual temperature and precipitation are around 26°C and 1568 mm, respectively (Pattanaik & Reddy Reference PATTANAIK and REDDY2008). Native vegetation of the sanctuary is a mosaic of evergreen, moist deciduous and dry deciduous forest (Pattanaik & Reddy Reference PATTANAIK and REDDY2008, Pattanaik et al. Reference PATTANAIK, REDDY and MURTHY2010). Mosaics of agricultural fields, scrubland and degraded forest constituted degraded areas in the fringes of the forest.
For ant sampling, we chose five major habitat-patch types: mixed deciduous forest (MDF), dry deciduous forest (DDF), sal (Shorea robusta) plantation (SPL), forest edge (FE) and forest opening (FO) that were spread across the sanctuary. Mixed deciduous forest, dry deciduous forest and sal plantation were closed-canopy types and provide shaded habitat for the ant community, whereas forest edge and forest openings were unshaded habitats with sparse canopy cover. Mixed deciduous forest patches were situated in the semi-evergreen portions of the forest and were dominated by both evergreen and deciduous trees. Dominant trees included Croton roxburghii, Macaranga peltata, Aspidopterys indica and Antidesma ghaesembilla. Dry deciduous forest patches were within the moderately dense areas of the sanctuary. These patches were dominated by deciduous trees like Shorea robusta with associated species, e.g. Terminalia alata, Lagerstroemia parviflora, Bridelia sp. and Antidesma ghaesembilla. Botanical nomenclature follows Saxena & Brahmam (Reference SAXENA and BRAHMAM1996). Trees in this site mostly shed their foliage during March to May. Sal plantation patches were monocultures of young Shorea robusta trees. Forest-edge sites (FE) were selectively logged nearly 40 y ago and the top soil was removed. These were the most arid and open patches with minimal grass cover. Forest openings (FO) were small (three such patches were selected for sampling, each measuring nearly 40 m in radius), naturally occurring gaps within the forest, and mostly covered with grass.
Ant sampling
We conducted our study across a total of 16 sites in the sanctuary, four within MDF, and three each in DDF, SPL, FE and FO (Figure 1). In each site a 20 × 20-m quadrat was established for ant sampling and habitat characterization. Minimum distance between the sites was 500 m. All sites were 123–258 m asl with <10º slopes. At each site, within the 20 × 20-m quadrat, a 5 × 3 grid of pitfall traps was established (with 2-m spacing in between) for ant sampling. Sampling was carried out 10 times from 2010 to 2012 (November 2010, January, March, May, July and October 2011, and January, March, May and August 2012). We performed trapping through all seasons. Pitfall traps have been shown to collect a representative sample of ants in savannas and forests (Andersen et al. Reference ANDERSEN, LANOUE and RADFORD2010, Barrow & Parr Reference BARROW and PARR2008, Frizzo et al. Reference FRIZZO, CAMPOS and VASCONCELOS2012, Queiroz et al. Reference QUEIROZ, RIBAS and FRANÇA2013, Ribas et al. Reference RIBAS, SOLAR, CAMPOS, SCHMIDT, VALENTIM and SCHOEREDER2012, Schmidt et al. Reference SCHMIDT, RIBAS and SCHOEREDER2013). The pitfall traps consisted of plastic cups (diameter: 40 mm, height: 80 mm), filled up to one-third of their height with a mixture of soapy water and ethylene glycol as a preservative. The cups were dug into the soil and their edges were flush with surface soil. The pitfall traps were operated for 24 h. Once in the laboratory, ants were identified to species or morphospecies using keys provided by Bingham (Reference BINGHAM1903) and Bolton (Reference BOLTON1994). Scientific names were updated according to the current nomenclature (http://antbase.org/). The voucher specimens were checked by an ant specialist in the Zoological Survey of India, Kolkata and are held at the Department of Zoology, University of Calcutta.

Figure 1. Map showing the study sites in the Kuldiha Wildlife Sanctuary, India. MDF, mixed deciduous forest; DDF, dry deciduous forest; SPL, sal plantation; FE, forest edge; FO, forest opening. FO patches are small and therefore only sites are shown in the map.
Measurement of habitat variables
We measured the following environmental variables at each site: tree number (TN), vegetation density (VD), vegetation height (VH), percentage litter cover (LIT), percentage grass cover (GR), percentage bare ground cover (BG), soil pH (SPH), soil nitrogen concentration (SN), soil organic carbon concentration (SOC) and canopy cover (CC). For measurement of these variables, a 10 × 10-m quadrat was established around each pitfall grid where the middle point of the pitfall grid was taken as a point of origin. Vegetation assessment was conducted in each of the 10 × 10-m quadrats where each tree with a girth at breast height (gbh) > 10 cm and tree height ≥ 5 m were identified and enumerated. Sampling of lower vegetation (all the saplings and shrubs below 2 m height were considered as lower vegetation according to Vasconcelos et al. Reference VASCONCELOS, LEITE, VILHENA, LIMA and MAGNUSSON2008) was conducted in five 2 × 2-m quadrats placed at the four corners and centre of the large quadrat. Individual stems of lower vegetation were counted to measure vegetation density (VD). Vegetation height (VH) was calculated with a marked pole placed vertically at the middle of each quadrat (Moranz et al. Reference MORANZ, DEBINSKI, WINKLER, TRAGER, MCGRANAHAN, ENGLE and MILLER2013). Average value of vegetation density and vegetation height obtained from five 2 × 2-m quadrats was used for further analysis. Percentage litter cover, percentage grass cover and percentage bare ground cover were also measured in these five quadrats at each site. All these microhabitat variables were measured twice each year, once during dry season and once during wet season, and averaged for analysis. A 10-cm core of top soil was collected from each of the five 2 × 2-m quadrats for measurement of soil pH, soil nitrogen concentration and soil organic carbon concentration. For each soil variable, average value of five 2 × 2-m quadrats was used for analysis. Canopy cover was also measured at each site from a photograph taken at the centre of the 10 × 10-m quadrat (photo taken at 1 m height from ground and camera fixed at 24-mm focal length; the pictures were analysed with Adobe Photoshop version CS6 and average canopy cover was measured) (Engelbrecht & Herz Reference ENGELBRECHT and HERZ2001).
Functional groups
We used Anderson's widely used functional group scheme (Andersen Reference ANDERSEN1995) based on global-scale responses of ants to environmental stress and disturbance: dominant Dolichoderinae (DD); generalized Myrmicinae (GM); opportunists (OS); subordinate Camponotini (SC); tropical-climate specialists (TCS); hot-climate specialists (HCS); cryptic species (CS); and specialist predators (SP). Cold-climate specialists were not present.
Data analysis
We used data from different sampling sessions pooled per site for all analysis except estimation of species richness (rarefaction) where we used the data of different sampling sessions as individual samples. Estimation of species richness was assessed using rarefaction (smoothed species accumulation) curves for each habitat to determine expected total species richness. For all analyses, our sample unit was 5 × 3 grid of pitfall traps. The richness and abundance data were pooled from all the pitfall traps for a particular grid. This analysis used ant occurrence data from all sites combined of a particular habitat type, of each sampling session and 100 iterations for estimating expected species richness with the program EstimateS 9.0. In each case, EstimateS was also used to calculate Chao2 (a non-parametric richness estimator) estimates of total species richness.
Non-metric multidimensional scaling was carried out (Kruskal's non-metric multidimensional scaling) using Bray–Curtis distance to ordinate sites in relation to their ant species composition. For this analysis abundance of each species was averaged for a 5 × 3 grid. Abundance values were log(x+1) transformed. Best NMDS plot was selected based on minimum stress value (type 1 stress formula).
To evaluate the main predictors associated with the changes in total ant species richness, average ant abundance and abundance of specific functional groups we used linear regression. Total ant species richness, average ant abundance and abundances of generalized Myrmicinae, subordinate Camponotini, opportunists and dominant Dolichoderinae were used as response variables and litter percentage (LIT), tree number (TN), vegetation density (VD), vegetation height (VH), bare-ground percentage (BG), grass percentage (GR), soil pH (SPH), soil organic carbon concentration (SOC) and soil nitrogen concentration (SN) were used as predictor variables. Normality and homoscedasticity of the residuals were checked carefully with Shapiro–Wilk's test and Levene's test respectively. Multicollinearity between independent variables was checked carefully using VIF (variance inflation factor) test. VIF value greater than five was treated as an indicator of multicollinearity. Some of the response variables were log-transformed prior to the analysis to achieve normality. In some cases when normality could not be achieved after transformation, a generalized linear model (GLM) was performed. A backward stepwise elimination (P > 0.05) of non-significant factors was performed and best model was derived depending on the lowest AIC (Akaike's information criterion) value (AIC > 2) (Burnham & Andersen Reference BURNHAM and ANDERSON2002). All modelling and statistical procedures were performed by using R (version 3.0.1) with nlme, vegan and MASS packages and Canoco 5.
RESULTS
The ant fauna
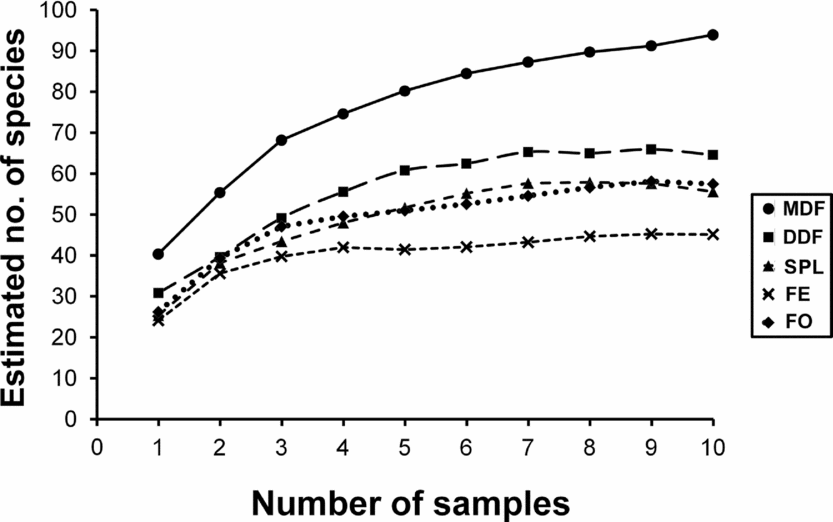
A total of 43 884 individuals were collected representing eight subfamilies, 41 genera and 100 ant species (Appendix 1). The richest subfamily was Myrmicinae, represented by 44 species and 18 genera, followed by Formicinae (23 species, nine genera) and Ponerinae (14 species, eight genera). The most species-rich genus was Pheidole represented by 10 species, followed by Camponotus (nine species) and Tetramorium (seven species). Pheidole (57.5% of total ants sampled) and Monomorium (8.63%) were the most abundant genera and the most abundant species was Pheidole sp. 2 (21.9%). Species richness was highest in MDF (75 species) and lowest in FE (42 species). DDF ranked second (56 species), followed by FO (50 species) and SPL (49 species). Only four species (Camponotus irritans, Paratrechina longicornis, Pheidole sp. 2 and Monomorium sp. 2) occurred across all 16 sites. The rarefaction curves for each habitat type reached an asymptote (Figure 2).

Figure 2. Rarefaction curves of estimated number of ant species collected in pitfall traps for all habitats in the Kuldiha Wildlife Sanctuary, India, based on Chao 2 richness estimator (each sample refers to ant occurrence data from all sites combined of a particular habitat type for each sampling session). MDF, mixed deciduous forest; DDF, dry deciduous forest; SPL, sal plantation; FE, forest edge; FO, forest opening.
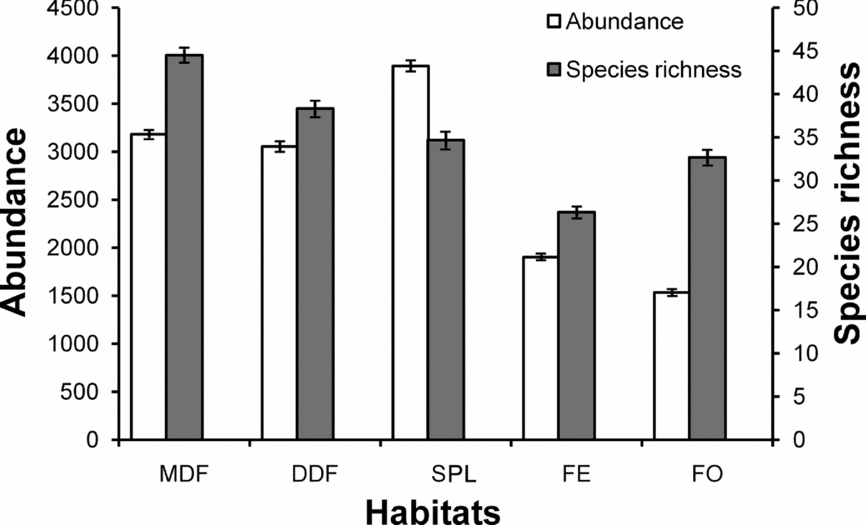
Ant species richness (Mann–Whitney U1,14 = 3.50, P = 0.004) and abundance (Mann–Whitney U1,14 = 1, P = 0.001) were significantly higher in shaded habitats than unshaded habitats. Ant species abundance (Mann–Whitney U1,8 = 1, P = 0.04) and richness (Mann–Whitney U1,8 = 1.5, P = 0.05) were significantly lower in sal plantation than other shaded habitats (MDF and DDF combined). Mean number of ant species and ant abundance per quadrat was relatively lower in the unshaded habitats (FE and FO) compared with the shaded habitats (MDF, DDF and SPL) (Figure 3).

Figure 3. Mean (±SE) abundance and mean (±SE) number of ant species collected in pitfall traps per quadrat across different habitats pooled for all sampling sessions in the Kuldiha Wildlife Sanctuary, India. MDF, mixed deciduous forest; DDF, dry deciduous forest; SPL, sal plantation; FE, forest edge; FO, forest opening.
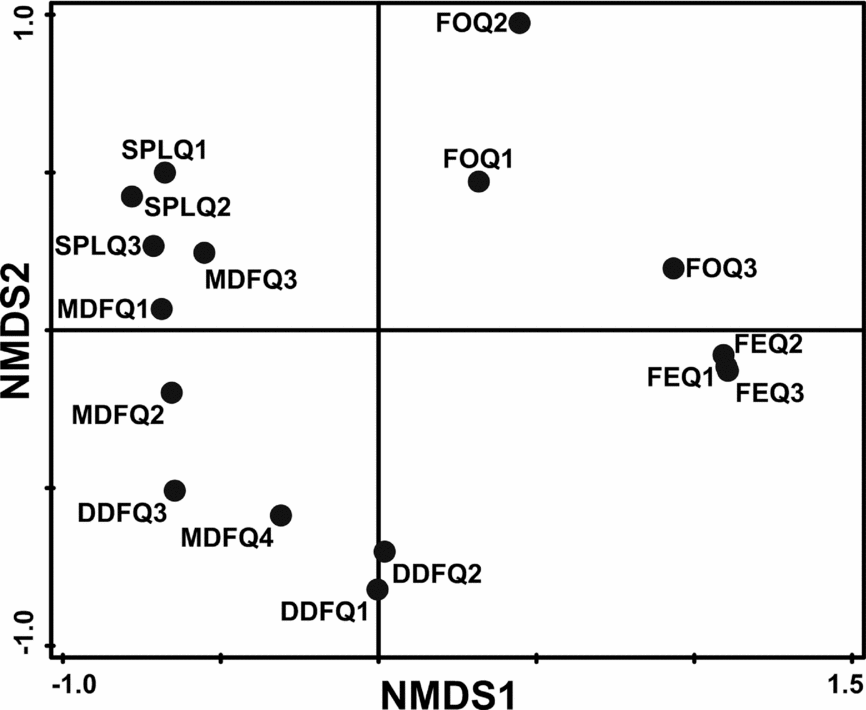
FE and FO sites clustered distantly from other habitat types but clustered close to each other in ordination space (stress = 0.01) (Figure 4). Sites in SPL clustered distinctly from DDF but showed some degree of overlap with two sites of MDF. MDF and DDF sites also overlapped.

Figure 4. Non-metric multidimensional scaling (NMDS) of different habitats in the Kuldiha Wildlife Sanctuary, India, based on ant species abundance. MDF, mixed deciduous forest; DDF, dry deciduous forest; SPL, sal plantation; FE, forest edge; FO, forest opening.
Functional groups
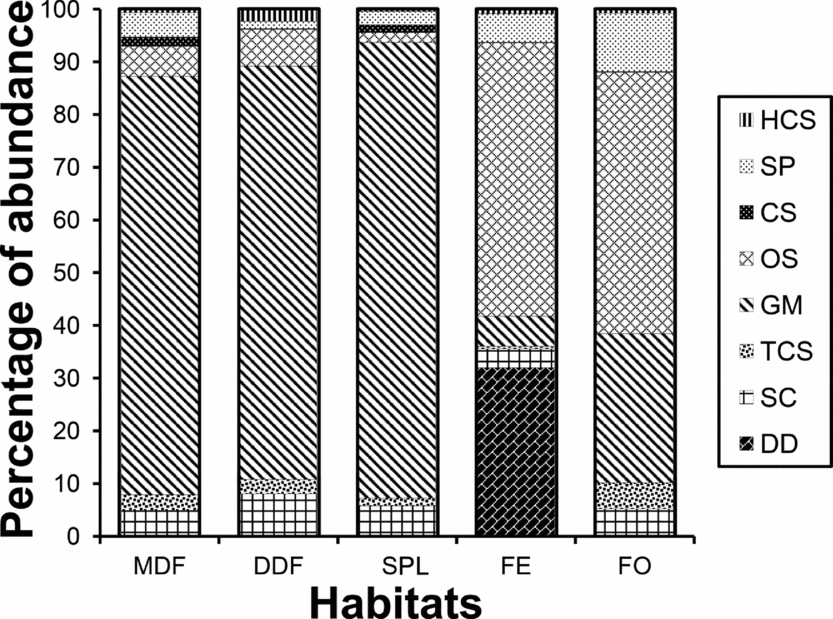
The richest functional groups were generalized Myrmicinae (20 species) and opportunists (18 species), followed by cryptic species (17 species), specialist predators (16 species), tropical-climate specialists (15 species) and subordinate Camponotini (12 species). Hot-climate specialists had only two species. Dominant Dolichoderinae were represented by only one species, Iridomyrmex anceps. It was found only in FE and comprised 32% of the total abundance recorded in FE.
Functional group composition (relative proportion of different functional groups)varied markedly across sites (Figure 5). Generalized Myrmicinae were the most abundant functional group (66.1% of all ants sampled), followed by opportunists (15.6% of all ants) and subordinate Camponotini (5.7% of all ants). Generalized Myrmicinae were more abundant in MDF, DDF and SPL whereas opportunists were abundant in FE and FO. GM was least abundant in FE, where they constituted only 6.8% of the abundance (Figure 5). Abundance of GM was negatively related with that of OS across the 16 sites (Adjusted R2 = 0.824, F = 71.2, P < 0.001). Subordinate Camponotini and cryptic species showed decreased abundance in open habitats.

Figure 5. Relative abundance (per cent) of ant functional groups in the five habitat types (MDF, mixed deciduous forest; DDF, dry deciduous forest; SPL, sal plantation; FE, forest edge; FO, forest opening) in the Kuldiha Wildlife Sanctuary, India. HCS, hot-climate specialists; SP, specialist predator; CS, cryptic species; OS, opportunistic species; GM, generalized Myrmicinae; TCS, tropical-climate specialist; SC, subordinate Camponotini; DD, dominant Dolichoderinae. Data are based on functional group abundance.
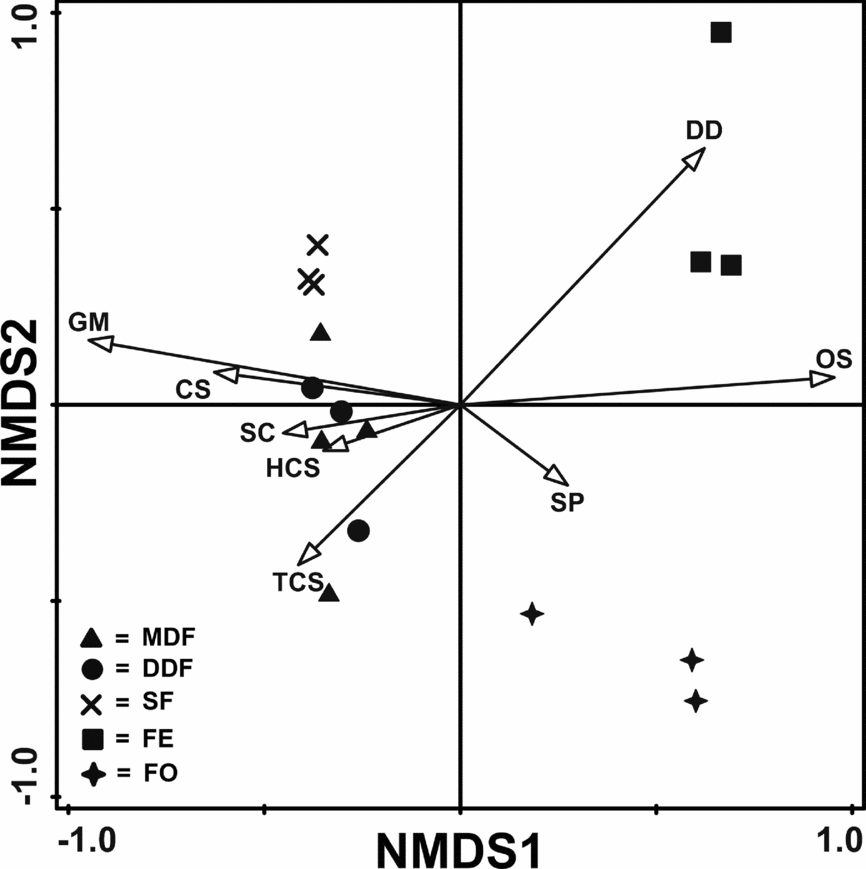
NMDS plot based on functional group abundance (stress = 0.004) also showed distinct clustering of open and shaded habitat (Figure 6). Forest edge and forest opening clustered distantly from shaded habitats and also from each other (Figure 6). Sal plantation sites clustered distantly from the other two shaded habitat sites though MDF and DDF sites showed overlapping (Figure 6). When functional groups were superimposed on habitat types it indicated preference of DD and OS towards forest edge (Figure 6). Specialist predator group showed weak preference towards forest opening. GM, CS, TCS, HCS and SC abundance increased towards shaded habitats.

Figure 6. Non-metric multidimensional scaling (NMDS) of different habitats in the Kuldiha Wildlife Sanctuary, India, based on ant functional group abundance with ant functional groups superimposed on it. MDF, mixed deciduous forest; DDF, dry deciduous forest; SPL, sal plantation; FE, forest edge; FO, forest opening. HCS, hot-climate specialists; SP, specialist predator; CS, cryptic species; OS, opportunistic species; GM, generalized Myrmicinae; TCS, tropical-climate specialist; SC, subordinate Camponotini; DD, dominant Dolichoderinae.
Habitat variables and ant functional groups
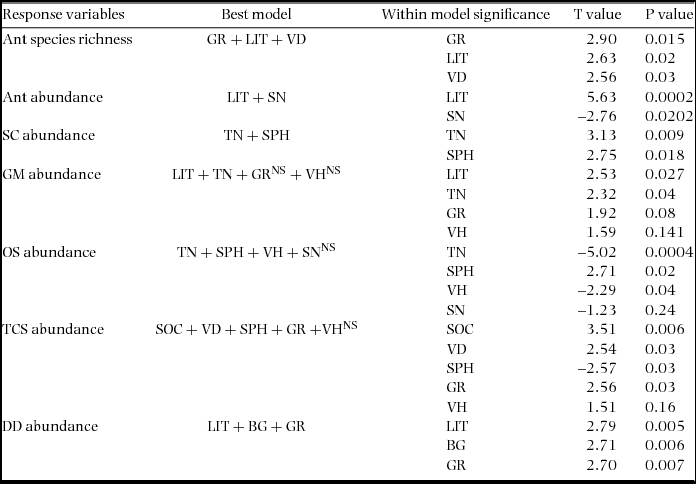
The best-fit linear regression model predicting ant species richness comprised a combination of percentage grass cover, percentage litter cover and vegetation density (Tables 1, 2). For predicting ant abundance, the best-fit model comprised litter percentage and soil nitrogen concentration. In the case of generalized Myrmicinae, the best-fit combined model comprised tree number, percentage litter cover, vegetation height and percentage grass cover. For opportunists, the combined model included tree number, soil pH, vegetation height and soil nitrogen concentration as best predictor variables (where tree number and vegetation height were negatively correlated with OS abundance). For dominant Dolichoderinae, the best fit model showed combination of percentage litter cover, percentage bare ground cover and percentage grass cover to be the most important predictor variables (where litter percentage was negatively correlated with DD abundance). We excluded canopy cover from our analysis because it showed multicollinearity (VIF = 17.7) with other predictor variables.
Table 1. Summaries of linear regression models (combined model) between ant species richness, abundance and abundance of different functional groups with different habitat parameters in the Kuldiha Wildlife Sanctuary, India. In the case of DD a generalized linear model was used instead of a linear regression model (due to non-linear distribution). Only the best models are represented here. Percentage litter cover (LIT), tree number (TN), vegetation density (VD), vegetation height (VH), percentage bare ground cover (BG), percentage grass cover (GR), soil pH (SPH), soil organic carbon concentration (SOC) and soil nitrogen concentration (SN) were the predictor variables (NS = >0.05).

Table 2. Summaries of linear regression models (combined model and significant variables within model) between ant species richness, abundance and abundance of different functional groups with different habitat parameters in the Kuldiha Wildlife Sanctuary, India. In the case of DD a generalized linear model was used instead of a linear regression model (due to non-linear distribution). Only the best models are represented here. Percentage litter cover (LIT), tree number (TN), vegetation density (VD), vegetation height (VH), percentage bare ground cover (BG), percentage grass cover (GR), soil pH (SPH), soil organic carbon concentration (SOC) and soil nitrogen concentration (SN) were the predictor variables (NS = >0.05).

DISCUSSION
A number of studies worldwide have shown the effect of habitat heterogeneity and microhabitat characteristics in shaping ant species assemblages (Hill et al. Reference HILL, SUMMERVILLE and BROWN2008, Pacheco & Vasconcelos Reference PACHECO and VASCONCELOS2012, Queiroz et al. Reference QUEIROZ, RIBAS and FRANÇA2013). In line with the ‘habitat heterogeneity hypothesis’ (MacArthur & MacArthur Reference MACARTHUR and MACARTHUR1961), our study reported higher ant species richness and abundance in more structurally complex habitats. Our results also showed the difference in ant community structure between natural forest habitat with monoculture (sal plantation), a trend that corroborates Cerdá et al. (Reference CERDÁ, PALACIOS and RETANA2009).
Studies in Asia (Bharti et al. Reference BHARTI, SHARMA, BHARTI and PFEIFFER2013, Narendra et al. Reference NARENDRA, GIBB and ALI2011, Pfeiffer et al. Reference PFEIFFER, CHIMEDREGZEN and ULYKPAN2003) showed the marked absence of dominant Dolichoderinae and in the absence of this group, other functional groups were found to dominate in these regions. Our study, however, revealed dominance of Iridomyrmex anceps, a dolichoderine species at forest edge, the open and bare habitat. This finding is similar to earlier reports in the hot and humid tropics of Queensland in Australia (King et al. Reference KING, ANDERSEN and CUTTER1998).
Andersen (Reference ANDERSEN1990) hypothesized that generalized Myrmicinae would occur in warmer regions in the absence of competition from dominant dolichoderines. In our study, all the three forest habitats were numerically dominated by generalized Myrmicinae and showed absence of dominant Dolichoderinae. On the other hand, at forest edge generalized myrmecines had markedly low abundance and this habitat was numerically dominated by dominant Dolichoderinae. This negative association between generalized Myrmicinae and dominant Dolichoderinae has also been reported earlier (Andersen et al. Reference ANDERSEN, LANOUE and RADFORD2010). We also found a strong negative correlation between the generalized Myrmicinae and the opportunists, which has also been reported earlier (Hoffmann & Andersen Reference HOFFMANN and ANDERSEN2003). Arnan et al. (Reference ARNAN, GAUCHEREL and ANDERSEN2011) proposed that the negative relationship between dominant and subdominant ants is due to interference competition whereas exploitation competition plays an important role in the negative relationship between subdominant and subordinate species. In our study too, the negative relation between dominant Dolichoderinae and subdominant generalized Myrmicinae and that between generalized Myrmicinae and subordinate opportunists are possibly attributed to interference and exploitative competition, respectively. Opportunists were found to prevail in the two open habitats as per our prediction, and the probable cause of this may be release from competition from generalized Myrmicinae which were dominant in the shaded habitats. Therefore, it can be said that in the forest habitats, in the absence of dominant Dolichoderinae, generalized Myrmicinae were most dominant and they suppressed the combined group of tropical-climate specialists, subordinate Camponotini and cryptics, as predicted by us. In our study area cold-climate specialists were absent. Only two species, Meranoplus bicolor and Messor sp. 1 were present as hot-climate specialists, though they were found to be associated mainly with the shaded forest habitats. Therefore, at our study region, hot-climate specialists did not behave as predicted. Most probably, the factors responsible for their distribution are not just habitat factors in our region, and factors such as competition from other groups may be attributed to their observed distribution.
Ant species richness was positively correlated with percentage litter cover and vegetation density. The litter zone is a complex habitat composed of leaves, twigs and other components (Kaspari & Weiser Reference KASPARI and WEISER2000) that can provide greater food resources (in terms of different insect prey) (Brühl et al. Reference BRÜHL, MOHAMED and LINSENMAIR1999) and nesting sites (Carvalho & Vasconcelos Reference CARVALHO and VASCONCELOS1999, Kaspari Reference KASPARI1996, Vasconcelos Reference VASCONCELOS1990), and also helps to maintain a favourable soil-moisture content (Andersen Reference ANDERSEN1983, Vasconcelos Reference VASCONCELOS1990). Accumulation of a large amount of litter in the shaded habitats thus contributed to habitat complexity which is known to be an important factor determining ant species richness and community composition (Lassau & Hochuli Reference LASSAU and HOCHULI2004). Also, previous studies have shown that sites with complex vegetation structures provide better conditions for ant activity than sites with simple structures (Bestelmeyer & Schooley Reference BESTELMEYER and SCHOOLEY1999, Retana & Cerdá, Reference RETANA and CERDÁ2000, Wisdom & Whitford Reference WISDOM and WHITFORD1981). The vegetation density and number of plant species were higher in the two native forest habitats than sal plantation. Since a richer assemblage of plant saplings support diverse insects prey and nesting places for the ants it can potentially support a diverse ant fauna. The greater ant species richness in denser and more diverse forest habitats (MDF and DDF) compared with sal monoculture is therefore determined by a richer sapling stratum. The negative relation between ant species richness and percentage of grass cover may be attributed to the positive correlation between ant species richness and litter cover. The two open habitats had more grass cover and fewer ant species than the forest habitats and this may be a reason for the negative correlation in the model.
Ant abundance was best explained by a combination of percentage litter cover and soil nitrogen concentration. High level of litter as well as soil nitrogen supports different micro flora and fungus groups which provide food resource for ants. Changes in soil nitrogen concentration close to ant nest sites have been reported in some studies (Briese Reference BRIESE1982, Culver & Beattie Reference CULVER and BEATTIE1983). Frouz & Jilková (Reference FROUZ and JILKOVÁ2008) argue that ants not only select spots with specific chemical conditions for nest construction but they do alter soil properties by depositing specific substrates in and around the nests (Chen Reference CHEN2007, Lafleur et al. Reference LAFLEUR, HOOPER-BUI, MUMMA and GEAGHAN2005), which may be a possible explanation of the association of ant abundance with soil nitrogen concentration.
Our study also showed that different habitat characteristics had strong associations with the functional group composition and these associations explained the interrelationships between the functional groups with respective habitats. For example, abundance of dominant Dolichoderinae (represented solely by Iridomyrmex anceps as other Dolichoderine species, e.g. Tapinoma spp. and Technomyrmex albipes, were classified as opportunists) significantly correlated with percentage bare ground cover and percentage grass cover but negatively correlated with litter percentage. This marks them as hot and open habitat specialists, as suggested by Andersen (Reference ANDERSEN1995). Opportunists were negatively associated with both tree number and vegetation height. Vegetation height is strongly correlated with biomass (Robel et al. Reference ROBEL, BRIGGS, DAYTON and HULBERT1970) and it also provides more food sources as well as niches to ants. Also, ants tend honeydew-producing hemipterans on an extremely wide range of plants and trees (Renault et al. Reference RENAULT, BUFFA and DELFINO2005, Rico-Gray & Castro Reference RICO-GRAY and CASTRO1996, Way et al. Reference WAY, PAIVA and CAMMELL1999). The associations of opportunists with these particular habitat variables and their numerical dominance in the open habitats denotes that opportunists are indeed related to stressful and ruderal habitats (Hoffmann & Andersen Reference HOFFMANN and ANDERSEN2003) where tree number is lower and food niches in terms of vegetation height are sparse, contributing to scarcity of food resources (Andersen Reference ANDERSEN, Agosti, Majer, Alsonso and Schultz2000).
On the other hand, the positive association of generalized Myrmicinae, subordinate Camponotini and tropical-climate specialists with variables like per cent litter cover, tree number, soil organic carbon concentration (which may be seen as the result of increased litter accumulation) and vegetation density explained their association with forest habitats. Soil pH was also found to be associated with abundance of subordinate Camponotini, tropical climate specialists and opportunists. However, explanation of any correlation between ant species diversity and soil pH is not easy (Alvarado Reference ALVARADO2000) and this correlation may be observed because ants change the soil processes during their nest construction and have effects on soil pH (Alvarado Reference ALVARADO2000).
Specialist predators’ abundance could not be explained by any of the predictor variables used in our study and there might be other factors affecting the composition of this functional group. This functional group probably does not respond to physical and land-cover variables per se, but rather to the presence or absence of its prey species. One main constituent of this group is Leptogenys processionalis, which is vagabond in nature, does not have well-defined permanent nests and moves along large trails and builds temporary nests. Other group raiders like other species of Leptogenys and all the species of Cerapachys are also included in this group, following earlier classification schemes (Andersen Reference ANDERSEN1995). In some cases, the differentiation between specialized predators and cryptic species is difficult as some species classified as cryptic species may also be considered as specialist predators. In our study, Hypoponera sp. 1 and Centromyrmex feae are classified as cryptics because Hypoponera are small ants with minute eyes whereas Centromyrmex feae is a blind ant and individuals of both these species are occasionally found in the top soil or the root-mat below the leaf litter layer, their specialized habitats. These species have small colony sizes and have little interaction with other species. Cryptic species have a tendency to avoid pitfall traps and leaf-litter extraction is considered suitable for their collection. However, in our study, the open habitats were mostly devoid of litter and therefore we had no other option but to rely on pitfall traps.
Our study provides first ever information on ant species composition in relation to habitat characteristics responsible for shaping ant assemblage structure in this part of the world. In line with observations from other parts of the world, our study also corroborates the association of different functional groups with different types of habitats. Our study is the first to report the dominance of a dolichoderine species within a particular habitat in India. In the context of the Indian sub-continent this study is also the first comprehensive attempt that explored the role of various habitat characteristics in determining spatial distribution of the ant species assemblage, particularly the various ant functional groups.
ACKNOWLEDGEMENTS
We are grateful to Swapna Soren, our field assistant. We are thankful to Orissa Forest Department for giving us permission to work inside Kuldiha Wildlife Sanctuary. This work was funded by University Grant Commission (UGC). We also acknowledge the taxonomic help from S. Sheela, ant taxonomist in the Zoological Survey of India. We are grateful to Kaberi Samanta for providing us with the GIS map of the study area. Our lab members Rahi Soren, Ritam Bhattacharya, Supratim Laha and Debaditya Kumar are gratefully acknowledged.
Appendix 1. Presence and absence of all ant species collected in pitfall traps along different habitats (MDF, mixed deciduous forest; DDF, dry deciduous forest; SPL, sal plantation; FE, forest edge; FO, forest opening) in the Kuldiha Wildlife Sanctuary, India. Functional groups (FG) are: dominant Dolichoderinae (DD), cryptic species (CS), opportunistic species (OS), subordinate Camponotini (SC), specialist predators (SP), tropical-climate specialists (TCS), hot-climate specialists (HCS) and generalized Myrmicinae (GM).


