


Introduction
Fruits are reproductive organs of plants that contain and protect seeds while they are developing for germination (Nathan & Chee Reference Nathan and Chee1987). Another function of fruits is to attract frugivores to help seed dispersal (Nathan & Chee Reference Nathan and Chee1987), moving seeds away from parent trees to avoid competition and pathogens and increase the chance of seedling establishment (Corlett Reference Corlett2014). There are many factors to help seed dispersion such as gravity, water, wind or animal but animals are the main factor. Plant species have evolved different fruit traits to attract seed dispersion factors, especially specific frugivores (Van der Pjil Reference Van der Pjil1982), with a range of fruit traits reported to influence fruit choice of frugivores including size (Chen et al. Reference Chen, Fleming, Zhang, Wang and Liu2004; Flörchinger and Braun Reference Flörchinger and Braun2010; Galetti et al. Reference Galetti, Pizo and Morellato2011; Kitamura et al. Reference Kitamura, Yumoto, Poonswad, Chuailua, Plongmai, Maruhashi and Noma2002), type of fruits (Chen et al. Reference Chen, Fleming, Zhang, Wang and Liu2004; Stiles Reference Stiles and Warran1989), colour (Chen et al. Reference Chen, Fleming, Zhang, Wang and Liu2004; Galetti et al. Reference Galetti, Pizo and Morellato2011; Gautier-Hion et al. Reference Gautier-Hion, Duplantier, Quris, Feer, Sourd, Decoux, Dubost, Emmons, Erard, Hecketsweiler, Moungazi, Roussilhon and Thiolly1985; Kitamura et al. Reference Kitamura, Yumoto, Poonswad, Chuailua, Plongmai, Maruhashi and Noma2002; Wheelwright & Janson Reference Wheelwright and Janson1985), physical protection of fruits (Chen et al. Reference Chen, Fleming, Zhang, Wang and Liu2004; Gautier-Hion et al. Reference Gautier-Hion, Duplantier, Quris, Feer, Sourd, Decoux, Dubost, Emmons, Erard, Hecketsweiler, Moungazi, Roussilhon and Thiolly1985), nutrients (Flörchinger & Braun Reference Flörchinger and Braun2010; Kitamura et al. Reference Kitamura, Yumoto, Poonswad, Chuailua, Plongmai, Maruhashi and Noma2002) and phenology (Chen et al. Reference Chen, Fleming, Zhang, Wang and Liu2004), as well as seed traits such as seed size (Chen et al. Reference Chen, Fleming, Zhang, Wang and Liu2004; Galetti et al. Reference Galetti, Pizo and Morellato2011; Kitamura et al. Reference Kitamura, Yumoto, Poonswad, Chuailua, Plongmai, Maruhashi and Noma2002), seed protection (Chen et al. Reference Chen, Fleming, Zhang, Wang and Liu2004; Gautier-Hion et al. Reference Gautier-Hion, Duplantier, Quris, Feer, Sourd, Decoux, Dubost, Emmons, Erard, Hecketsweiler, Moungazi, Roussilhon and Thiolly1985) and seed number (Chen et al. Reference Chen, Fleming, Zhang, Wang and Liu2004; Gautier-Hion et al. Reference Gautier-Hion, Duplantier, Quris, Feer, Sourd, Decoux, Dubost, Emmons, Erard, Hecketsweiler, Moungazi, Roussilhon and Thiolly1985; Kitamura et al. Reference Kitamura, Yumoto, Poonswad, Chuailua, Plongmai, Maruhashi and Noma2002). Fruit size is an important trait that affects seed dispersal because fruit size relates to body size of frugivores. Large frugivores disperse large fruits and small frugivores disperse small fruits (Galetti et al. Reference Galetti2013; Guimarães et al. Reference Guimarães, Galetti and Jordano2008).
Tropical forests are renowned for their high diversity of both flora and fauna (Brown Reference Brown2014), with most plant species producing fruits which are important food resources for frugivores (Kimura Reference Kimura2003). Tropical forests are under threat from land clearance, degradation and conversion to agriculture (Elliott & Kuaruksa Reference Elliott and Kuaruksa2008), with forest loss and fragmentation leading to a reduction in the frugivore food supply and potential population decrease or local extinction of both fruit-dependent vertebrate species and the plants whose fruits they disperse (Dirzo et al. Reference Dirzo, Young, Galetti, Ceballos, Isaac and Collen2014; Sekercioglu et al. Reference Sekercioglu, Daily and Ehrlich2004; Tylianakis Reference Tylianakis2013). Furthermore, poaching is a cause of frugivores decline or extinction result of seed disperser loss that leads to plant population decline and extinction (Loiselle et al. Reference Loiselle, Blake and Levey2002). Tropical montane forests are particularly vulnerable because their recovery is typically slower than that of lowland forests due to the less favourable climate for plant growth (Crausbay & Martin Reference Crausbay and Martin2016). They are therefore likely to be especially vulnerable to the adverse impacts of forest loss, fragmentation and degradation. A sound understanding of the frugivore–plant relationships in tropical montane forests is thus essential to their ongoing conservation and management.
In this study, we examine the fruit traits for tree species in a 16-ha permanent forest plot established in 2010 in the Huai Kog Ma watershed area, Doi Suthep–Pui National Park, Chiang Mai Province, northern Thailand. The objectives of this research were to quantify the frequency of fruit occurrence in the lower montane forest and distribution of fruit traits amongst species; and to estimate the potential availability of the fruit resource available to frugivores and how it varies amongst species characterized by different fruit trait sets.
Study site
This study was conducted at the 16-ha permanent forest measurement plot within the Huai Kog Ma watershed area (18° 54'N longitude and 98° 54'E latitude) located in Doi Suthep–Pui National Park, Chiang Mai Province, northern Thailand (Figure 1). The watershed has an elevation range from 1,250 to 1,540 m above mean sea level (Vongkuna Reference Vongkuna2005). The area has a strongly seasonal climate with a wet season from May to October (mean wet season rainfall 1,219 mm y−1 over the 10-year period 2009–2018; Doi Suthep–Pui Climate Station 327020) and dry season from November to April (mean dry season rainfall 119 mm y−1). The mean daily maximum temperature in the wet season during the same period was 28°C and 21.8°C in the dry season.
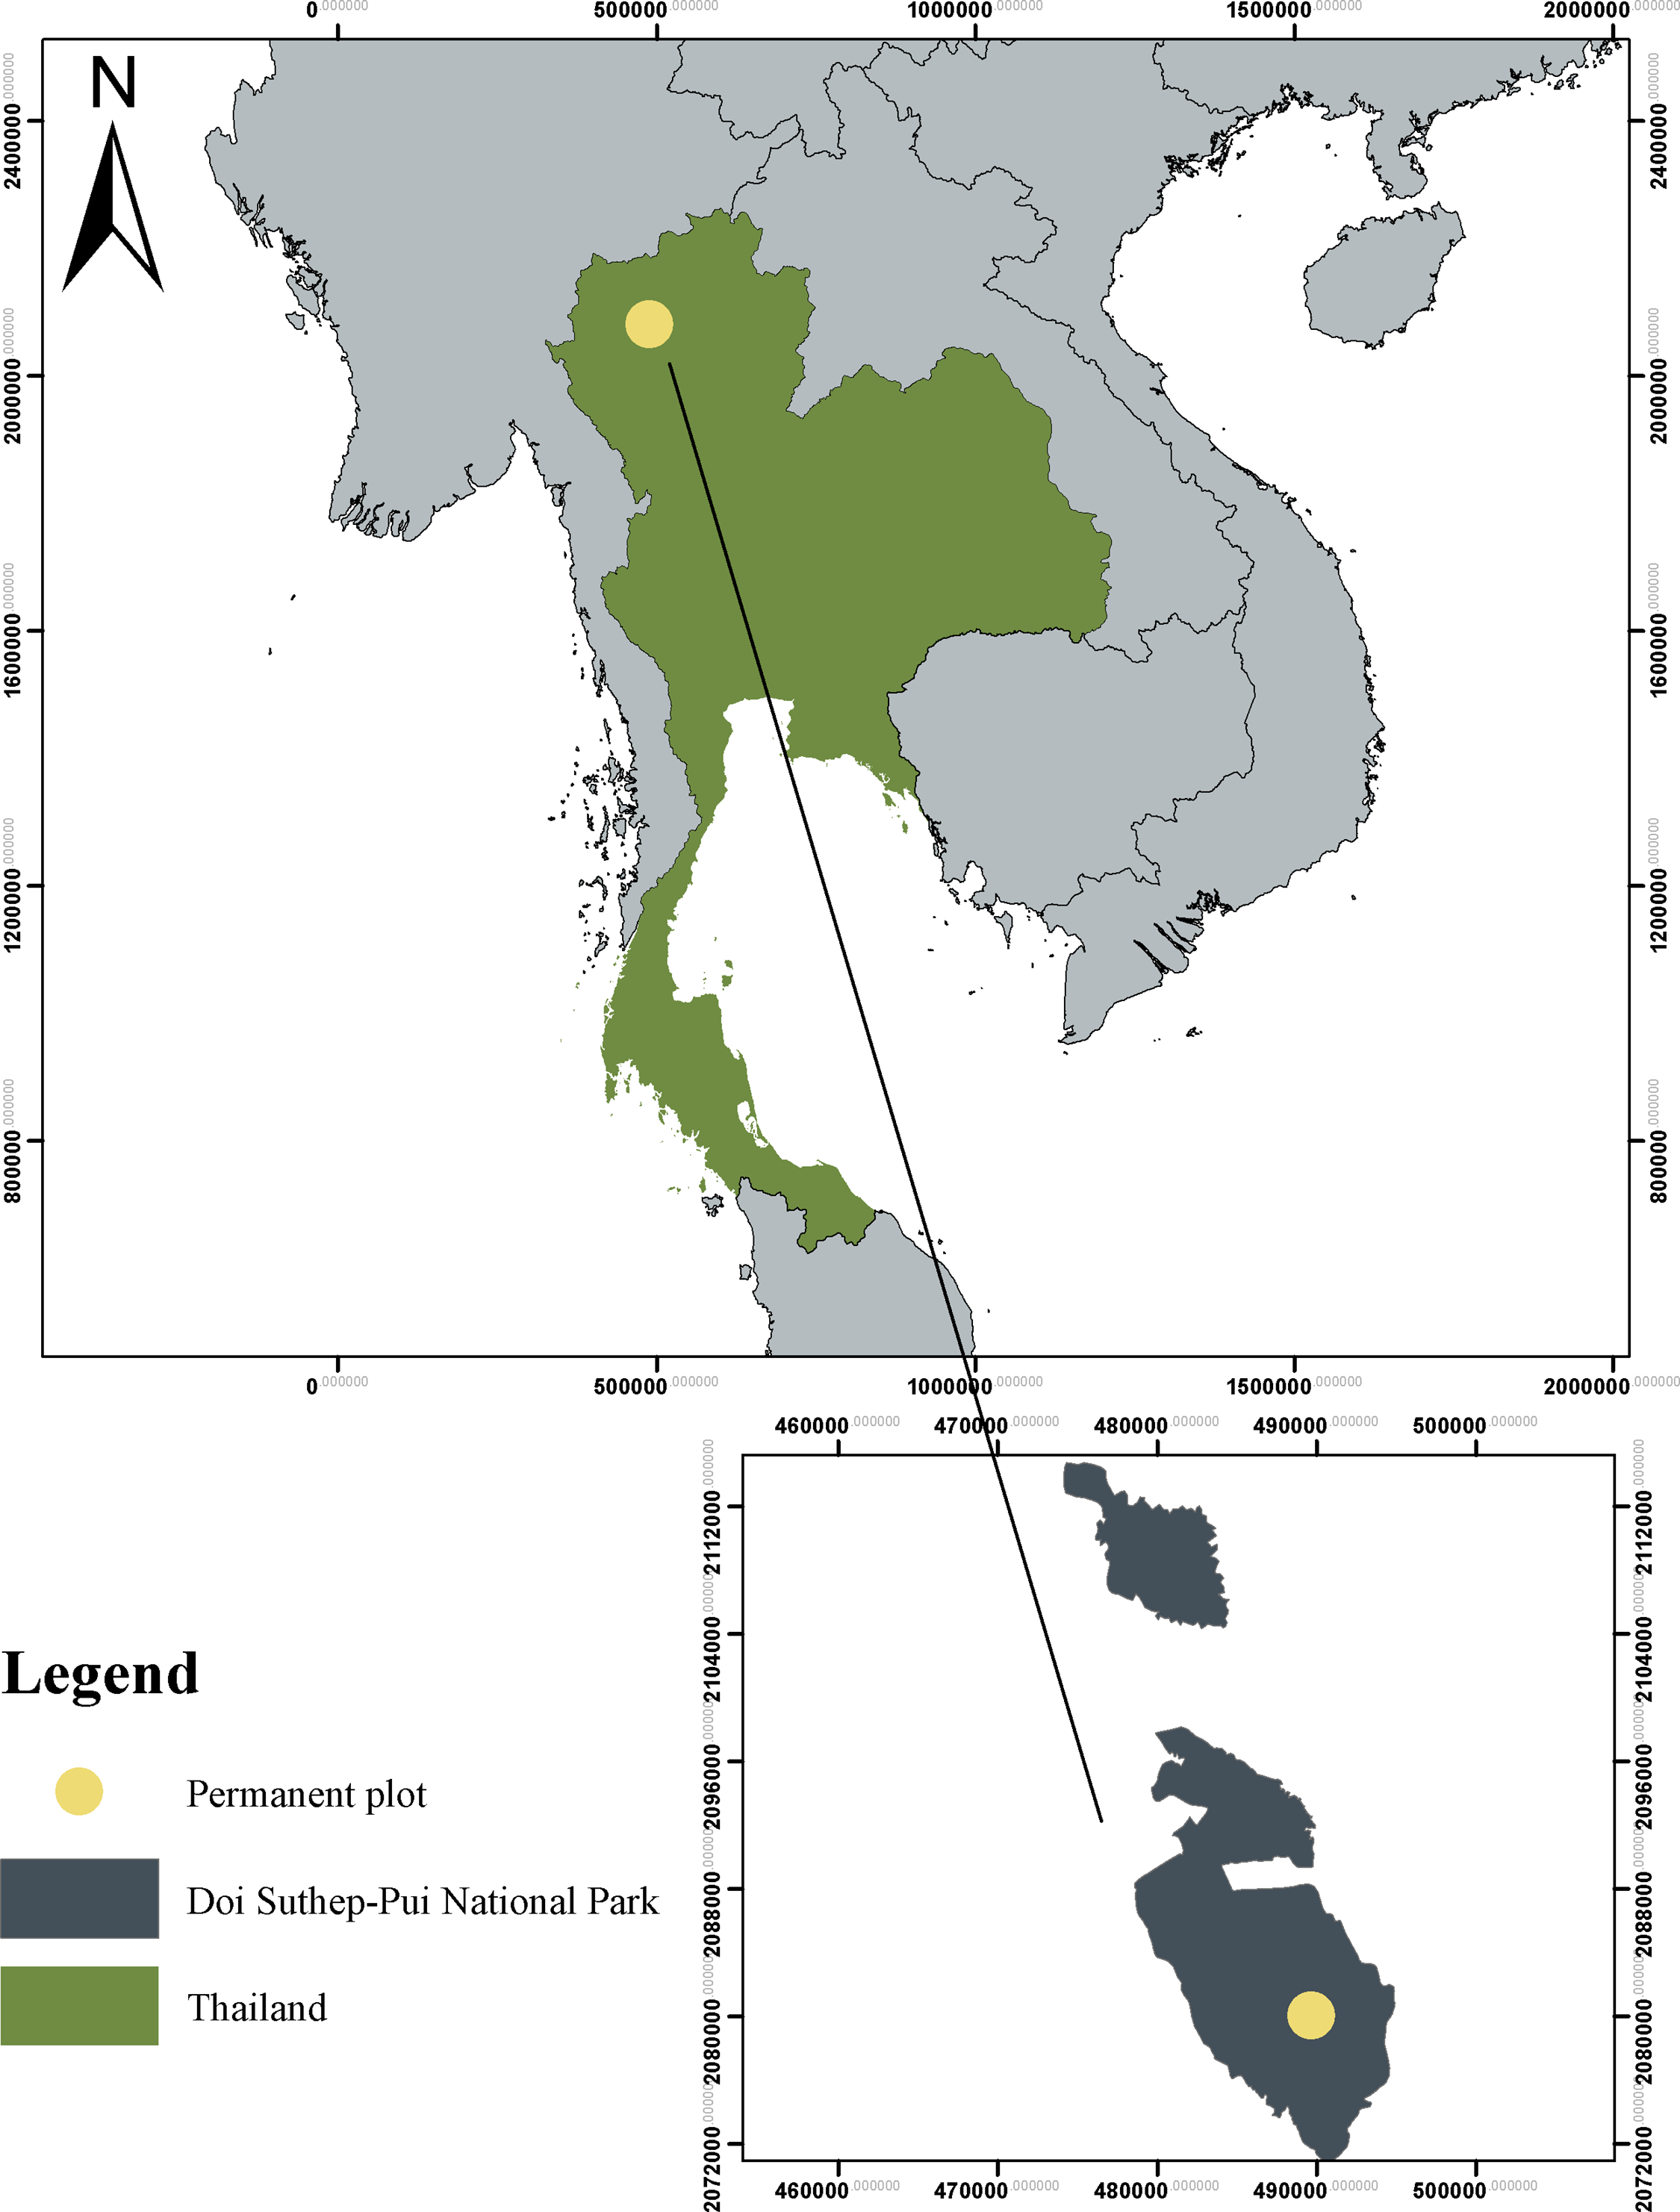
Figure 1. Study area location (Huai Kog Ma watershed) in lower montane forest, Doi Suthep–Pui National Park, Thailand.
The permanent plot was conducted in the lower montane forest at Mae Sa–Kog Ma biosphere reserve. The permanent plot consists of large trees with a canopy up to 30 m high. The indicator plant species in the lower montane forest are plants in Fagaceae with some mixed species in gymnosperm (Marod & Kutintara Reference Marod and Kutintara2009). The dominant families in the permanent plot are Lauraceae, Euphobiaceae and Fagaceae (Marod et al. Reference Marod, Sungkaew, Duengkae, Asanok, Kamyo, Hermhuk, Panmongkol, Thinkhampang, Marod and Thapyai2015). While animals in the permanent plot were found, many animals were in four groups such as mammals, birds, amphibians and reptiles. The examples of animals are Leopard cat, Hog badger, Common palm civet, Red-cheeked squirrel, Silver pheasant, Ashy bulbul, Puff-throated bulbul, Himalayan newt, Twin-spotted tree frog, Common mock viper and Pope’s pit viper, etc. (Duengkae & Marod Reference Duengkae and Marod2016). However, the permanent plot is located close to villages. So sometimes, we found the villagers came to collect forest products such as mushrooms and some tourists.
Methods
The 16-ha permanent plot (400 m × 400 m) was set up in 2010 and is divided into marked subplots of 100 m2, totalling 1,600 subplots. All trees with diameter at breast height (DBH) ≥ 2 cm were tagged, measured and identified (Marod et al. Reference Marod, Sungkaew, Duengkae, Asanok, Kamyo, Hermhuk, Panmongkol, Thinkhampang, Marod and Thapyai2015). Data on tree and fruit parameters for all tree species identified within the permanent plot were collected from both primary and secondary sources. Primary source information was obtained by direct observation in the permanent plot (found these species provided fruits) and subsequent measurement of data for collected fruits of 10 species (5–30 replicate fruits per species depending on availability): Choerospondias axillaris, Madhuca floribunda, Schefflera heptaphylla, Baccaurea ramiflora, Apodytes dimidiata, Ficus curtipes, Ficus hirta, Ficus semicordata, Prunus arborea and Acronychia pedunculata. Secondary sources were mainly online databases and publications including the Concise Encyclopedia of Plants in Thailand database (Forest Botany Division 2016), The Botanical Garden Organization databases (The Botanical Garden Organization 2011), the Useful Tropical Plants database (Fern Reference Fern2014) and a field guide to forest trees of northern Thailand (Gardner et al. Reference Gardner, Sidisunthorn and Anusarnsunthorn2007). We collected data on 10 fruit traits for the focused tree species and categorized each trait into the same scale for easy to analyse as the following.
The definition of trait categories for fruits was as follows:
Life form: vine (stem DBH >2 cm), large shrub (2 cm DBH to 7 m height), small tree (height 7–15 m), middle-sized tree (height 15–30 m), tall tree (height >30 m) – following Kitamura et al. (Reference Kitamura, Yumoto, Poonswad, Chuailua, Plongmai, Maruhashi and Noma2002).
Dispersal mode: barochory (seeds dispersed by gravity), ballistichory (dispersed by launching), anemochory (wind), endozoochory (eaten and pass through animal gut), hoarding (buried or otherwise cached by animals) – following Cornelissen et al. (Reference Cornelissen, Lavorel, Garnier, Diaz, Buchmann, Gurvich, Reich, ter Steege, Morgan, van der Heijden, Pausas and Poorter2003).
Fruit type: fleshy – cone, drupe, berry, syconia; non-fleshy – nut, aggregate fruit, capsule – following Stiles (Reference Stiles and Warran1989).
Fruit size: measured as length of longest axis; small (<20 mm), medium (20–50 mm), large (>50 mm) – following Chen et al. Reference Chen, Fleming, Zhang, Wang and Liu2004).
-
Fruit colour: green, yellow, brown, orange, red, blue, black (includes dark purple) – following Wheelwright and Janson (Reference Wheelwright and Janson1985).
Fruit protection: measured as presence and thickness of an outer barrier which reduces access to the flesh and seeds; dehiscent (there is no barrier), indehiscent with thin husk (a thin skin that can be cut with a fingernail), indehiscent with thick husk (a thickened wall) – following Gautier-Hion et al. (Reference Gautier-Hion, Duplantier, Quris, Feer, Sourd, Decoux, Dubost, Emmons, Erard, Hecketsweiler, Moungazi, Roussilhon and Thiolly1985).
Fruiting season: dry season (November–April), aseasonal (throughout the year or more than one time per year), wet season (May–October) adapted from Chen et al. Reference Chen, Fleming, Zhang, Wang and Liu2004).
Number of seeds per fruit: few (1–3 seeds), some (4–10 seeds), many (>10 seeds) – following Chen et al. Reference Chen, Fleming, Zhang, Wang and Liu2004).
Seed size: seed length; small (<2 mm), medium (2–10 mm), large (>10 mm) – following Chen et al. Reference Chen, Fleming, Zhang, Wang and Liu2004).
Seed protection: no protection, thin seed coat (the seed coat can be opened with a fingernail, thick seed coat (the seed coat is lignified or there is a true stone) – following Gautier-Hion et al. (Reference Gautier-Hion, Duplantier, Quris, Feer, Sourd, Decoux, Dubost, Emmons, Erard, Hecketsweiler, Moungazi, Roussilhon and Thiolly1985).
The trait data were sorted by the number and proportion of species in each category. Because fruit resource to selection by frugivores is also determined by body and gape size of frugivores and fruit size, (Chen et al. Reference Chen, Fleming, Zhang, Wang and Liu2004; Corlett Reference Corlett1998), we first examine the relationship between fruit size and all other fruit and seed traits by χ2 because the data were measured in categorical scale. We then use Principal Component Analysis (PCA) to examine further the similarities amongst fruit traits using function prcomp in the R software stats package (R Core Team 2019). Fruit traits were assigned ordinal values increasing from 0 (starting from the first category until the last category) for each trait category (order as listed above under trait category descriptions). Then hierarchical cluster were analysed for divided groups of fruiting species. Furthermore, the distribution maps of fruiting trees cluster from PCA analysis were created.
The food resource available to frugivores was estimated based on the density, basal area and stem size–class distributions for each fleshy fruited species in the 16-ha permanent plot with DBH ≥ 2 cm. Trees with DBH <5 cm were considered to be juveniles, and while included for size–distribution analysis, were excluded from density and basal area estimates since they are unlikely to contribute to fruit production. Given that annual fruit/seed crop size generally increases with tree size (Harper Reference Harper1977), tree species were ranked by density (ha−1) and basal area (m2 ha−1) as a measure of fruit resource availability for frugivores. The DBH size distributions of fleshy fruited trees were described using 26 classes (DBH 2–5 cm, and then every 5 cm up to DBH > 125). Size distributions were used to assign species to regeneration type categories of either light-demanding (fewer individuals in the smallest size classes) or shade-tolerant (inverse J distribution of size–class abundances) (Gairola et al., Reference Gairola, Rawal, Todaria and Bhatt2014; Melese & Ayele, Reference Melese and Ayele2017; Swamy et al., Reference Swamy, Sundarapandian, Chandrasekar and Chandrasekaran2000). If the generation status is reverse-J shape, mean mature trees of plant population are replaced by new trees of the next generation (Larson & Funk, Reference Larson and Funk2016), indicating good regeneration. When fruiting species has good regeneration indicating they have the potential to provide fruits for frugivores in the future. All statistical analyses were conducted using R software version 3.5.3 (R Core Team 2019).
Results
General flora
The 16-ha permanent plot contained a total of 29,163 individuals 208 woody species in 139 genera and 59 families. Life forms included 81 species of middle-sized trees (38.9%) or 13,978 individuals (47.9%), 77 small trees (37.0%) or 10,130 individuals (34.7%), 28 shrubs (13.5%) or 3,479 individuals (11.9%), 21 tall trees (10.1%) or 1,567 individuals (5.4%) and 1 vine (0.5%) or 9 individuals (0%). Dispersal mode across all species was dominated by endozoochory (157 species; 75.5% or 17,268 individuals, 59.2%), followed by ballistichory (26 species; 12.5% or 3,210 individuals, 11.0%), hoarding (16 species; 7.7% or 7,373 individuals, 25.3%) and anemochory (9 species; 4.3% or 1,312 individuals, 4.5%). Of the total of 173 species with animal consumed fruits (83.2%) (24,641 individuals), 122 species were fleshy fruited (70.5%) (12,562 individuals) and 51 were non-fleshy fruited (29.5%) (12,081 individuals). The density of all tree species ≥ 2 cm DBH in the permanent plot was 859 ha−1, and of fleshy fruited species was 358 ha−1. The mean basal area of trees ≥ 2 cm DBH across all species was 34.5 m2 ha−1 and for fleshy fruited species was 12.9 m2 ha−1.
Fleshy fruits
Amongst the fleshy fruited species 62 (50.8%) or 7,516 individuals (59.8%) produced berries, followed by 52 (42.6%) of 4,921 individuals (39.2%) with drupes, 6 (4.9%) or 87 individuals (0.7%) with syconia and 2 (1.6%) or 38 individuals (0.3%) with cones. The highest proportion of fleshy fruited species were small trees (42.6% of species or 44.1% of individuals), followed by middle-sized trees (30.3% of species or 34.0% of individuals), shrubs (18.9% of species or 13.9% of individuals) and tall trees (8.2% of species or 8.0% of individuals). Most fleshy fruited species produced black fruits (43.4% of species or 57.1% of individuals). The next most common colours were red and yellow (19.7% of species or 7.5% of individuals and 14.8% of species or 11.0% of individuals, respectively). Brown, orange, green and blue fruits were relatively rare (7.4%, 6.6%, 4.1% and 4.1% of species, respectively, or 5.0%, 9.5%, 6.9% and 3.1%, respectively). The majority of fleshy fruits (63.1% of fleshy fruited species or 74.1% of individuals) were small (length <20 mm), followed by medium-sized (40 species; 32.8% of species, 25.3% of individuals) and large (5 species; 4.1% of species, 0.5% or individuals) large fruits.
Fruit size and life form
The distribution of fruit sizes did not differ significantly amongst life forms (χ2 = 11.304, df = 6, P = 0.08). Most species bearing large fruits (80%) were small trees. Half of the small-sized trees (50%) produced medium-sized fruits. Most small fruits were associated with small trees (36.4%), middle-sized trees (29.9%) and shrubs (26%) (Figure 2a).

Figure 2. Distribution patterns of different fruit traits against percentage values with summation to 100% for each fruit size class were shown. The abbreviates were different fruit traits; (a) life form, (b) fruit season, (c) fruit type, (d) fruit colour, (e) fruit protection, (f) seed size, (g) seed protection and (h) number of seed per fruits.
Fruit size and fruit season
The distribution of fruit size differed significantly by fruiting season (χ2 = 7.260, df = 4, P = 0.12). Most plant species produced fruit in the wet season. Most middle-sized fruits were produced in the wet season (62.5%) or dry season (25%). Most small fruits were produced in the wet season (58.4%) or dry season (39%). While most large-fruited species produced fruits in the wet season (60%) or equally in dry season and throughout the year (20%) (Figure 2b).
Fruit size and fruit type
Fruit type differed significantly by fruit size (χ2 = 16.269, df = 6, P < 0.05). Most plants bearing small fruits were characterized by berries and drupes (54.5% and 42.9%, respectively), while medium fruits were predominantly berries, drupes and syconias (47.5%, 40% and 12.5%, respectively). Large fruits were either berries (80%) or syconias (20%) (Figure 2c).
Fruit size and colour
Fruit colour differed significantly by fruit size (χ2 = 28.267, df = 12, P < 0.05). Black (51.9%) was the dominant colour for small and medium-sized fruits followed by red (20%). Yellow (40%) green (20%) and orange (20%) occurred in large fruits, while brown and blue colours were rare across all fruit sizes (Figure 2d).
Fruit size and fruit protection
Different sized fruits differed significantly in fruit protection (χ2 = 32.424, df = 4, P < 0.0001). Most small fruits (85.7%) were indehiscent with a thin husk. Both types of indehiscent fruits – with thin husk (50%) and thick husk (50%) – occurred in medium-sized fruits. Most large fruits (80%) were indehiscent with a thick husk. Dehiscent fruits occurred only in small fruits (Figure 2e).
Fruit size and seed characters
All species produced either medium seeds or small seeds regardless of fruit type. Seed size differed significantly from fruit size (χ2 = 8.693, df = 2, P < 0.05). Most small fruits (87%) had small seeds (length < 2 mm) while most large fruits had small seeds (60%) or medium seeds (40%) (Figure 2f). Most species with both small-sized fruits (80.5%) and medium-sized fruits (67.5%) bear fruits with few (1–3 seeds per fruit) seeds per fruit. Most large fruits bear fruits with some (4–10 seeds per fruit) (60%) or many (>10 seeds per fruit) seeds per fruit (40%) (Figure 2h). The distribution of seed protection types also differed significantly with fruit size (χ2 = 6.649, df = 2, P < 0.05). Large (80%), medium (52.5%) and small (75.3%) fruits had mostly thick seed coats (Figure 2g).
Similarity amongst fruit traits
The first three factors of the PCA conducted on the fruit traits by species matrix accounted for 56.7% of the total variation. The first factor is most strongly related to fruit protection, number of seeds per fruit, fruit size and fruit type, all having large negative loadings (Table 1). This axis separates species with fruits containing many seeds and thick husk indehiscent fruits from other species (Figure 3). The second factor is most strongly related to seed size, life form and fruit type. Seed size and life form influenced it negatively, while traits related to fruit type have positive loadings. This axis separates species with drupe fruit type and/or large seeds, from the others. The third factor is heavily influenced by fruit season and seed protection. Fruit season had a strong positive loading, while traits related to seed protection has a strong negative loading.
Table 1. PCA factor loadings, eigenvalues and % variance explained for the first three axes of the fleshy fruited tree species by fruit traits data matrix


Figure 3. Distribution of fleshy fruited tree species and fruit trait biplot vectors for the first two axes of the species × fruit traits matrix PCA. Points show the position in ordination space of each tree species, and vectors show the direction of maximum correlation and positive increase in fruit trait values. Length of vectors shows their relative importance. The first axis explains 26.3% of total variation, and the second axis 17.4%.
The hierarchical cluster divided fleshy fruited species into 3 groups (Figure 4). The first group consists of 27 species such as M. floribunda, Elaeocarpus spp., Ficus spp. Baccaurea spp. and Garcinia spp. This group is characterized by species with predominantly medium to large-sized berry fruits, with bright coloured, thick husk indehiscent and containing many seeds. Some species in this group provided fruits throughout the year. The second group is defined by species with predominantly small-sized, thin husk, both dull and light coloured fruits, containing few seeds with small seed and provided fruits in dry season. This group includes 35 species such as Ardisia quinquegona, Canthium glabrum, Chionanthus ramiflorus, Diospyros kerrii and S. heptaphylla. The last group consists of a large number of species with berry, drupe and cone predominantly small-sized, thin husk, black coloured fruits, few number of seeds and small seed-sized with thick seed and provided fruit in wet season such as Alangium kurzii, Ilex englishii, Casearia grewiifolia, Syzygium spp., Litsea spp. and Cinnamomum iners. When considering the distribution maps of fruiting trees cluster, it was found that all three groups of fruiting trees were distributed throughout the permanent plot (Figure 5a–c). From the fruiting trees, distribution maps of three groups found the fruiting trees are scattered throughout the permanent plot. In some areas, each group of fruiting trees had different densities.

Figure 4. The result of hierarchical cluster analysis can divide fleshy fruited species into three groups.

Figure 5. Fleshy fruited trees distribution map by three groups from hierarchical cluster analysis. (a) Group 1; (b) group 2; (c) group 3.
Food resource for frugivores
The fleshy fruited species with the greatest density is Litsea martabanica followed by Persea gamblei and Saurauia roxburghii, respectively. The fleshy fruited species with the greatest basal area is Litsea grandis followed by Syzygium toddlioides and C. axillaris, respectively. Group 3 had the greatest total density and basal area (440.9 trees ha−1, 9.44 m2ha−1), followed by group 2 (216.4 trees ha−1, 2.47 m2ha−1) and group 1 (127.7 trees ha−1, 1.26 m2ha−1), respectively (Table 2). This result indicates that the majority of individuals (>90%) and basal area (∼90%) of fleshy fruited species within the 16-ha forest plot have black, small-sized and thin husk indehiscent fruits. The other groups with medium–large-sized, thick husk indehiscent fruits containing medium-sized seeds and many seeds are represented by few, and primarily small, trees.
Table 2. The density and basal area of fleshy fruited tree species by PCA group in the lower montane tropical rainforest study area at Doi Suthep–Pui, northern Thailand

The overall DBH size–class distributions for fleshy fruited species for each of the three PCA groups were strongly negative exponential with highest frequencies in the smallest diameter classes (Figure 6a–f). Species in group 1 had few individuals larger than 30 cm DBH, while the summed distributions for groups 2 and 3 showed a long tail of larger trees (up to 125 cm DBH). These same patterns were shown also for the species contributing the highest basal area in PCA group 1; D. glandulosa mostly comprising small trees with negative exponential pattern (Figure 7a–f). For groups 2 and 3, the highest basal area species, L. grandis and C. axillaris showed lower frequencies in the smallest size class than in the next larger class.

Figure 6. The DBH distribution pattern of fleshy fruit species by PCA grouping and the basal area distribution in each DBH class. (a) The DBH distribution pattern of group 1; (b) The basal area distribution pattern of group 1; (c) The DBH distribution pattern of group 2: (d) The basal area distribution pattern of group 2; (e) The DBH distribution pattern of group 3; and (f) The basal area distribution pattern of group 3.

Figure 7. The DBH distribution pattern of fleshy fruit species with the highest basal area in each group and the basal area distribution pattern in each DBH class. (a) The DBH distribution pattern of Diospyros glandulosa; (b) The basal area distribution pattern of D. glandulosa; (c) The DBH distribution pattern of Litsea grandis; (d) The basal area distribution pattern of L. grandis; (e) The DBH distribution pattern of Choerospondias axillaris; (f) The basal area distribution pattern of C. axillaris.
Discussion
Of the total 122 species of fleshy fruits, small trees (42.6%) had the highest proportion followed by middle-sized trees, shrub and tall trees, respectively. A Tropical seasonal forest in Thailand, Kitamura et al. (Reference Kitamura, Yumoto, Poonswad, Chuailua, Plongmai, Maruhashi and Noma2002), found shrub is the highest proportion followed by middle-sized trees, liana, small trees, tall trees, herbs and epiphytes. Amongst fleshy fruited species, there were strong patterns in the fruit traits displayed amongst tree species: The majority of species with fleshy fruits were characterized by small fruit size, black in colour, thin protective coats, medium seed size and few seeds per fruit, consistent with the findings of Chen et al. Reference Chen, Fleming, Zhang, Wang and Liu2004), Galetti et al. (Reference Galetti, Pizo and Morellato2011), Gautier-Hion et al. (Reference Gautier-Hion, Duplantier, Quris, Feer, Sourd, Decoux, Dubost, Emmons, Erard, Hecketsweiler, Moungazi, Roussilhon and Thiolly1985), Herrera (Reference Herrera1987), Kitamura et al. (Reference Kitamura, Yumoto, Poonswad, Chuailua, Plongmai, Maruhashi and Noma2002), Peña et al. (Reference Peña, Schleuning, Donoso, Rodriguez-Perez, Dalerum and Garcia2020).
Fleshy fruits are the primary forest food resource for frugivorous birds and mammals (Jordano Reference Jordano and Ferner1992). Each frugivore species likely prefers fruits that have different traits, with the extent of fruit type specialization influencing frugivore species abundances and distributions. Fruit size is an important trait in fruit selection by frugivores, (Peña et al. Reference Peña, Schleuning, Donoso, Rodriguez-Perez, Dalerum and Garcia2020 & Valenta et al. Reference Valenta and Nevo2020), with selected fruit size related to mouth size (Valido et al. Reference Valido, Schaefer and Jordano2011) – i.e. large fruits consumed more often by large frugivores and small fruits by small frugivores (Flörchinger & Braun Reference Flörchinger and Braun2010). Fruit colour also affects the fruit visitation of frugivores. Mammals and birds have different colour visual systems (Corlett Reference Corlett2011), and many authors report that birds prefer red and black fruits while mammals are more likely to choose yellow and green fruits (Galetti et al. Reference Galetti, Pizo and Morellato2011; Gautier-Hion et al. Reference Gautier-Hion, Duplantier, Quris, Feer, Sourd, Decoux, Dubost, Emmons, Erard, Hecketsweiler, Moungazi, Roussilhon and Thiolly1985; Kitamura et al. Reference Kitamura, Yumoto, Poonswad, Chuailua, Plongmai, Maruhashi and Noma2002). Furthermore, Kitamura et al. (Reference Kitamura, Yumoto, Poonswad, Chuailua, Plongmai, Maruhashi and Noma2002) note that both large and small soft fruits with many seeds are eaten by a broad array of frugivore species (bird and mammal), while fruits with single large seeds are eaten by fewer frugivore species groups, and mostly not by small frugivores. So, tree species with fruits having these traits (large fruit size, and yellow or green in colour) may be at higher risk of decline under human impact on forest ecosystems, with large frugivores often preferentially lost from fragmented forest patches. A previous study in the Doi Suthep–Pui large plot (Rueangket et al. Reference Rueangket, Duengkae, Thinkhampang and Marod2019) reported that M. floribunda fruits (large green, thick husk, moderate seeds) were consumed by many species of frugivore, particularly rodents, while the small fruits of Schefflera sp. were consumed only by bulbuls. In addition, the season of fruit ripening may also strongly influence fruit resource available to frugivores. In our study, and consistent with Chen et al. (Reference Chen, Fleming, Zhang, Wang and Liu2004), most species show fruit ripening in the wet season, some in the dry season, while only a very small number show aseasonal fruit production.
In our study area, while non-fleshy fruits comprised only 31.7% of species, they comprised a much higher percentage of overall tree density (45%) and basal area (45%) and represent a significant source of food for some animal species, particularly squirrels and rats (Gautier-Hion et al. Reference Gautier-Hion, Duplantier, Quris, Feer, Sourd, Decoux, Dubost, Emmons, Erard, Hecketsweiler, Moungazi, Roussilhon and Thiolly1985; Vander Wall Reference Vander Wall2001). These fruit types were mainly nuts from species in the genera Castanopsis, Lithocarpus and Quercus (all Fagaceae), and a previous study (Rueangket et al. Reference Rueangket, Duengkae, Thinkhampang and Marod2019) found nuts of Castanopsis acuminatissima were consumed by only rodents. Rodentia is well known as seed predators but also contribute to the dispersal of seeds through their scatter hoarding and occasional forgotten seed caches, so that some seeds escape consumption and can germinate and establish (Corlett Reference Corlett2017; Suzuki et al. Reference Suzuki2007; Vander Wall Reference Vander Wall2010). These animal groups have strong gnawing incisors so they can consume nuts and other thick seed coat fruits which have a hard shell (Corlett Reference Corlett2017).
Although not explicitly explored here, phylogenetic relatedness as a driver of fruit trait similarities amongst species was apparent. Most species in our PCA group 1 represented well-protected, medium to large fruits, small to medium seed size. Group 2 represented the species with predominantly small-sized, thin husk, both dull and light coloured fruits, containing few seeds with small seed and provided fruits in dry season. And group 3 represent small-sized, thin husk, black coloured fruits, few number of seeds and small seed-sized with thick seed and provided fruit in wet season. Chen et al. (Reference Chen, Fleming, Zhang, Wang and Liu2004) noted phylogenetic relatedness particularly in relation to number of seeds per fruit, and fruit and seed protection, the first two of these are also important in our study. Furthermore, Chen et al. (Reference Chen, Fleming, Zhang, Wang and Liu2004) found evidence of low fruit size variance in the same genus, which he considered may reflect a selective response to different frugivore species pressures. Fruiting species in group 1 consist of Ficus species, we note that Ficus is well known as a keystone resource for forest frugivores because almost all types of frugivores (bird, mammal, reptile and fish) consume their fruits across a broad range of fruit sizes (Shanahan et al. Reference Shanahan, So, Compton and Corlett2001) and many species of moderate to large fruits (Garcinia species, Elaeocarpus species and M. floribunda), suitable for large frugivores because large frugivores can disperse seeds to long distance to suitable germination and establishment site (Naniwadekar et al. Reference Naniwadekar, Chaplod, Datta, Rathore and Sridhar2019), but the species in this group has low density and basal area in this forest, and volume of fruits may be small. This potentially may limit the resource base for some larger sized frugivores, a problem likely to be exacerbated by forest loss and fragmentation, because fragmentation reduces frugivores density and fruit dispersal (kirika et al. Reference Kirika, BIeher, Bohning-Gaese, Chira and Farwig2007). Group 2 and group 3 consist of many small-sized fruits with few seeds but differed in fruit protection and fruit colour and seasonal. These groups have higher densities and basal areas indicated this forest has many small-sized fruits to attract both small and large frugivores like small fruits (Gautier-Hion et al. Reference Gautier-Hion, Duplantier, Quris, Feer, Sourd, Decoux, Dubost, Emmons, Erard, Hecketsweiler, Moungazi, Roussilhon and Thiolly1985; Wheelwright Reference Wheelwright1985). However, the frugivores species was attracted to consume fruits must also consider other fruit traits such as fruit colour and fruit season. From distribution map of fruiting, trees that scattered throughout the permanent plot indicated this forest has enough fruits to support frugivores.
Most species size–class distributions showed distributions reflective of stable mature forest dynamics with continuous recruitment supporting population size and structure, as described by Melese and Ayele (Reference Melese and Ayele2017).
Conclusions
The 16-ha permanent plot has many fleshy fruits that varied fruit traits, predominantly small-sized, black, thin husk, berried fruits with few, small-sized seeds. The fruited species with these traits occurred in group 3 of hierarchical clustering. The overall fruiting trees in the permanent plot that were higher small-sized class than larger sized class can imply to this area having many fruiting trees for supporting food resource of frugivores in the future because their regeneration status is good. On the other hand, there are lower fruiting tree species, occurred in group 1, suggests a potential bottleneck for resource availability to specialist frugivores which depend on these fruit types and makes them especially vulnerable to decline if forest clearance and fragmentation continues.
Acknowledgements
The authors would like to thank Mr. Niwat Intawin, the members of the Thai Forest Ecological Research Network and students of Forest Biology Department, Faculty of Forestry, Kasetsart University, for their support in field data collection.
Financial support
This research was supported by the Thailand Research Fund in Royal Golden Jubilee (RGJ) Ph.D. Programme (grant number PHD/0216/2558); the National Research Council of Thailand (Project: Biodiversity Monitoring on the Climate Changes in Huai Kog Ma Biosphere Reserve and adjacent area of Doi Suthep–Pui Mountain Ecosystems, Chiang Mai Province); and Kasetsart University Research and Development Institute, KURDI.


