


INTRODUCTION
Fruiting in tropical forests is patchy in space and time (Herrera Reference HERRERA1998, van Schaik et al. Reference VAN SCHAIK, TERBORGH and WRIGHT1993). Frugivores can be expected to track resources over space and time to minimize energy loss in search of food and maximize energy intake through fruit consumption (Kotler & Brown Reference KOTLER and BROWN1988). The fruit-tracking hypothesis postulates a positive association between the abundance of frugivores and fruits over space and time (Burns Reference BURNS2002, Reference BURNS2004; Rey Reference REY1995).
The positive associations between fruiting plants and their frugivores may vary across spatial scales (Burns Reference BURNS2004), time (Herrera Reference HERRERA1998) or across sites (Garcia et al. Reference GARCIA, ZAMORA, GOMEZ and HODAR2001, Perez-Tris & Telleria Reference PEREZ-TRIS and TELLERIA2002, Telleria & Perez-Tris Reference TELLERIA and PEREZ-TRIS2003). Some studies have also reported a lack of relationship between frugivores and fruit abundance, possibly as a consequence of the single scale at which they were conducted (Garcia & Ortiz-Pulido Reference GARCIA and ORTIZ-PULIDO2004, Guitian & Munilla Reference GUITIAN and MUNILLA2008). Studies across hierarchical scales allow us to tease apart the role of adaptive mechanisms versus other constraining abiotic factors like climate or historical effects (Burns Reference BURNS2004). The trade-off between energy costs of travelling large distances and patch foraging efficiency can promote coexistence along the axis of heterogeneity in fruit resource distribution across different spatial scales (Kneitel & Chase Reference KNEITEL and CHASE2004, Kotler & Brown Reference KOTLER and BROWN1988).
In the Asian tropics, hornbills are the largest avian frugivores. Several hornbill species can occur in sympatry in evergreen forests (Gale & Thongaree Reference GALE and THONGAREE2006, Kinnaird & O’Brien Reference KINNAIRD and O’BRIEN2007). Sympatric hornbills depend on a similar set of fruiting tree species; 50% of the food plant species of Asian hornbills belong to only five tree families (Kitamura Reference KITAMURA2011). While factors such as differences in relative contributions of figs and non-figs in diet (Datta & Rawat Reference DATTA and RAWAT2003) and in preferred foraging areas on fruiting trees (Hadiprakarsa & Kinnaird Reference HADIPRAKARSA and KINNAIRD2004) may aid in niche divergence between sympatric hornbills, it remains to be explored whether sympatric species differ in the scales at which they track fruit resources.
In this study, we aimed to understand whether similar body-sized sympatric hornbill species tracked fruit resources across different spatial scales. We first document the diets of three sympatric hornbill species: great hornbill Buceros bicornis Linn., wreathed hornbill Rhyticeros undulatus del Hoyo & Collar and the rufous-necked hornbill Aceros nipalensis Hodgson and compare their visitation rates and visit lengths at fruiting trees. The wreathed hornbill is known to breed in low-elevation forest sites (Datta Reference DATTA2001, Datta & Rawat Reference DATTA and RAWAT2003) and move to mid and higher elevation forests in the non-breeding season (Naniwadekar & Datta Reference NANIWADEKAR and DATTA2013), while the great and rufous-necked hornbill do not move over elevational gradients (Datta & Rawat Reference DATTA and RAWAT2003, Datta Reference DATTA2009, Naniwadekar & Datta Reference NANIWADEKAR and DATTA2013). We considered resource tracking by the three hornbill species at three spatial scales: (1) at the largest scale of the study area (~15 km2) where we examined temporal variation in fruit and hornbill abundance over 2 y; (2) intermediate scale: given that there could be variation in fruit availability within the 15-km2 study area, we investigated if hornbill abundance was positively associated with fruit abundance by estimating fruit availability and hornbill encounter rates in eight systematically distributed patches of 3 ha within the 15-km2 study area; and (3) at the smallest scale of individual fruiting trees, where we examined the relationship between fruit crop size and hornbill visitation patterns. We hypothesized that (1) the wreathed hornbill which moves seasonally between elevations is likely to track fruit resources at a relatively larger spatial scale, while (2) the great hornbill and the rufous-necked hornbill that are seen year-round were expected to track resources at smaller scales. Given that sympatric hornbills exhibit dietary differences, we also expected that spatio-temporal variation in abundances of hornbill species would be better explained by the variation in availability of fruits that dominate their diets.
STUDY AREA AND STUDY SPECIES
Our study was conducted between November 2009–February 2012 on a 15-km2 plateau (550–800 m asl) in the western part of the Namdapha Tiger Reserve (27°23′30′′–27°39′40′′N, 96°15′2′′–96°58′33′′E; 1985 km2) in Arunachal Pradesh in north-east India (Figure 1). The tropical forests of the plateau are dominated by Altingia excelsa Noronha, Shorea assamica Dyer, Terminalia myriocarpa Van Heurck & Müll. Arg., Schima wallichii Choisy, Beilschmiedia assamica Meisn., Castanopsis spp. and Saprosma ternatum (Wall.) Hook.f. Four of the five hornbill species in Namdapha: the great hornbill (112–150 cm; 2155–3400 g), rufous-necked hornbill (99–122 cm; 2270–2500 g), wreathed hornbill (84–117 cm; 1360–3650 g) and the white-throated brown hornbill (73–80 cm; 710–900 g) occur on the plateau. The Oriental pied hornbill Anthracoceros albirostris Shaw & Nodder (60–85 cm; 500–907 g) is seen mostly in degraded secondary forests and was rarely recorded on the plateau. Our paper focuses on the three larger hornbill species for which we had adequate foraging observations. Hornbill densities were relatively high in the study area, although they fluctuate over time (Naniwadekar & Datta Reference NANIWADEKAR and DATTA2013). The breeding season of hornbills in the area is from April to August (Datta Reference DATTA2009) and our study was carried out in the non-breeding season (November–March).

Figure 1. Map of the intensive study area where the fruit tree watches were conducted in the Namdapha Tiger Reserve. Eight trails that were monitored from 2010–2012 are also shown.
METHODS
Sampling design
The study was carried out at three spatial scales: (1) at the largest scale where we documented the variation in fruit availability and hornbill encounter rates over 2 y in the non-breeding season in the intensive study area spread over ~15 km2; (2) at the intermediate scale, where we investigated the influence of variation in fruit availability across different sites (3 ha) within our intensive study area on hornbill encounter rates; and (3) at the smallest scale, we investigated the influence of variation of ripe fruit crop size on visitation rates of great, wreathed and rufous-necked hornbill on fig and non-fig trees separately. The study objectives required documenting the diets of the three hornbill species. The data at the largest scale signifies the dynamics of fruit availability in the mid-elevation forests (500–800 m asl). However, even within the mid-elevation forests, variation in fruit availability can be expected between different sites or patches, which is captured at the intermediate scale (eight patches of 3 ha each) and at the level of individual fruiting trees which is captured at the smallest scale.
Hornbill diet
We determined hornbill diet using the time-constrained search technique and through observations during trail walks. In the time-constrained search technique, we started early in the morning before sunrise (5h00–10h00) and in the late afternoons (12h00–16h00) and searched for hornbills either through their calls or walking on different animal or hunting trails spread across the intensive study area until the animal was heard calling or seen. These trails are spread all across the intensive study area enabling us to collectively sample the entire study area. On sighting a hornbill that was feeding, species identity of hornbill and the food plants along with time was recorded. The effort invested in these searches was 90 h spread across 35 searches in 2009–2010 and 270 h spread across 92 searches in 2010–2011. In addition, to this, we established two trails (length = 2 km) in 2009–2010 and eight trails (1.5 km) later in 2010–2011 which were monitored regularly (72 km in 2009–2010 and 232.5 km in 2010–2011) during early morning (around sunrise) and in the late afternoons (four hours before sunset). In the first year, the two trails almost covered the entire length of the intensive study area. In the second year, the eight trails were spaced 500 m apart so as to ensure that the entire study area was evenly covered. The two trails that were monitored in 2009–2010, were not monitored in the next year. During the trail walks, when we detected hornbills while feeding, we noted the species identity of hornbill(s) and the food plant.
Fruit availability and hornbill abundance at the largest scale
Prior observations had indicated that the wreathed hornbill visits the middle-elevation intensive study area only seasonally. A contrasting finding from the lowland forest areas indicating that the wreathed hornbill moves out of the lowland areas and visits higher areas had been obtained from a site further west of our intensive study site. To assess whether hornbills were tracking fruit availability at the scale of our entire study site, we assessed the temporal variability (monthly variability) in fig and non-fig fruit availability on the plateau during the non-breeding season of hornbills. This entailed estimating three parameters that include density of food plants, proportion of trees in fruit at different time intervals (month in our case) and the average fruit crop size on trees in fruit at different time intervals (month in our case). To this end, we monitored 68 individuals of eight hornbill food plant species in 2009–2010 and 67 individuals of nine hornbill food plant species in 2010–2011 (Ficus drupacea Thunb. was additionally monitored). For five species (Beilschmiedia assamica, Canarium strictum Roxb., Machilus duthiei King, Ficus geniculata Kurz, Dysoxylum sp.), we monitored 10 individuals each and 3–7 individuals for Ficus drupacea, Chionanthus sp., Prunus ceylanica (Wight) Miq., Ficus altissima Blume. These nine species were represented in 91.5% of the total number of foraging observations (N = 234) during time-constrained searches and line-transect surveys, while an additional five tree species made up the remaining foraging observations. The fruit size and maximum fruit crop size recorded for each of the nine species has been provided in Appendix 1. These nine species were monitored monthly from November–March in 2009–2011. For non-fig trees, we estimated fruit crop sizes by visually dividing the canopy into four quarters and counting the number of fruits in one quarter to estimate tree fruit crop size following Davidar & Morton (Reference DAVIDAR and MORTON1986). For figs, we estimated fruit crop size on a logarithmic scale (1, 10, 100, 1000 and so on) following Kinnaird & O’Brien (Reference KINNAIRD and O’BRIEN2007). This allowed us to estimate proportion of trees in fruit in each month and determine the average fruit crop sizes for different months for each of the different species. We estimated the density of each of the nine food plant species on the plateau using eight belt transects (1500 × 20 m) along the trails that were sampled for hornbills (Figure 1). For estimating fruit availability of food plants for each of the 10 mo over the 2 y (November 2009–March 2010 and November 2010–March 2011), we summed the resampled (with replacement) estimated fruit availability across all the food plant species during each resample and took the median of 1000 resamples. For each species, fruit availability in each resample was estimated by multiplying randomly drawn values for tree density, proportion of trees fruiting and the fruit crop size for the respective months. We tested whether tree density was normally distributed using the Shapiro–Wilk test. The null hypothesis tests whether data are normally distributed. The results of the test are W = 0.995, P = 0.209 indicating that the null hypothesis cannot be rejected. Random values for tree density were drawn with mean and standard deviation for each food plant species as determined using belt transects. Random values for proportion of trees fruiting were determined using binomial distribution for the number of trees monitored for each species and proportion of trees that were fruiting in each month. Random values for fruit crop size were determined using a Poisson distribution with mean fruit crop size for each species estimated by averaging the fruit crop sizes of trees that were in fruit for that month. We estimated the fruit availability for figs and non-fig species separately. For figs, we estimated fruit availability for two species in 2009–2010 and for three species in 2010–2011.
We monitored abundance of the three large hornbill species (great, wreathed and rufous-necked) along two trails in 2009–2010 and eight trails in 2010–2011. Our sampling effort was 72 km in 2009–2010 and 232.5 km in 2010–2011. One or two observers walked the trails in the mornings (05h45–10h30) and afternoons (12h00–16h00) and recorded hornbill species identity, number of individuals seen during the walk and perpendicular distance of each of the sightings following standard line-transect protocol (Buckland et al. Reference BUCKLAND, ANDERSON, BURNHAM and LAAKE2003). We did not obtain sufficient monthly detections for each species for each of the eight different trails; therefore, we did not use density estimates for the hornbill species. As the study was conducted in a homogeneous habitat, we do not expect variation in detection probability across the different trails. We estimated the mean and bootstrapped 95% confidence intervals (CI) of encounter rates of the three hornbill species for each month and used it as an index of their abundance. At the largest scale, we did not use any statistical tests to detect association between fruit availability and hornbill encounter rates because of sample size limitations. We visually explored the patterns of fruit availability and hornbill encounter rates.
Fruit availability and hornbill abundance at the intermediate scale
Within our intensive study area, there was considerable variation in the abundance of fruiting trees (Naniwadekar Reference NANIWADEKAR2014). To examine whether hornbill abundances varied locally as a function of the variation in fruit availability within the intensive study area, we collected information on abundance of hornbill food plant species ≥ 30 cm gbh and hornbills along the entire length of the eight trails that were all monitored in 2010–2011 only. Fruit availability for each month from November to March was obtained by integrating information on densities of trees along each trail, proportion of trees for each of the different species that were in fruit for the particular month and the average fruit crop size of the fruiting trees for the respective month. Data on the proportion of trees fruiting was collected by monitoring 69 individual trees across nine species in 2010–2011 between November–March. Mean fruit crop size for non-fig species for each month was estimated by visually dividing the canopy into four quarters and counting the number of fruits in one quarter to estimate tree fruit crop size following Davidar & Morton (Reference DAVIDAR and MORTON1986). For figs, we estimated fruit crop size on a logarithmic scale (1, 10, 100, 1000 and so on) following Kinnaird & O’Brien (Reference KINNAIRD and O’BRIEN2007). We therefore estimated fruit availability along each trail for each of the 5 mo (November–March) by multiplying data on number of trees along each trail with data obtained from tree monitoring that included proportion of trees fruiting and the mean fruit crop size for each month. We estimated fruit availability for figs and non-figs separately. Hornbill encounter rates were estimated for each month for each of the eight trails from November 2010–March 2011. The total effort across the eight trails was 232.5 km. These trails were walked in the early mornings and late evenings following standard line-transect protocol. On sighting hornbills, species identity, number of individuals and the perpendicular distance from the centre point of the flock to the trail was recorded using a laser range finder.
We used Generalized Linear Mixed-effect Models (GLMM) with Poisson errors to understand the relationship between counts of hornbills visually sighted along each trail and the fig and non-fig fruit availability separately. There were differences in counts of hornbills across the 5 mo and across the different trails, therefore, we incorporated effects of month and trail as random effects in the model. We defined a candidate set of four models with two predictor variables (natural log of fig and non-fig fruit availability) used singly and in conjunction (Johnson & Omland Reference JOHNSON and OMLAND2004). The candidate set also included an only-intercept model without any predictor for evaluating the influence of predictors on the response variable. The GLMM with trail and month as random effects and fig and non-fig fruit availability as fixed effects indicated over-dispersion in the data. We, therefore, incorporated effects of individual observations as an additional random effect in the model following Elston et al. (Reference ELSTON, MOSS, BOULINIER, ARROWSMITH and LAMBIN2001). We used the Information-theoretic framework for optimal model selection (Burnham & Anderson Reference BURNHAM and ANDERSON2002). The model with the least AICc (Akaike Information Criterion corrected for small sample size) value was chosen as the optimal model (Burnham & Anderson Reference BURNHAM and ANDERSON2002).
Hornbill visitation at the scale of the individual fruiting tree
Apart from the variation in fruit availability across sites, there was also considerable variation in fruit availability on individual trees. To assess whether hornbills responded to fruit availability on a fruiting tree within our intensive study area, we conducted 55 fruit tree watches under fruiting fig (N = 22; four species) and non-fig (N = 33; 10 species) trees for 255 h. These were conducted in both years (2010–2012) from November–March. We observed trees in the morning (05h20–11h00) and in the afternoon (12h30–15h45) sitting just beyond the canopy to obtain a clear view of the tree. We abandoned a watch if it rained or if there was disturbance due to human movement. At the start of each watch, we counted the number of ripe fruits on focal trees. We recorded hornbill species, number of individuals and their arrival and departure times from the focal tree. Hornbill abundances in the study area varied across the months (Naniwadekar & Datta Reference NANIWADEKAR and DATTA2013), which could influence visitation rates on fruiting trees. For the wreathed hornbill, their densities ranged from more than 68 birds km−2 in November to around 1 bird km−2 in March (Naniwadekar & Datta Reference NANIWADEKAR and DATTA2013). We thought the abundance of the hornbills in the intensive study area could influence their visitation rates on the fruiting trees. Therefore, we used ambient hornbill encounter rates (as estimated for each month) for each species as an index for hornbill abundance in the study site for that particular month. We assumed that encounter rates estimated for a month reflected the ambient hornbill abundance. Given that we did not have sufficient detections of each species for estimating month-wise densities on each trail, we used encounter rates instead of density estimates. The detection probability in our homogeneous evergreen forest site is unlikely to vary as a function of time; therefore, encounter rate would be a good indicator of the hornbill abundance in the area. This measure was used as a predictor for a fruit tree watch that was conducted on a single day. Two trails were monitored in 2009–2010 (effort = 72 km), eight trails were monitored in 2010–2011 (effort = 232.5 km) and 2011–2012 (effort = 144 km). The mean ± SE effort was 32.3 ± 5.6 km mo−1. Based on the month in which the fruit tree watch was carried out, we used the corresponding estimate of the encounter rate of the particular hornbill species for that month.
We compared visitation rates of each of the three hornbill species on figs and non-figs separately. We carried out separate analyses for the fruiting figs and non-figs as they differed in fruit crop size and seed size. We used mixture models to determine the role of fruit crop size and ambient hornbill encounter rates on visitation patterns of the three hornbill species on fruiting fig and non-fig trees. We used mixture models due to the presence of excess zeroes in hornbill visitations on fruiting trees. In mixture models, the zeroes are modelled from the count and the binomial process (Zuur et al. Reference ZUUR, IENO, WALKER, SAVELIEV and SMITH2009). We defined four candidate models with two predictor variables: natural logarithm of the fruit crop size and ambient hornbill encounter rates and an intercept-only model. We evaluated these four candidate models with mixture models with Poisson and negative-binomial error structure and ranked them using AICc. We estimated model-averaged coefficients. We interpreted those coefficients for which the 95% confidence intervals did not overlap with zero. We carried out this analysis for all the three hornbill species on fruiting fig trees. For non-fig trees, we carried out the analysis only for the rufous-necked hornbill since we had limited sightings on non-figs for the other two species (great hornbill: 5, wreathed hornbill: 7). All the analyses were carried out in R (ver. 3.01). We used the packages ‘lme4’ (lme4: Linear mixed-effects models using S4 classes, R package version 0.999999–0), ‘pscl’ (Zeileis et al. Reference ZEILEIS, KLEIBER and JACKMAN2007), and ‘MuMIn’ (Multi-model Inference. Ver. 1.9.5.) for generalized mixed-effects modelling, mixture modelling and model averaging respectively.
RESULTS
Hornbill diet
We identified 20 tree species belonging to seven families in the non-breeding season diet of hornbills. Lauraceae and Moraceae had the highest representation (Appendix 2). Great and wreathed hornbills were seen foraging on nine and 10 species respectively. Rufous-necked hornbill was recorded foraging on 17 species (Appendix 2). The standardized Levin's niche breadth for the rufous-necked hornbill (0.61) was more than 1.5 times that of the wreathed (0.37) and more than twice that of the great hornbill (0.30). Of the total foraging observations on fruits, mean proportion of sightings of wreathed hornbill feeding on non-fig fruits was 2.5 times higher than that on figs (Figure 2). On the other hand, mean proportion of sightings of great hornbill feeding on figs was almost 10 times that on non-fig fruits (Figure 2). While the mean proportion of sightings of rufous-necked hornbill feeding on non-fig fruits was 1.4 times greater than that of fig fruits, the 95% CI overlapped (Figure 2). The great hornbill was observed foraging for insects on two occasions.
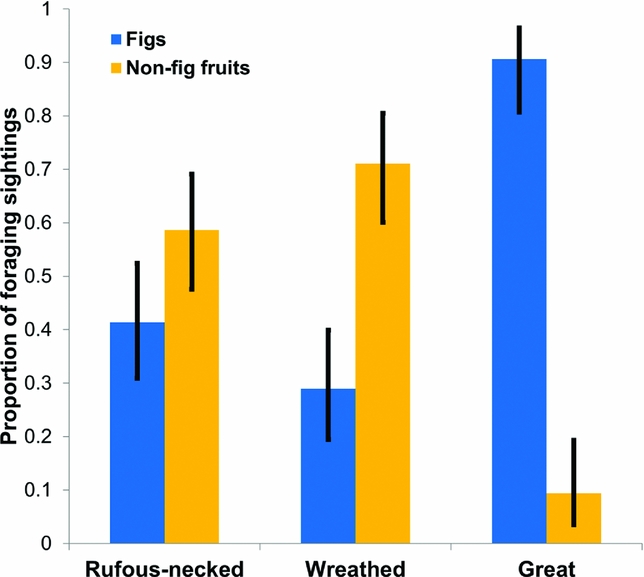
Figure 2. Binomial means and 95% confidence intervals of proportion of foraging sightings of the rufous-necked hornbill Aceros nipalensis, wreathed hornbill Rhyticeros undulatus and great hornbill Buceros bicornis on fig receptacles and non-fig fruits in the Namdapha Tiger Reserve.
Fruit availability and hornbill abundance at the largest scale
We recorded 13 species of non-fig hornbill food plants in the belt transects. Mean ± SE densities ranged from 0.04 ± 0.04 trees ha−1 for Canarium strictum and Aglaia sp. to 2.5 ± 0.8 trees ha−1 for Beilschmiedia assamica. The total density of all non-fig hornbill food plant species was 5.7 ± 2.4 trees ha−1. The boot-strapped median (interquartile range) fruit availability of non-fig fruits ranged from 57 (19–111) to 450 (223–753) fruits ha−1 in 2009–2010 and 1 (0–39) to 408 (226–619) fruits ha−1 in 2010–2011 (Figure 3c, d). The highest median value for non-fig fruit availability (six species) was in November in 2009–2010 and in December in 2010–2011. The mean (± SE) densities of three fig species (Ficus geniculata, Ficus altissima and Ficus drupacea) that accounted for 95% of all foraging observations on figs ranged from 0.2 ± 0.1 to 0.4 ± 0.2 trees ha−1. The total density of these three fig species was 0.8 ± 0.4 trees ha−1.

Figure 3. Natural logarithm of resampled (n = 1000 resamples) estimates of fruit availability of fig tree species. Two species in 2009–2010 (a); three fig tree species in 2010–2011 (b) and six non-fig tree species from November to March of 2 y (2009–2011) (c, d). These nine tree species constituted 91% of the total foraging sightings of hornbills in the Namdapha Tiger Reserve.
Median (interquartile range) fruit availability of two species of fig ranged from 0 to 119700 (20650–232300) fig receptacles ha−1 between November 2009–March 2010 and from 0 to 327500 (12390–785400) fig receptacles ha−1 for three species of figs between November 2010 and March 2011 (Figure 3a, b). In both years, the highest median value of fig availability was in December (Figure 3a, b).
Hornbill encounter rates differed between years (2009–2010 and 2010–2011) and species. Wreathed hornbill mean encounter rates declined from December to April consistently following a similar trend to fruit availability in both years (Figure 4c, d). Mean encounter rates of rufous-necked and great hornbills declined from December to April in 2009–2010 but not in 2010–2011 (Figure 4a, b, e, f).

Figure 4. Mean and bootstrapped 95% confidence intervals (n = 1000 bootstraps) of the encounter rates of the rufous-necked hornbill Aceros nipalensis (a, b), wreathed hornbill Rhyticeros undulatus (c, d) and great hornbill Buceros bicornis (e, f), from December to March for 2 y (2009–2011) in the Namdapha Tiger Reserve.
Fruit availability and hornbill abundance at the intermediate scale
There was considerable variation in hornbill detections over space and time. We did not detect any relationship between great hornbill abundance and availability of either figs or non-figs. The intercept-only model was the one with the least AICc value (Table 1, Appendix 3). The 95% CI on the estimates of both fig and non-fig fruit availability overlapped zero (Table 2). However, for the wreathed hornbill, the model with non-fig fruit availability had the least AICc value (Table 1, Appendix 3). We found a positive relationship between non-fig fruit availability and wreathed hornbill abundance. The 95% CI on the estimate of non-fig fruit availability did not overlap zero and its relative variable importance value was 0.69 (Table 2). For one-unit increase in natural log of non-fig fruit availability, the expected log count of wreathed hornbill encounters increased by 0.7 (Table 2). The model with non-fig fruit availability had the least AICc value for the rufous-necked hornbill (Table 1, Appendix 3). However, the abundance of rufous-necked hornbill was negatively associated with non-fig fruit availability indicating that the rufous-necked hornbill occurred less in areas that had greater availability of non-fig fruits (Table 2).
Table 1. Summary of the results of the analysis carried out at the intermediate scale (different sites within study area) and small scale (fruiting fig/non-fig tree) in the Namdapha Tiger Reserve, north-east India. At the intermediate scale, Generalized Linear Mixed-effect Models (GLMM) were used to investigate if fruit availability explained the variation in hornbill encounter rates between eight sites of 3 ha each separated by 500 m within the study area. At the smallest scale of individual fruiting trees, Zero-inflated Poisson/Zero-inflated Negative Binomial Models (ZIP/ZINB) were used to evaluate whether ripe fruit crop size and ambient encounter rates of hornbills explained the variation in visitation rates of different hornbill species on figs and non-figs separately. The analysis was carried out separately for the great hornbill Buceros bicornis (GH), wreathed hornbill Rhyticeros undulatus (WH) and rufous-necked hornbill Aceros nipalensis (RNH). ‘na’ indicates ‘not applicable’ because the analysis was not carried out (not examined) or if the 95% CIs on the coefficients of the predictors overlapped zero.

Table 2. Model-averaged coefficients, their associated 95% CI and the relative variable importance values for models examining the relationship between hornbill abundance and fig and non-fig fruit availability for the great hornbill Buceros bicornis, wreathed hornbill Rhyticeros undulatus and the rufous-necked hornbill Aceros nipalensis in the Namdapha Tiger Reserve.

Hornbill visitation at the scale of fruiting trees
We detected hornbills in 38 out of 55 fruit tree watches. The great hornbill was detected in 20 fruit tree watches, rufous-necked hornbill in 22 and wreathed hornbill in 18. In the 22 fruit tree watches on figs, we detected hornbills in 20, while we detected hornbills in 18 out of the 33 fruit tree watches on non-fig trees. The rufous-necked hornbill was detected on 11 of the 14 species observed while wreathed and great hornbills were detected on nine species each. The visitation rates of rufous-necked hornbill and wreathed hornbill on both figs and non-fig trees were similar (Figure 5) while the visitation rate of great hornbill was higher on figs than on non-fig trees (Figure 5). The median visitation length of great hornbill on figs was 21 min (range: 2–192 min, N = 50), 26 min for rufous-necked hornbill (range: 2–74 min, N = 24) and 23 min for wreathed hornbill (range: 1–73 min, N = 67). The median visitation length of great hornbill on non-fig trees was 17 min (range: 2–24 min, N = 11), 10 min for rufous-necked hornbill (range: 1–45 min, N = 20) and 45 min for wreathed hornbill (range: 2–81 min, N = 55).
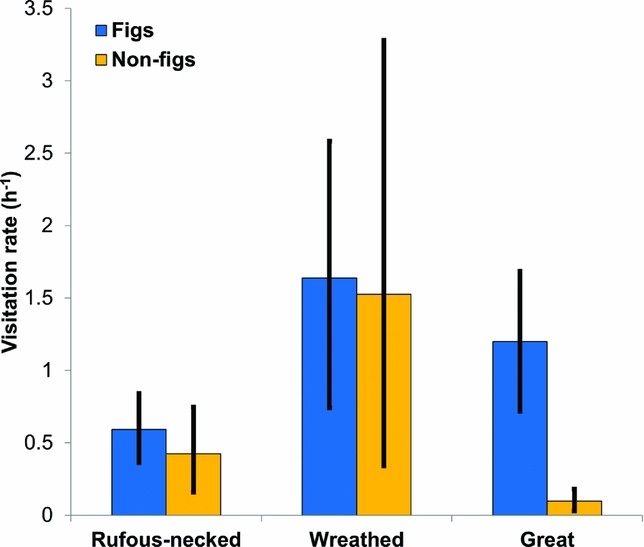
Figure 5. Mean and bootstrapped 95% confidence intervals (n = 1000 bootstraps) of the visitation rates (birds h−1) of the rufous-necked hornbill Aceros nipalensis, wreathed hornbill Rhyticeros undulatus and great hornbill Buceros bicornis for fruiting fig and non-fig tree species in the Namdapha Tiger Reserve.
Amongst the fruiting trees that were visited by the great hornbill, visitation rate of great hornbill on figs was positively associated with ripe fruit crop size. The top two models within 2 ΔAICc units both had fruit crop size as the only predictor (Appendix 4). The relative variable importance of ripe fruit crop size of figs was 0.84 (Table 3). The 95% CI on the estimate also did not overlap zero (Table 3). For one-unit increase in natural log of ripe fig crop size, the expected log count of great hornbill visitations increased by 0.23 (Table 3). However, the 95% CI of the correlation coefficient of the observed and predicted values of the model overlapped zero (r = 0.38, 95% CI = −0.05–0.69). Visitation rates of wreathed and rufous-necked hornbills were not associated with ripe fig fruit crop size (Table 3). The intercept-only models were the top models with the least AICc value (Appendix 4). Ripe fruit crop size of figs had a relatively low variable importance (< 0.35) and the 95% CI on the estimate for the ripe fruit crop size also overlapped zero for wreathed and rufous-necked hornbills (Table 3). For non-fig fruiting trees, visitation rate (the non-zero part) of the rufous-necked hornbill was positively associated with ripe fruit crop size. The model with the least AICc value was the one with fruit crop size as the predictor (Appendix 5). The model-averaged weight of the fruit crop size was 0.56 and the 95% CI on the estimate of fruit crop size also did not overlap zero (Table 3). For one-unit increase in natural log of ripe non-fig fruit crop size, the expected log count of rufous-necked hornbill visitations increased by 0.59 (Table 3). However, the 95% CI of the correlation coefficient of the observed and predicted values of the model overlapped zero (r = −0.14, 95% CI = −0.46–0.21).
Table 3. Model-averaged coefficients, their associated 95% CI and the relative variable importance values of the two predictors for models examining visitation rates of the great hornbill Buceros bicornis, wreathed hornbill Rhyticeros undulatus and rufous-necked hornbill Aceros nipalensis as a function of ambient hornbill encounter rates and/or ripe fruit crop size (natural logarithm) for two different fruit types (fig and non-fig trees) in the Namdapha Tiger Reserve. Analysis for great and wreathed hornbill visitation rates on non-fig fruiting trees was not carried out due to limited detections.

DISCUSSION
In order to examine resource tracking in a frugivore assemblage, it is necessary that fruits contribute predominantly to the diet of the species, and that fruit production data are comprehensive and include all the species that can potentially play an important role in the diet (Guitian & Munilla Reference GUITIAN and MUNILLA2008). Our study met both these assumptions, as hornbills are highly frugivorous and our observations included food plant species that comprised more than 90% of the diet of the three species.
We found that the sympatric hornbill species differed in the spatial scale at which they tracked shared resources. Resource tracking was associated with their respective diets. Species having a greater representation of figs in their diet (great hornbill) tracked fig fruit availability, while species with greater representation of non-figs in their diet (wreathed and rufous-necked hornbill) tracked non-fig fruit availability, albeit at different scales. However, given the weak relationship between the observed and predicted values, it is likely that other unaccounted variables also influenced the observed relationships.
The wreathed and rufous-necked hornbill, which have similar body size and diets, showed contrasting patterns of fruit resource tracking. While the wreathed hornbill travels large distances in search of fruit resources incurring greater energy costs, the rufous-necked adopts a more sedentary strategy as a trade-off between energy costs of travelling large distances and patch foraging efficiency as suggested by Kotler & Brown (Reference KOTLER and BROWN1988). The rufous-necked hornbill tracked non-fig fruit availability at the scale of the fruiting tree, while the wreathed hornbill responded to temporal fluctuation in fruit availability at the largest scale examined (15-km2 study site). At the intermediate scale, wreathed hornbill abundance was positively associated with non-fig fruit availability. However, rufous-necked hornbill abundance was negatively associated with non-fig fruit availability at the intermediate scale. The rufous-necked hornbill does not show seasonal movements and is known to remain resident in smaller home ranges (Tifong et al. Reference TIFONG, CHIMCHOME, POONSWAD and PATTANAVIBOOL2007). It is possible that the rufous-necked hornbill which tracks fruit resources locally increases its foraging efficiency by feeding on a greater diversity of fruits as can be seen from its wider dietary niche breadth compared with that of the wreathed hornbill.
There are no records of the wreathed hornbill breeding in Namdapha, and our long-term abundance data indicate that this species leaves Namdapha prior to the onset of the breeding season in March (Datta Reference DATTA2009, Naniwadekar & Datta Reference NANIWADEKAR and DATTA2013), possibly moving to adjoining low-elevation forests outside for breeding. The wreathed hornbill is known to breed in lower-elevation (100–400 m asl) forests (Datta Reference DATTA2009, Datta & Rawat Reference DATTA and RAWAT2004). During the non-breeding season, fruit availability in lower-elevation forests is low (Datta & Rawat Reference DATTA and RAWAT2003). The peak fruit availability in our study area (500–800 m asl) in mid-elevation forests was in November–December which is the non-breeding season for hornbills. This was the period of high abundance of wreathed hornbill at middle elevations. Both non-fig ripe fruit abundance and wreathed hornbill abundance in mid-elevation forest declined by March. Therefore, the wreathed hornbill appears to track fruit resources at the largest scale, by ranging over a large area, selecting areas with high fruit availability. For the rufous-necked and great hornbill, we did not record evidence for resource tracking at the largest scale. The rufous-necked hornbill is resident and breeds in Namdapha (Datta Reference DATTA2009) but there are no reports of it breeding in lower-elevation areas.
While we documented similar overall trends in the fig fruit availability across the 2 y (except in November), bird-consumed figs are generally known to have asynchronous fruiting (Shanahan et al. Reference SHANAHAN, SO, COMPTON and CORLETT2001). The great hornbill mainly consumes figs which have asynchronous and unpredictable fruiting patterns. Therefore, the great hornbill is not expected to demonstrate predictable movement patterns across large scales.
Fruit crop size has been known to be an important factor governing visitation rates on fruiting trees (Blendinger & Villegas Reference BLENDINGER and VILLEGAS2011, Blendinger et al. Reference BLENDINGER, LOISELLE and BLAKE2008, Saracco et al. Reference SARACCO, COLLAZO, GROOM and CARLO2005). For a frugivore, selecting trees with larger fruit crop sizes implies reduced need for moving between trees to find fruits thereby saving energy. Kinnaird & O’Brien (Reference KINNAIRD and O’BRIEN2007) reported that hornbills feed on trees with large crop sizes to maximize foraging efficiency. At the smallest scale, we recorded a positive relationship between the visitation rates of great and rufous-necked hornbill on fruiting figs and non-figs, respectively, with the fruit crop size. Both these hornbill species therefore appear more likely to visit trees with larger fruit crop sizes. However, we could not explore the relationship between wreathed and great hornbill visitation on fruiting non-figs due to limited data. For the great hornbill, lower visitation on non-figs is a likely outcome of their dietary preference.
Implications of tracking resources at different scales
Kinnaird & O’Brien (Reference KINNAIRD and O’BRIEN2007) synthesized data on resource tracking by hornbills from several forest sites. They consistently found that hornbills tracked fig availability across these sites. In our study, we found that while some hornbill species track figs, others track non-fig fruit availability at varying scales. Non-fig fruit availability is a resource which is more predictable than figs. The finding that hornbill species track distinct resources at distinct scales has several implications for each of the hornbill species and for the ecological role they play as dispersers.
Firstly, it is likely that the dietary differences and varying abundance patterns at different scales enables the three species to co-occur. One of the mechanisms for co-existence is a trade-off between travel cost and patch foraging efficiency (Kotler & Brown Reference KOTLER and BROWN1988). The wreathed hornbill appeared to follow a strategy of tracking peak resource availability across the altitudinal gradient, avoiding periods of low resource availability. Thus it appeared to trade-off patch foraging efficiency by incurring large travel costs of finding resources across the altitudinal gradient. On the other hand, the rufous-necked hornbill with a diet similar to the wreathed hornbill, appears to reduce travel costs while increasing foraging efficiency by diversifying its diet and selectively foraging on non-fig trees with larger fruit crops.
For the more localized species that continue to remain in the site, periods of low resource availability might have a greater bearing on the densities and flock sizes in which the species can occur. Tracking peak fruit availability across the altitudinal gradient, on the other hand, might allow the wreathed hornbill to occur in high densities and to move in large flocks, as resource abundance would mediate the pressures of intraspecific competition. However, whether resource tracking at such large scales is the cause or the effect of flocking remains unclear.
Tracking different kinds of fruit resource at different scales also has an important bearing on the role played by each of the hornbill species in seed dispersal. The great hornbill had a lower visitation rate on non-fig fruiting trees as compared with the wreathed and rufous-necked hornbill, which implies that this species plays a smaller role in dispersal of non-fig tree species compared with the wreathed and rufous-necked hornbill. The wreathed hornbill is numerically abundant despite being a seasonal visitor (Naniwadekar & Datta Reference NANIWADEKAR and DATTA2013) and therefore seems to play an important quantitative role in seed dispersal. However, the wreathed hornbill disperses seeds of species that fruit during the non-breeding season at the mid-elevation forest site. The rufous-necked hornbill remains in the study area throughout the non-breeding and breeding season (Datta Reference DATTA2009). Thus, the rufous-necked hornbill plays an important role in fruit removal and seed dispersal for non-fig tree species year-round. Additionally, this species consumes fruits of a diverse array of tree species indicating the dispersal of more non-fig species than the wreathed hornbill. Therefore, the differences in diet, dietary niche breadth, abundances, and temporal changes in occurrence of hornbill species suggest that the three sympatric hornbills play a complementary role in seed dispersal.
ACKNOWLEDGEMENTS
This study was funded by the Rufford Small Grants Programme (UK), Critical Ecosystem Partnership Fund in association with Ashoka Trust for Research in Ecology and Environment (Bangalore) and the International Foundation for Science (Sweden). We thank the Arunachal Pradesh Forest Department for granting us permission to conduct the study. We are grateful to Dr Yogesh Singh and Mr S. Jongsam, Field Directors of Namdapha Tiger Reserve and the staff for their support. We are grateful to Japang Pansa, Phupla Singpho, Akhi Nathany, Duchayeh, Ngwayotse and Ngwazakhi and all our field staff for their help and assistance during fieldwork. We thank Navendu Page, Dr K. Haridasan for help with plant identification and Jahnavi Joshi, M. D. Madhusudan, Kavita Isvaran, Soumya Prasad, Kulbhushan Singh Suryawanshi, Anand M. O. and Hari Sridhar for discussions. We thank three anonymous reviewers for their detailed comments, which helped improve the manuscript.
Appendix 1. Fruit lengths and widths (SD) and maximum fruit crop size recorded for the nine species of hornbill food plants which comprised 91.5% of hornbill foraging sightings in the Namdapha Tiger Reserve. For Machilus duthiei and Ficus altissima, data were taken from Flora of China (www.efloras.org).

Appendix 2. Summary of overall hornbill sightings and foraging observations on tree species for the great, wreathed and rufous-necked hornbill during trail walks and searches in the Namdapha Tiger Reserve.

Appendix 3. The structure of the different candidate models and Δ AICc value to identify the influence of fig and non-fig fruit availability on the abundance of great, wreathed and rufous-necked hornbill in the Namdapha Tiger Reserve.

Appendix 4. The structure of the different candidate models along with model type (Zero-inflated Poisson (ZIP) or Zero-inflated Negative Binomial (ZINB)) and Δ AICc value to identify the influence of fruit crop size and ambient hornbill encounter rate on the great, wreathed and rufous-necked hornbill on figs in the Namdapha Tiger Reserve. Analysis for great and wreathed hornbill visitation rates on non-fig fruiting trees was not carried out due to limited detections.

Appendix 5. The structure of the different candidate models along with model type (Zero-inflated Poisson (ZIP) or Zero-inflated Negative Binomial (ZINB)) and Δ AICc value to identify the influence of fruit crop size and ambient hornbill encounter rate on rufous-necked hornbill on non-fig fruiting trees in the Namdapha Tiger Reserve.


