


INTRODUCTION
Biological communication signals can be mutualistic or parasitic, depending on whether the receivers can gain benefits by responding to the signals (honest signalling) or the signals exist at the expense of the receiver (deceptive or dishonest signalling) (Foster & Delay Reference FOSTER and DELAY1998, Galetti Reference GALETTI, Levey, Silva and Galettti2002, Stuart-Fox Reference STUART-FOX2005). However, theory predicts that both honest and dishonest signalling strategies will not always be evolutionarily stable in interspecific communication (Freckleton & Côté Reference FRECKLETON and CÔTÉ2003). Thus, mutualists can become parasitic and vice versa, even in the context of plant–animal interactions: an individual plant may reduce the level of reward to conserve resources without indicating the change in rewards to mutualistic agents. Despite the theoretical prediction, it would be difficult to demonstrate such signalling bimodality in wild animal–plant systems because the transition from mutualistic to parasitic state is expected to be subtle and multimodal (Edwards & Yu Reference EDWARDS and YU2007).
Scaevola taccada is a widely distributing tropical beach plant, whose fruits have an endocarp composed of a cork substrate around the seed, facilitating flotation (Emura et al. Reference EMURA, DENDA, SAKAI and UEDA2014). It is likely that S. taccada seeds are dispersed by ocean currents as well as by frugivorous birds (Emura et al. Reference EMURA, KAWAKAMI, DEGUCHI and SONE2012, Howarth et al. Reference HOWARTH, GUSTAFSSON, BAUM and MOTLEY2003). However, Emura et al. (Reference EMURA, DENDA, SAKAI and UEDA2014) discovered a cryptic dimorphism in the endocarp of this plant: although most plants bear fruit with the cork endocarp (C+), fruits of some individuals consistently lack such a structure (C–), even though both types of fruit have sugar-containing flesh around the seed. It is probable that these morphotypes have adapted alternatively: plants with the C+ fruit disperse seeds broadly through ocean currents (along with avian dispersal), while those with the C– fruit remain relatively localized through avian dispersal.
Despite the difference in assumed advantages of the endocarp types, the fruit colour seems not to differ between them, at least in the human vision (Emura et al. Reference EMURA, DENDA, SAKAI and UEDA2014). The lack of colour differentiation indicates that the fruit colour of C+ plants might relatively be a dishonest signal because of the apparently reduced nutritional contents and increased indigestible substrates. However, whether the fruit colour is actually indiscernible to seed dispersers is unclear, since birds have higher sensitivity to colours than mammals including humans (Endler & Mielke Reference ENDLER and MIELKE2005, Tanaka in press, Vorobyev & Osorio Reference VOROBYEV and OSORIO1998). Therefore, the fruit colour in bird vision must be examined to determine whether seed-dispersing birds can distinguish between the colours of C+ fruits and C– fruits.
We focused on the dissimilarity in colour between fruits and leaves, as well as fruits of S. taccada morphotypes. The contrast in colour between fruits and leaves should be a key attractant for seed-dispersing birds, because perceived colour of an object is in principle its contrast against the background colour (Koshitaka et al. Reference KOSHITAKA, KINOSHITA, VOROBYEV and ARIKAWA2008, Osorio & Vorobyev Reference OSORIO and VOROBYEV1996, Vorobyev & Osorio Reference VOROBYEV and OSORIO1998). To avoid C+ fruits, seed-dispersing birds should memorize the fruit colour against the leaf background (i.e. fruit-leaf contrast) because the endocarp morphotypes are consistent within individual plants, and birds should move to another plant to encounter fruits of the C– morphotype. Therefore, great dissimilarity in fruit-leaf contrast between morphotypes is essential for S. taccada to establish an honest signal. We hypothesized that the fruit colour of S. taccada will be a dishonest signal if the colour contrasts of fruits against the leaf background are indistinguishable between morphotypes in the vision of potential seed-dispersing birds, and tested it through the avian visual model.
MATERIALS AND METHODS
Study species
Scaevola taccada (Gaertn.) Roxb. is a coastal shrub, distributing widely in tropical and subtropical Indo-Pacific coastal lands, from East Africa to Oceania and Japan. The cork substrate of the endocarp facilitates flotation, as fruits with the cork endocarp float for more than 6 mo while fruits without cork sink relatively rapidly, i.e. within 1 wk (Emura et al. Reference EMURA, DENDA, SAKAI and UEDA2014). The endocarp dimorphism might serve as an alternative strategy of seed dispersal within the same species, since a considerable rate of gene flow between individuals of the two morphs has been detected (Emura et al., unpubl. data).
The size of the indigestible part of C+ fruits is 6.61 mm in diameter, whereas the one for C– is 3.93 mm due to the lack of cork endocarp (Emura et al. Reference EMURA, DENDA, SAKAI and UEDA2014). This size difference results not only in a 10% reduction in the volume of digestive pulp in C+ fruits, but also in an almost five times greater volume of the indigestible part of C+ than that of C–, 0.15 ml for C+ and 0.031 ml for C–, assuming spherical shapes (i.e.  $\frac{4}{3}\pi r^3$ where r =
  $\frac{{{\rm diameter}}}{2}$). Moreover, the pulp of C+ fruits contains more water than that of C– (Emura et al., unpubl. data), suggesting a much lower nutritional reward to seed dispersers than the one expected by the structural difference between morphotypes. Therefore, the total amount of reward a C+ fruit provides to birds should be less than that of the C– type, and simultaneously, the amount of indigestible substrate should be greater despite the lack of difference in external sizes (Emura et al. Reference EMURA, DENDA, SAKAI and UEDA2014).
Three fruits and leaves of S. taccada were collected from each of 49 individuals (C+: C–, N = 24: 25) in four adjacent sites: Cape Zanpa (26°07′05″N, 127°12′14″E), N = 30 plants (C+: C– = 5: 25); Ikei Island (26°06′07″N, 127°16′08″E), N = 12 (C+: C– = 12: 0); Coast on Kim Bay (26°06′09″N, 127°15′01″E), N = 4 (C+: C– = 4: 0); Yabuchi Island (26°05′06˝N, 127°15′05″E), N = 3 (C+: C– = 3: 0), all located on the main island of Okinawa, Japan. The total numbers of fruits and leaves were both n = 147. To avoid decaying, after these samples were collected in August 2014, they were maintained at ambient temperatures, transported by air to Tokyo, and measured, all within several days.
Measurement
Reflectance spectra of fruits and leaves were measured using a spectrophotometer (Jaz-EL-200, Ocean Optics, Dunedin, FL, USA) with light irradiated by a deuterium-tungsten-halogen light source (DT-MINI-2-GS, Ocean Optics, Dunedin, FL, USA). Before and during measurements, the spectrometer was calibrated (light/dark) using a diffuse reflectance standard (WS-1, Ocean Optics, Dunedin, FL, USA). Fruits and leaves were placed in a black box during measurements. We repeated measurements three times for each fruit/leaf, in different sections for each measurement (n = 441). The total number of measured reflectance spectra was n = 882.
We first calculated photon captures Qi by the ultraviolet-, short-, medium- and long-wavelength-sensitive single-cones (or UVS, SWS, MWS and LWS, respectively), as well as by the double-cone, with the measured reflectance R(λ) and photoreceptor sensitivity Ci(λ),
 \begin{equation*}
Q_i = \int_{300}^{700} {R(\lambda )} C_i (\lambda ).
\end{equation*}
\begin{equation*}
Q_i = \int_{300}^{700} {R(\lambda )} C_i (\lambda ).
\end{equation*}
The single- and double-cone sensitivity of the blue tit Cyanistes caeruleus (Hart et al. Reference HART, PARTRIDGE, CUTHILL and BENNETT2000) with its cone abundance (Hart Reference HART2001) were adopted because observed seed dispersers of the plant are the blue rock-thrush Monticola solitarius (Emura et al. Reference EMURA, KAWAKAMI, DEGUCHI and SONE2012) and the brown-eared bulbul Hypsipetes amaurotis stejnegeri (Kawakami et al. Reference KAWAKAMI, MIZUSAWA and HIGUCHI2009), both of which are classified as Passerida, and thus, likely to have the UVS (ultraviolet sensitive) vision (Ödeen et al. Reference ÖDEEN, HÅSTAD and ALSTRÖM2011).
We then calculated the JND (just noticeable difference), a discrimination threshold between a given pair of colours, from their photon captures based on the Vorobyev–Osorio model (Vorobyev & Osorio Reference VOROBYEV and OSORIO1998): JNDs were obtained from
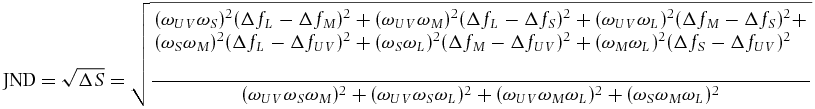 \begin{equation*}
{\rm JND} = \sqrt {\Delta S} = \sqrt {\frac{\begin{array}{l}
(\omega _{UV} \omega _S )^2 (\Delta f_L - \Delta f_M )^2 + (\omega _{UV} \omega _M )^2 (\Delta f_L - \Delta f_S )^2 + (\omega _{UV} \omega _L )^2 (\Delta f_M - \Delta f_S )^2 + \\
(\omega _S \omega _M )^2 (\Delta f_L - \Delta f_{UV} )^2 + (\omega _S \omega _L )^2 (\Delta f_M - \Delta f_{UV} )^2 + (\omega _M \omega _L )^2 (\Delta f_S - \Delta f_{UV} )^2 \\
\end{array}}{{(\omega _{UV} \omega _S \omega _M )^2 + (\omega _{UV} \omega _S \omega _L )^2 + (\omega _{UV} \omega _M \omega _L )^2 + (\omega _S \omega _M \omega _L )^2}}}
\end{equation*}
\begin{equation*}
{\rm JND} = \sqrt {\Delta S} = \sqrt {\frac{\begin{array}{l}
(\omega _{UV} \omega _S )^2 (\Delta f_L - \Delta f_M )^2 + (\omega _{UV} \omega _M )^2 (\Delta f_L - \Delta f_S )^2 + (\omega _{UV} \omega _L )^2 (\Delta f_M - \Delta f_S )^2 + \\
(\omega _S \omega _M )^2 (\Delta f_L - \Delta f_{UV} )^2 + (\omega _S \omega _L )^2 (\Delta f_M - \Delta f_{UV} )^2 + (\omega _M \omega _L )^2 (\Delta f_S - \Delta f_{UV} )^2 \\
\end{array}}{{(\omega _{UV} \omega _S \omega _M )^2 + (\omega _{UV} \omega _S \omega _L )^2 + (\omega _{UV} \omega _M \omega _L )^2 + (\omega _S \omega _M \omega _L )^2}}}
\end{equation*}
for hue, and
 \begin{equation*}
{\rm JND} = \Delta S = \left| {\frac{{\Delta f_D}}{{\omega _D}}} \right|
\end{equation*}
\begin{equation*}
{\rm JND} = \Delta S = \left| {\frac{{\Delta f_D}}{{\omega _D}}} \right|
\end{equation*}
for luminance (Siddiqi et al. Reference SIDDIQI, CRONIN, LOEW, VOROBYEV and SUMMERS2004), where ∆f represents the logarithmic ratio of photon captures from the focal pair of colours by a given type of photoreceptors (i.e.  $\log \frac{{Q_i 1}}{{Q_i 2}}$), and ω represents the relative abundance of each cone type in the posterior dorsal area of the retina, incorporating the Weber fraction of 0.05 (an error rate in the Weber–Fechner law by convention) (Vorobyev et al. Reference VOROBYEV, OSORIO, BENNETT, MARSHALL and CUTHILL1998). We set a JND of 2 as the standard for the minimum discriminability, which was stricter than those in most visual modelling studies, as we were testing the lack of differences between the morphotypes. The reflectance spectra were drawn with the ‘pavo’ package (Maia et al. Reference MAIA, ELIASON, BITTON, DOUCET and SHAWKEY2013), and the tetrahedral plots were drawn with the ‘lattice’ package (Sarker Reference SARKER2008), both in the R software, version 3.1.1 (R Foundation for Statistical Computing, Vienna; http://www.r-project.org/).
Statistics
Representative values (logarithmic means) for photon captures were estimated using log-linear mixed-effect models with the ‘lme4’ package (http://cran.r-projectorg/package=lme4) in R. We assigned individual plant as a random effect, but did not assign collection site because its explanatory power was too small in these models. Deterministic JNDs between morphotypes were calculated from exponential-transformed parameter estimates for photon captures in these models.
To evaluate the variance of discriminability between measured colours, we first calculated JNDs between all possible combinations of measured colours. The number of JNDs amounted to 97020 (the cumulative sum of n – 1, i.e.  $\frac{{n(n - 1)}}{2}$, where n = 441) for within-organ comparisons (i.e. fruit-fruit or leaf-leaf), and 194922 (n 2) for the between-organ comparison (i.e. fruit-leaf). Next, we formulated distance matrices from all the calculated JNDs, and then converted these matrices into given sets of coordinates of a size n (i.e. 441 for fruit and leaf, respectively) through the principal coordinate analysis (PCoA; Legendre & Legendre Reference LEGENDRE and LEGENDRE1998). We used the ‘cmdscale’ command default in R, setting the dimensional parameter ‘k’ as 3 since the original colour data scattered in a tridimensional space. Each measured colour thus had three unique coordinates, which represent its relative positions on respective axes among all the analysed colours. We chose given sets of coordinates with eigenvalues greater than 1 to analyse. First principal coordinates for both hue and luminance JNDs were integrated in a principal component analysis using a default command ‘prcomp’ in R to estimate the discriminability of colours of the objects to birds as a whole, since birds might not perceive the two aspects of colour separately (Osorio et al. Reference OSORIO, MIKLÓSI and GONDA1999).
We then compared Bayesian posterior probabilities for these first principal coordinates/components between morphotypes inferred with the ‘MCMCglmm’ package (Hadfield Reference HADFIELD2010), in which plant identity and collection site were assigned as random effects. The number of iterations was set as 510000, the thinning interval 1000, and the burn-in (pilot run) 10000. The total Markov-chain Monte-Carlo (MCMC) samples were thus 500 for each parameter. From the inferred posterior probabilities, we estimated the difference in the discriminability between C– and C+, and calculated the probability that the differences of posterior means were greater than 0 (i.e. proportion of cases in which the difference of each MCMC sampled C– from that of C+ was below 0). Note that a statistically significant difference is not always related to the difference in perceived colours, as colours with JNDs less than 2 would be indiscernible to the viewer (Siddiqi et al. Reference SIDDIQI, CRONIN, LOEW, VOROBYEV and SUMMERS2004), irrespective of whether such a difference is biologically substantial. Distributions with negative means were negative-transformed to aid interpretation.
RESULTS
Representative photon capture and deterministic JND
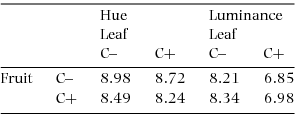
Although photon captures by some single-cone types differed significantly between C+ and C− (fruit UVS: χ21 = 6.49, P = 0.011; leaf UVS: χ21 = 25.1, P < 0.0001; leaf SWS: χ21 = 5.74, P = 0.016; P > 0.05 for all else; Figure 1c–d), no JND greater than 2 was detected in the within-organ comparisons: 0.54 and 0.13 for fruit hue and luminance respectively, and 0.59 and 1.36 for leaf hue and luminance, respectively. Photon capture from leaves by double-cones was significantly different between these two morphoypes (χ21 = 7.17, P = 0.007), while those from the fruit did not (χ21 = 0.096, P = 0.76; Figure 1e). Again, no JND greater than 2 was detected between leaves of the two morphs. JNDs between fruits and leaves of any combinations of morphotypes were much greater than 2 both in hue and luminance (Table 1).
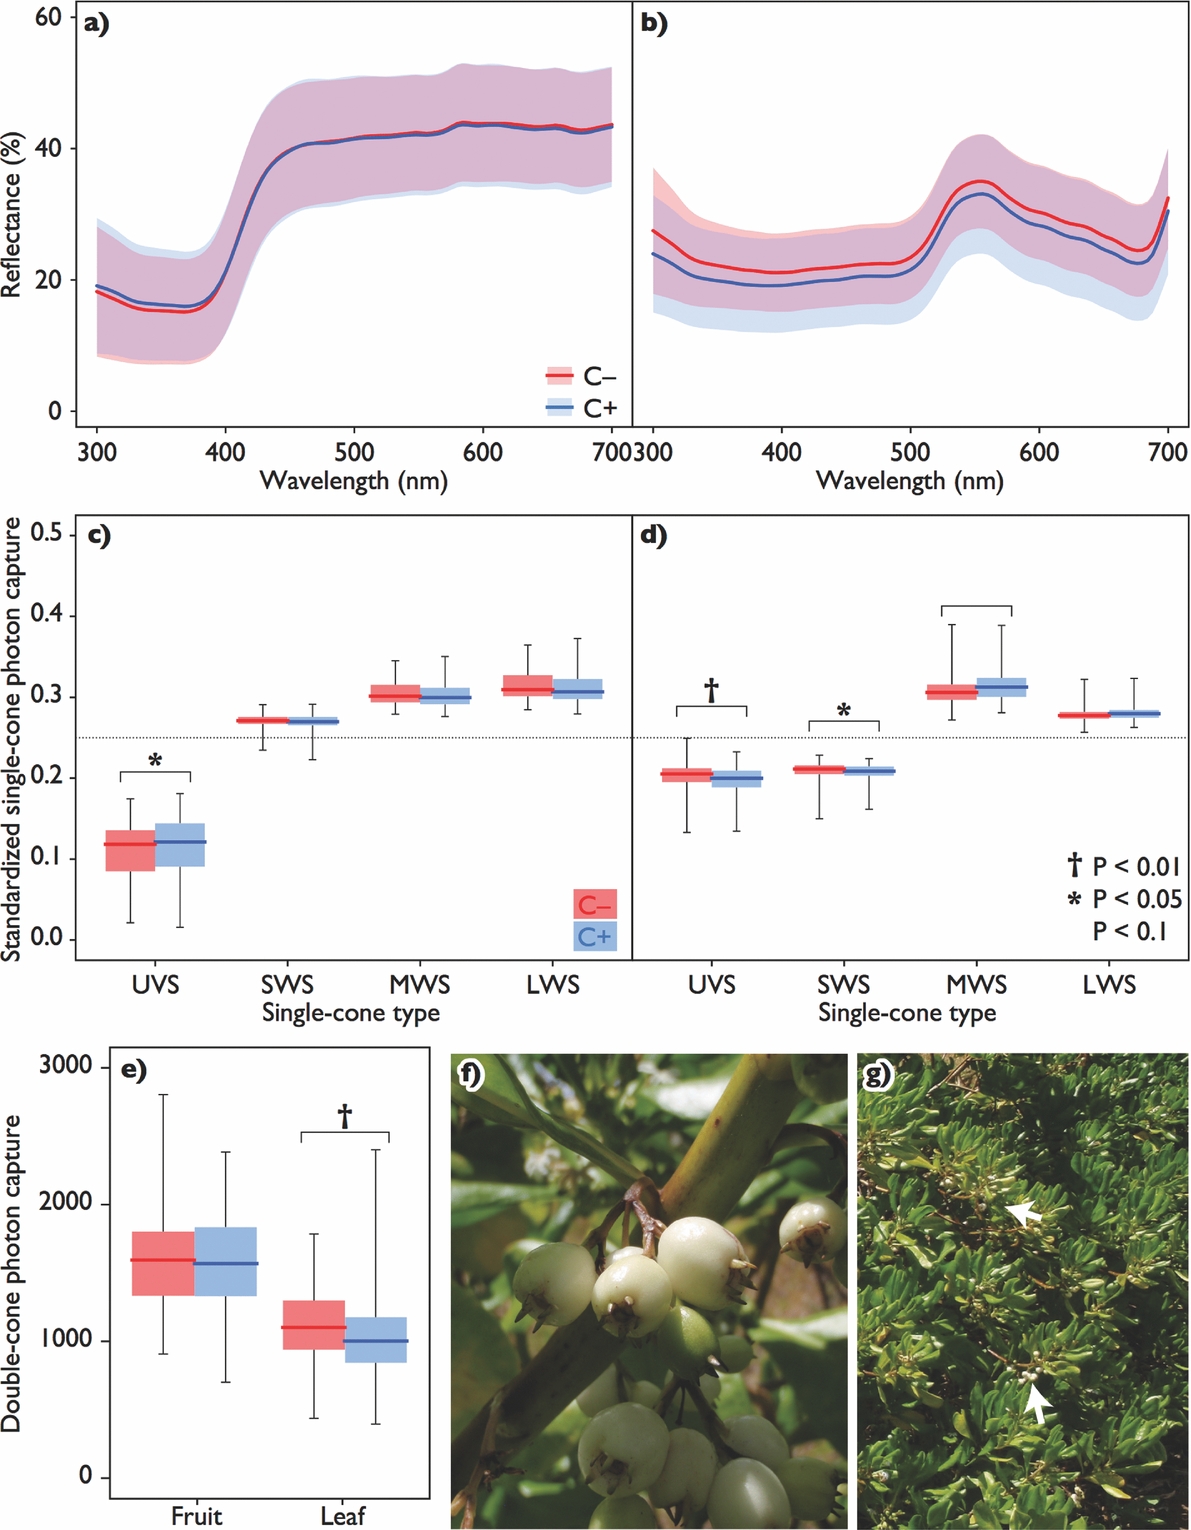
Figure 1. Mean reflectance spectra of light from surfaces of fruits (a) and leaves (b) of Scaevola taccada with standard deviations for respective morphotypes. Line colours denote the endocarp morphotypes: red for the one without cork (C–) and blue for that with cork (C+), and translucent areas denote ranges of each SD (purple for overlapped ranges). Photon captures by single-cone types (UVS: ultraviolet sensitive; SWS: short-wavelength sensitive; MWS: middle-wavelength sensitive; LWS: long-wavelength sensitive) from the measured reflectance from fruits (c) and leaves (d) and those by double-cones (e). Boxes are composed of medians with 1st and 3rd quartiles, with whiskers indicating ranges. Dotted lines indicate the level of standardized photon capture for avian grey. Symbols denote the significance level of differences between morphotypes. Scaevola taccada fruits of C+ (f), and the fruiting plant with bunches of ripe fruits indicated by arrows (g), photographed in Canala, New Caledonia.
Table 1. Between-organ deterministic JNDs (just noticeable differences) for chromatic (hue) and achromatic (luminance) aspects of the colours of fruits and leaves of Scaevola taccada in relation to the endocarp morphotype with (C+) and without cork (C–) found in the main island of Okinawa, in the vision of potential avian seed dispersers. The vision of seed dispersers was approximated based on photoreceptor sensitivity of the blue tit and the avian tetrachromatic colour space.
Discriminability with variance
The distribution of measured colours was different between fruits and leaves, but apparently not between the endocarp morphotypes in the avian tetrachromatic colour space (Figure 2). The distributions of first principal coordinates/components for JNDs appeared not to differ between the morphotypes (Figure 3). Eigenvalues of all the first principal coordinates/components were exclusively greater than 1, and thus their unit could be an approximation of the original parameter (i.e. hue and luminance JNDs, though its precision varied with eigenvalues) (Figure 3).
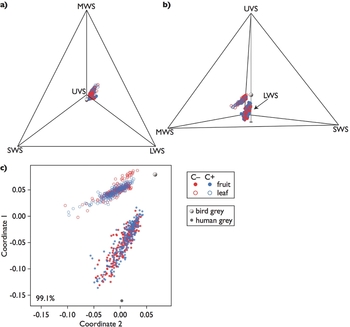
Figure 2. Colours of fruits and leaves of Scaevola taccada in the avian tetrachromatic colour space. Viewing angles are altered to illustrate the aspect of avian tetrachromatic hue that is visible to humans (a), and that invisible to humans (b). Dot colours denote the endocarp morphotypes, red for the one without cork (C–) and blue for that with cork (C+); filled circles denote fruits, and open circles leaves. Single-cone types (UVS: ultraviolet sensitive; SWS: short-wavelength sensitive; MWS: middle-wavelength sensitive; LWS: long-wavelength sensitive) are labelled at apexes where inputs from respective photoreceptors contribute solely to perceived hue. The arrow indicates the apex for LWS. Two-dimensional coordinates representing Euclidean distances between each measured colour in the tetrachromatic colour space (c), converted with the principal coordinate analysis. The percentage denotes the proportion of variance explained jointly by the first and second principal coordinates.

Figure 3. Distributions of first principal coordinates of hue (a–c), luminance (d–f), and integrated JNDs (first principal components; g–i) for the colours of fruits and leaves of Scaevola taccada in relation to the endocarp morphotype with (C+) and without cork (C–) compared within and between organs. Boxes are composed of medians with first and third quartiles with whiskers indicating ranges. Numbers represent eigenvalues for respective first principal coordinates. Colour indication corresponds to those in Figure 1 and 2.
All the posterior probabilities for the differences in the first principal coordinates between the morphotypes were not greater than 0 at the 5% level (Figure 4a–f) except in the leaf hue JND (P = 0.048; Figure 4b). Nevertheless, none of the differences between the posterior means (i.e. effect sizes for the approximate JNDs for both C– and C+) was greater than 2.

Figure 4. MCMC-sampled Bayesian posterior probabilities for the differences in first principal coordinates of hue (a–c), luminance (d–f), and integrated JNDs (first principal components; g–i) for the colours of fruits and leaves of Scaevola taccada in relation to the endocarp morphotypes with (C+) and without cork (C–) compared within and between organs. Values represent the effect sizes (posterior means) with lower and upper ends of the 95% credible intervals in the parentheses, with probabilities that the posterior means are statistically different from 0. Solid lines indicate the mean, and grey lines 0. Distributions with negative means were negative-transformed to aid interpretation. The positions of panels correspond to those in Figure 3.
Integrated discriminability: chromatic and achromatic thresholds
The posterior probabilities of differences in the first principal components between the morphotypes, which were integrated from the first principal coordinates of hue and luminance JNDs, were not greater than 0 at the 5% level (Figure 4g–i), and none of the differences between posterior means was greater than 2.
DISCUSSION
Fruit colour difference between morphotypes
Though the fruit colour of S. taccada was highly discriminable from its leaf colour in the deterministic approach, it is certain that such a measure of differences is insufficient to infer how seed-dispersing birds can distinguish between fruits of the two morphotypes, i.e. C+ and C–, because the variability of perceived differences was not considered. Actually, the deterministic JNDs of luminance between fruit and leaf colours varied roughly with the morphotype (Table 1), though such a difference is untestable using conventional methods. By processing data so that such dissimilarity was quantifiable, we showed that not only the perceived dissimilarity within fruits or leaves, but the one between fruits and leaves were not different between morphotypes (Figure 4). These results suggest that the fruit colours of the different morphotypes would be indistinguishable from the point of view of avian seed dispersers. Thus, to avoid consuming fruits with cork, birds would have to rely on other discrimination cues, such as the size-weight relationship of fruits, or spatial locations of individual plants. In fact, frugivorous birds seem not to distinguish the morphotypes as they consumed C+ fruits (Emura et al. Reference EMURA, KAWAKAMI, DEGUCHI and SONE2012, Kawakami et al. Reference KAWAKAMI, MIZUSAWA and HIGUCHI2009) in areas where both morphotypes were found (Emura et al. Reference EMURA, DENDA, SAKAI and UEDA2014), and both types of seed were found in faeces and pellets of birds in our collecting sites (Emura, pers. obs.). To sum, the endocarp dimorphism is cryptic sensu stricto to frugivorous birds, and thus the fruit colour of S. taccada is a relatively dishonest signal about its reward.
Although we do not know the gene expression mechanism of the endocarp dimorphism of S. taccada, theories might help disentangle the evolutionary relationship of the dimorphism and the dishonesty (Gigord et al. Reference GIGORD, MACNAIR and SMITHSON2001, Gray & McKinnon Reference GRAY and MCKINNON2007). For example, we would assume that Mendel's law of dominance would apply both for C+ and a putative mutant allele for a novel fruit colour, and both are genetically uncorrelated traits. Although the novel colour gene seems to be adaptive, this new colour morph still could not provide an honest signal to seed dispersers because fruit colours are expected to segregate independently of the endocarp types according to Mendel's law. Therefore, a required condition for an honest signal is a strong genetic correlation between dominant alleles of the endocarp and fruit colour genes. However, such genetic hitchhiking would be stochastically unlikely (Barton Reference BARTON2000), so is the signal honesty. The low probability of genetic linkage implies that divergent selection to promote speciation is required to make the fruit colour an honest signal under endocarp dimorphism (Gray & McKinnon Reference GRAY and MCKINNON2007). Therefore, any kind of habitat segregation between respective morphotypes is necessary to prevent avian seed dispersal as well as gene flows through pollination (Forsman et al. Reference FORSMAN, SANESJÖ, CAESAR and KARLSON2008, Gillespie et al. Reference GILLESPIE, BALDWIN, WATERS, FRASER, NUKULA and RODERICK2012, Gray & McKinnon Reference GRAY and MCKINNON2007). In fact, some close relatives of S. taccada that have different fruit colours and lack the cork endocarp, such as S. montana in New Caledonia, inhabit inland areas that are far from coastal areas where S. taccada is found (Howarth et al. Reference HOWARTH, GUSTAFSSON, BAUM and MOTLEY2003). Considering such genetic constraints as improbable genetic linkage or introgression, the dishonesty in the reward signal of S. taccada might have been formed as a byproduct, rather than for the sake of the plant. Further genetic analyses could reveal such evolutionary dynamics of S. taccada.
Application of the PCoA to visual modelling
The nature of colour perception by colour-sensing animals prevents application of common statistical procedures (Tanaka in press). We review statistical constraints on the visual model and discuss how to circumvent statistical problems encountered in previous studies. Few techniques exist to test the lack of difference in colour contrasts between samples. In this study, we employed principal coordinate analysis (PCoA, or multi-dimensional scaling), in which a set of coordinates in a given dimension is formulated from a distance or similarity matrix (Legendre & Legendre Reference LEGENDRE and LEGENDRE1998). The PCoA is particularly compatible with visual modelling because a JND is an approximated perceived dissimilarity, i.e. the psychophysical distance between given two colours (Backhaus et al. Reference BACKHAUS, MENZEL and KREIßL1987, Vorobyev & Osorio Reference VOROBYEV and OSORIO1998). Four major methods have been adopted in the studies of avian visual modelling to quantify colour differences: (1) representative (averaged) reflectance/photon captures and deterministic JNDs (Avilés Reference AVILÉS2008, Feeney et al. Reference FEENEY, STODDARD, KILNER and LANGMORE2014, Tanaka et al. Reference TANAKA, MORIMOTO, STEVENS and UEDA2011); (2) estimating volumes in the colour space occupied by given colours (Langmore et al. Reference LANGMORE, STEVENS, MAURER, HEINSOHN, HALL, PETERS and KILNER2011, Maia et al. Reference MAIA, ELIASON, BITTON, DOUCET and SHAWKEY2013, Stoddard & Prum Reference STODDARD and PRUM2008, Reference STODDARD and PRUM2011; Stoddard & Stevens Reference STODDARD and STEVENS2011); (3) averaging JNDs (Antonov et al. Reference ANTONOV, AVILÉS, STOKKE, SPASOVA, VIKAN, MOKSNES, YANG, LIANG and RØSKAFT2011, Avilés Reference AVILÉS2008, Avilés et al. Reference AVILÉS, SOLER and HART2011, Cassey et al. Reference CASSEY, EWEN, MARSHALL, VOROBYEV, BLACKBURN and HAUBER2009); and (4) the Mantel test (Avilés et al. Reference AVILÉS, VIKAN, FOSSØY, ANTONOV, MOKSNES, RØSKAFT, SHYKOFF, MØLLER and STOKKE2012, Fadzly et al. Reference FADZLY, BURNS and ZUHARAH2013). However, each of these methods has drawbacks.
First, the representative approach begins with calculation of averages for reflectance spectra (Avilés Reference AVILÉS2008) or photon captures (Tanaka et al. Reference TANAKA, MORIMOTO, STEVENS and UEDA2011; this study), or centroids of focal colours in the colour space (Feeney et al. Reference FEENEY, STODDARD, KILNER and LANGMORE2014). Then, JNDs for focal colours against a given set of average photon captures (Avilés Reference AVILÉS2008, Avilés et al. Reference AVILÉS, SOLER and HART2011), JNDs of all colours from the centroid of the focal colours (Feeney et al. Reference FEENEY, STODDARD, KILNER and LANGMORE2014), or JNDs between averages are calculated (Tanaka et al. Reference TANAKA, MORIMOTO, STEVENS and UEDA2011; Table 1 of the present study). Although such results are intuitive, the representative approach partially or even wholly discounts the variance of data (i.e. JNDs are deterministic), which could cause type I errors. Second, the volume estimation calculates a volume that encompasses outlying data points (i.e. minimum convex polygon) of measured colours in the tetrahedron (Maia et al. Reference MAIA, ELIASON, BITTON, DOUCET and SHAWKEY2013, Stoddard & Prum Reference STODDARD and PRUM2008). While the volume estimation efficiently reduces the dimension of data, it disregards the density of distribution, which could cause type II errors by over-weighting outliers. The third method, averaging JNDs, treats each JND value as a repeated measurement, and then analyses the effects of covariates on the set of the JND values (i.e. as a response variable) with a linear model (Cassey et al. Reference CASSEY, EWEN, MARSHALL, VOROBYEV, BLACKBURN and HAUBER2009). However, the averaging of JNDs severely violates two fundamental principles of statistics: (1) the congruence principle, and (2) the independence of data. In reference to the congruence principle, treating a set of (Euclidean) distances as a linear variable is to ignore the mutual geometric dependence of each datum, which is non-existent in linear variables (Biondini et al. Reference BIONDINI, MIELKE, REDENTE, Feoli and Orlóci1991, Endler & Mielke Reference ENDLER and MIELKE2005, Endler et al. Reference ENDLER, WESTCOTT, MADDEN and ROBSON2005). With regard to the independence principle, each colour has n – 1 JNDs, so the number of analysed JNDs in this procedure must be n(n – 1). However, a single JND always stems from a pair of measured colours, so the total number of JNDs cannot be the sum of the number of JNDs that are related to each measured colour. The original number of JNDs is the cumulative sum of n – 1, i.e.  $\frac{{n(n - 1)}}{2}$, and thus the number of analysed JNDs will be literally duplicated.
Finally, the Mantel test should be statistically more robust than the other methods as it satisfies the congruence principle, and thus is capable of directly analysing distance matrices. However, the Mantel test is designed to estimate correlation between two distance matrices, and thus causal relationships could not easily be detected. Moreover, the Mantel test is not applicable to longitudinal data (i.e. repeated measurements), and thus pseudoreplication is unavoidable. Repeated measurement is the strongest way to reduce measurement errors (Bolker et al. Reference BOLKER, BROOKS, CLARK, GEANGE, POULSEN, STEVENS and WHITE2009), and is especially important in the visual modelling framework since such errors could occur at a scale beyond human perception. The partial Mantel test might do better at avoiding pseudoreplication, although its validity is controversial (Raufaste & Rousset Reference RAUFASTE and ROUSSET2001).
The PCoA, or MDS, clearly has superiority over the procedures described above, because of its statistical validity. The concept of the PCoA is similar to that of the Mantel test, in that both can analyse distance matrices, but different in that the PCoA yields linear coordinates from distance matrices (Legendre & Legendre Reference LEGENDRE and LEGENDRE1998). The resultant set of coordinates corresponds exactly to a well-known normally distributed variable, the principal component, and is thus compatible with linear models, currently the commonest framework in biostatistics (Bolker et al. Reference BOLKER, BROOKS, CLARK, GEANGE, POULSEN, STEVENS and WHITE2009). Even though the PCoA does have some drawbacks, such as the reduction of dimensions inevitably entailing missing information, it could reduce the risk of false discoveries or false rejections of null hypotheses, while avoiding statistical violations such as incongruence or pseudoreplication. To sum, applying the PCoA to visual modelling analyses could expand the application of hypothesis testing statistically more robustly, particularly when the data structure is so highly multi-dimensional as in avian tetrachromatic colours (Backhaus et al. Reference BACKHAUS, MENZEL and KREIßL1987).
Conclusion
Our study revealed that the fruit colours of S. taccada are not discernibly different to avian seed dispersers between morphotypes, based on the outputs from our robust statistical modelling. Thus, the seed-dispersal strategy of C+ individuals of the plant is likely to result in a dishonest signal, which can impose greater costs on the avian seed dispersers. However, it is not certain that the signalling dishonesty exists solely for the benefit of the plant, rather than as a byproduct of other factors.
ACKNOWLEDGEMENTS
We thank W. Kitamura for comments on statistics and W. Feeney for his helpful comments and suggestions. This study was financially aided by Grants-in-aid from the Japan Society for the Promotion of Science: Young Scientists B: 24770028 (K.D.T.); Basic A: 23255004 (K.U.); by the Japan Science Society: Sasakawa Scientific Research Grant: 26-445 (N.E.).


