Introduction
Space is critical to the conservation of most species, and this is particularly true for large mammals that tend to roam over large areas (e.g. Fryxell & Sinclair Reference Fryxell and Sinclair1988, Mueller et al. Reference Mueller, Olson, Dressler, Leimgruber, Fuller, Nicolson, Novaro, Bolgeri, Wattles, DeStefano, Calabrese and Fagan2011). However, in human-modified landscapes, space has become a limiting factor for many species (Tucker et al. Reference Tucker, Böhning-Gaese, Fagan, Fryxell, van Moorter and Alberts2018). To overcome species’ decline and extinction (Cardillo et al. Reference Cardillo, Purvis, Sechrest, Gittleman, Bielby and Mace2004, Harris et al. Reference Harris, Thirgood, Hopcraft, Cromsigt and Berger2009) some conservation efforts have focussed on preventing the destruction of existing natural areas through the creation of new protected areas (Naughton-Treves et al. Reference Naughton-Treves, Holland and Brandon2005). For example, over the last four years 30 000 sites were added to the World Database on Protected Areas (UNEP-WCMC 2018). In addition, range expansion via corridors (e.g. Douglas-Hamilton et al. Reference Douglas-Hamilton, Krink and Vollrath2005, Osborn & Parker Reference Osborn and Parker2003), protected area expansion (e.g. Druce et al. Reference Druce, Pretorius and Slotow2007), and the amalgamation of protected areas (e.g. fence removal between Kruger National Park (South Africa) and Limpopo National Park (Mozambique) in 2002) are key conservation measures.
However, despite the growing use of the strategy of protected area expansion, we know very little about how animals detect and later use these new areas. Thus, we are unsure just how successful these conservation measures may be. Discovery of newly available areas probably depends on factors such as the proximity of the animals to these areas and their exploratory behaviour (Druce et al. Reference Druce, Pretorius and Slotow2007). Yet, this latter aspect remains poorly understood (e.g. Mettke-Hofmann et al. Reference Mettke-Hofmann, Winkler and Leisler2002, Switzer Reference Switzer1993).
Exploration might be limited in favourable environments (e.g. Mettke-Hofmann et al. Reference Mettke-Hofmann, Winkler and Leisler2002, Switzer Reference Switzer1993) or, conversely, when overall conditions in an animal’s range are bad (e.g. Larkin et al. Reference Larkin, Cox, Wichrowski, Dzialak and Maehr2004, van Moorter et al. Reference van Moorter, Bunnefeld, Panzacchi, Rolandsen, Solberg and Saether2013). Generally, animals show relatively strong site fidelity that limits exploration and may even delay the discovery of new places (e.g. de Knegt et al. Reference de Knegt, Pretorius, van Langevelde, de Boer, Gort, Skidmore, Slotow, Henley, Delsink, Grant, Prins and de Knegt2010, Switzer Reference Switzer1993). For instance, black rhinoceros (Diceros bicornis) have been shown to be slow to colonize a harvested neighbour’s range (Linklater et al. Reference Linklater, Macdonald, Flamand and Czekala2010). In central Idaho, introduced grey wolves (Canis lupus) limited their movements to within a small core area the first year after their reintroduction, and took a long time before exploring beyond this core (Bangs & Fritts Reference Bangs and Fritts1996). Similarly, newly introduced black bear (Ursus americanus) limited their movements and even tried to move back to their previous range (Eastridge & Clark Reference Eastridge and Clark2001).
African elephant (Loxodonta africana) populations provide an interesting case study in the context of range expansion. Space is critical for these large, wide-ranging species (Owen-Smith Reference Owen-Smith1988). As such, many populations have been exposed to area expansion, often either to: (1) allow for population expansion (e.g. fence removal, Druce et al. Reference Druce, Pretorius and Slotow2007), or (2) reduce the impact of dense elephant populations on the landscape (Biggs et al. Reference Biggs, Slotow, Scholes, Carruthers, van Aarde, Graham, Twine, Grobler, Berthshinger, Grant, Lötter, Blignaut, Hopkinson, Scholes and Mennell2008). Elephants have shown contrasting responses when faced with one of these different expansion measures. For instance, elephants moved rapidly into new areas after the fence was removed between Kruger and Sabi Sand Wildtuin and migration paths were re-established (Grant et al. Reference Grant, Bengis, Balfour, Peel, Africa, Mostert, Scholes and Mennell2008). In contrast, when the fence between Marakele National Park and Marakele Pty Ltd was removed in 2001, it took elephants 2 years before they visited the newly available area (Bezuidenhout Reference Bezuidenhout2004). Similarly, when the boundary fence between Phinda Private Game Reserve and one neighbouring reserve was removed in 2004, it took resident family groups between 6 and 9 months to venture into the new area (Druce et al. Reference Druce, Pretorius and Slotow2007). Moreover, only one herd expanded its core range to incorporate this newly available area despite its relatively small size (3850 ha; Druce et al. Reference Druce, Pretorius and Slotow2007). However, despite these studies, we still have a poor understanding of the factors associated with elephants’ discovery of a newly opened area and which factors influence their response to area expansion. In fact little attention has been given to the factors (e.g. spatial distribution, diet and habitat preferences) that underlie elephants’ response to range expansion measures.
Here we studied the response of African elephant breeding herds to the removal of a fence between Phinda Private Game Reserve and a neighbouring reserve, in South Africa. We did so by using data from GPS collars fitted on each matriarch. We describe the discovery and use of the newly available area, but unlike previous studies (e.g. Druce et al. Reference Druce, Pretorius and Slotow2007) we also analyse elephant behaviour (habitat selection, distribution in relation to the fence) before the fence removal to understand the factors that could have facilitated the discovery and use of the new section, accounting for seasonal changes in movement patterns.
We hypothesized that the proximity to the new section might determine how long it takes herds to find and use the section. Thus, we expected herds regularly close to the previous fence to discover and explore this section quicker than herds which were usually located farther away. For instance, it has been shown that elephants use their sense of smell to make foraging decisions (Schmitt et al. Reference Schmitt, Shuttleworth, Ward and Shrader2018) and being close to the new area might increase the chances of smelling a new foraging place. Because animals have habitat preferences (e.g. de Knegt et al. Reference de Knegt, Pretorius, van Langevelde, de Boer, Gort, Skidmore, Slotow, Henley, Delsink, Grant, Prins and de Knegt2010, Switzer Reference Switzer1993), we expected that elephants would move more rapidly into areas containing the preferred habitats compared with those with the less preferred habitats.
Methods
Study area
Phinda Private Game Reserve (referred to as Phinda from here on) (16 826 ha) is located within the Mun-Ya-Wana Conservancy (MYW), Kwa-Zulu-Natal Province, South Africa (27°51′30″S, 32°19′00″E) (Fig. 1). Phinda comprises nine different vegetation types across a mosaic of savanna woodlands and sand forests (Suppl. Appendix 1.) (Druce et al. Reference Druce, Pretorius and Slotow2007, Slotow & Page Reference Slotow and Page2002). The climate is subtropical with annual temperatures ranging from 10–35°C and a mean annual rainfall of 700 mm (SD ± 230 mm) (1995–2018). Rain falls in every month of the year but the summer wet season (all months with >50 mm of precipitation; Knoch & Schulze Reference Knoch and Schulz1957) runs from October to March (mean rainfall 89 mm), while the winter dry season runs from April to September (mean rainfall 27 mm).

Figure 1. Map of the Mun-Ya-Wana Conservancy. Each colour represents one of the three private game reserves (i.e. Phinda Private Game Reserve, Zuka Private Game Reserve, Bumbeni) included into the Mun-Ya-Wana Conservancy. The striped black polygon represents the Lulubush section added on 4 October 2017. During the dry season, water can only be found in six dry season water points (black circles) and two non-perennial rivers (black thick lines). The shaded area in the insert map is the KwaZulu-Natal province.
Between 1993 and 2011 more properties were added to MYW which currently comprises three private game reserves that were initially separated by fences (Fig. 1). Elephants were introduced into Phinda between 1992 and 1994 (Druce et al. Reference Druce, Pretorius and Slotow2007, Slotow & Page Reference Slotow and Page2002) from the Kruger National Park (Slotow & Page Reference Slotow and Page2002). Currently the population is estimated to be around 110 elephants, divided in six breeding herds of ~10 individuals each, and various sized bachelor herds (ranging from 2–5 individuals each) incorporating the reserve’s 25 males. Elephants are free ranging within MYW.
On 4 October 2017, which corresponded to the beginning of the wet season, the boundary fence between Phinda and the neighbouring Lulubush Game Reserve (LGR) (1612 hectares) was removed. As a result, MYW now contains 243 natural and artificial waterpoints, with 21 in LGR. Most of the LGR waterpoints are man-made but none of them are supplied by a pump. In the dry season, water is available in MYW in three non-perennial rivers and six artificial water sources that are maintained during the dry season.
Data
We collected elephant positional data every 4 hours using GPS/GSM manufactured by African Wildlife Tracking fitted to the matriarch of each of the six breeding herds. Collars were put on 2 years prior to the start of our study by a trained veterinarian after each elephant had been tranquillized from a helicopter. The movement of these females was assumed to represent the movement of the whole breeding herd to which they belonged (Druce et al. Reference Druce, Pretorius and Slotow2007). For each of the herds, we collected location data one year before and one year after the fence removal. However, for one herd (FH1), positional data were only available from after the removal of the fence. As a result, we could only use the data from this herd in the analysis focusing on elephant behaviour post fence removal.
Identifying independent herds
Field observations indicated that some of the herds spent a significant amount of time together. As these herds would not provide independent information, we considered two herds to be ‘together’ when the distance between the herds, obtained from locations acquired less than 30 min apart, was less than 250 m. Results (Suppl. Appendix 2) showed that two herds (FH5 and FH2) were together more than 68% of the time. As these herds would provide pseudo-replicated information, we randomly selected the data from herd FH5 in the analyses. Nevertheless, we explored whether using the data from herd FH2 would change the results and they did not. Thus, we only used the data from herd FH5. We did not include the data from both herds when they were apart because the sample size of FH2 alone was too small to be representative of the herd’s behaviour and to bring significant information to the other data.
Habitat selection
We first determined the habitat composition of the newly available LGR section using a vegetation map (Suppl. Appendix 1). From this, we defined seven different vegetation types: (1) palm veld, (2) mixed acacia and lebombo woodlands, (3) floodplain grasslands, (4) bush clump thickets, (5) mixed zululand lowveld savanna, (6) riparian and (7) sand forest and sandveld woodlands. As the elephants are fenced out of a large part of the sand forest we grouped sand forest and sandveld woodlands into one habitat type. This avoided creating instability in estimates due to the small number of locations in the sand forest. Then, to understand whether the available habitats in the LGR were those preferred by elephants, we analysed the habitat selection of the elephants before the fence removal, for the wet and dry season separately. We calculated, for each herd and each season, the selection ratio (SR; SR = Propused/Propavailable) and the associated confidence intervals (confidence limits: 2.5% and 97.5%) (Chamaillé-Jammes Reference Chamaillé-Jammes2019, Manly Reference Manly2002) for each habitat. We estimated Propused using the actual GPS locations of elephants, and Propavailable by plotting 2500 random points within each herd seasonal home range.
Individual herd exploratory behaviour
We studied the temporal dynamics of exploration and use of the newly opened section during the wet season following the removal of the fence. In particular, we studied how long it took the elephant herds to enter the section. For each herd, we measured the time to first visit as the time between the fence removal and the first location of the herd at least 50 m (to account for potential GPS error) within the new section. We investigated whether the time to first visit was related to: (1) the distance at which elephants were to the fence the day the fence was removed, (2) the proportion of time elephants spent within 100 m of the fence during both the wet and the dry seasons a year before the fence removal, and (3) the average return time to within 100 m of the fence in both seasons a year before the fence was removed.
We calculated how far herds ventured into the newly opened section during their first visit and measured the maximum distance travelled within this section from the date of the first visit (Druce et al. Reference Druce, Pretorius and Slotow2007). Finally, we determined whether the elephant herds used the new section more at night (18h30 to 05h30) as found in another study (Druce et al. Reference Druce, Pretorius and Slotow2007) or during the day (05h30 to 18h29) by comparing the mean number of locations within the section during these periods.
Home-range shifts
We studied whether the opening of the LGR affected the size and location of the seasonal home ranges of each elephant herd. As the fence removal occurred at the beginning of the wet season, we computed wet and dry season home ranges before the fence removal, and the wet and the dry season home ranges after the removal. The overall study site is fenced, which creates limitation to elephant movement that should be accounted for when estimating home ranges. We therefore used the local convex hull (LoCoH) non-parametric kernel method to estimate home ranges as this naturally allows for hard boundaries in home ranges (Getz et al. Reference Getz, Fortmann-roe, Cross, Lyons, Ryan and Wilmers2007). We defined a home range as the area within the 90% isopleth, estimated following the ‘fixed number of points’ approach (k-LoCoH, Getz et al. Reference Getz, Fortmann-roe, Cross, Lyons, Ryan and Wilmers2007), with k chosen following the ‘rules of thumb’ proposed by Getz et al. (Reference Getz, Fortmann-roe, Cross, Lyons, Ryan and Wilmers2007). Selected values of k ranged between 33.0 and 46.5 (the values are reported in the caption of Table 3).
To determine whether elephants had relocated or extended their home ranges after the fence removal, we first determined whether there were seasonal changes in home ranges irrespective of the range expansion event. We did this by computing the overlap between wet and dry season home ranges, in the year before the fence removal, to measure what proportion of the wet season home range was in the dry season home range. Once we had done this, we then computed the proportion of the pre-removal wet and dry season home ranges which remained in the wet and dry season home ranges after the fence was removed.
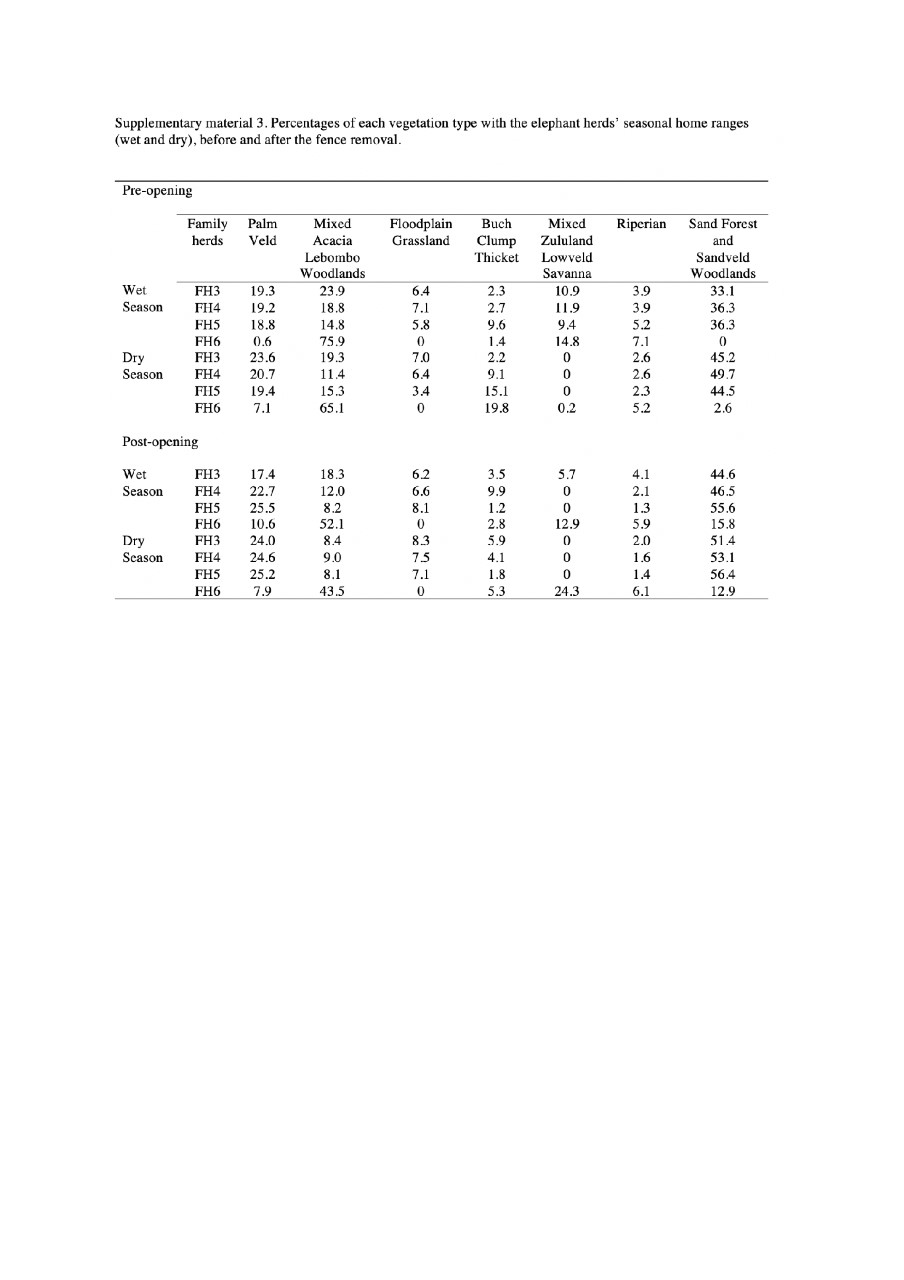
Finally, we assessed whether any post fence removal changes to the seasonal home ranges altered the seasonal habitat composition of the home ranges. We did this by estimating, for each herd, the percentage of each vegetation type included in their dry and wet season home range separately, a year before and a year after the fence removal (results are reported in Suppl. Appendix 3).
Results
Habitat selection
Although elephant habitat selection prior to the fence being removed was variable (Fig. 2), the herds preferred the (1) palm veld, and (2) sandveld woodlands and sand forest habitat types (Fig. 2), with FH3, FH4 and FH5’s seasonal home ranges dominated by these habitat types prior to the fence being removed. Moreover, these habitats respectively accounted for on average 21% and 46% of their dry season home range and on average 19% and 35% of their wet season home range (Suppl. Appendix 3). Palm veld, sandveld woodlands and sand forest were also the most available habitats in FH3, FH4 and FH5’s seasonal home ranges before the fence removal (Suppl. Appendix 4). Only FH6’s seasonal home ranges were dominated by mixed acacia woodlands, with 65% included in the dry season home range and 76% in the wet season home range (Suppl. Appendix 3).

Figure 2. Selection ratios for the seven vegetation types (1–7) by the different elephant herds before the fence removal in the wet (a) and dry (b) seasons. Each dot indicates the mean selection ratio of the corresponding elephant herd for the seven vegetation types, with the associated confidence intervals (confidence limits: 2.5% and 97.5%). When both limits of the confidence interval were different to 1, we estimated a significant positive selection (above) and a significant avoidance (below).
The LGR comprised five different vegetation types: 62% sandveld woodlands and sand forest, 27% palm veld, 10% mixed acacia woodlands, and 1% riparian forest. As these habitats were key in the herds’ home ranges prior to the fencing being removed, it suggested that the herds would find suitable habitats in the LGR after the fence separating the properties was taken down.
Exploratory behaviour
All of the elephant herds visited the newly opened section soon after the fence was removed (Fig. 3). Herd FH4 visited 5 days after the removal, while three other herds (FH1, FH3 and FH5) went into the section between 9 and 13 days after the fence was removed. Finally, FH6 visited the section 34 days after the fence was removed.

Figure 3. Distance to the former fence estimated between 2 weeks before the fence removal and the end of the wet season after the fence removal. Positive values represent locations within the newly available Lulubush section, negative values represent locations within the area already accessible before the fence removal. The grey polygon covers the 2-week period before the fence removal.
Although the herds had spent only between 0.1 and 2.0% of their time within 100 m of the LGR (Table 1), they were regularly within 100 m during the dry season preceding the removal of the fence. For example, FH4 was within 100 m of the fence on average every 6.8 days, FH5 every 10.1 days, and FH3 every 19.1 days. This was far more frequent than in the preceding wet season, when the herds were <100m of the fence somewhere between 11 and 170 days (Table 1). The day of the fence removal, all the herds were ~11 km from the fence, and a negative relationship appeared between the time taken to go into LGR after the fence removal and the percentage of time spent within 100 m of the previous fence (Fig. 4).
Table 1. Time taken for the elephant herds to move into the newly available area, reported as information about their use of the area within 100 m of the fence during the year before the fence removal


Figure 4. The relationship between the percentage of time spent within 100 m of the fence during the year before the fence removal and the time taken for the elephant herds to move within the newly available Lulubush section. The time taken to move is defined as the time from the fence removal to the first entry into Lulubush.
From the day the fence was removed to their first entry, the elephants were on average 6.3 km (± 3.7 km) from the edge of the LGR (Fig. 3). Before their first entry, FH3 and FH5 were the only family herds that went relatively close to the boundary (309 m and 312 m respectively). During this period, the others remained between 1.3 km and 2.1 km from the boundary, until they moved directly into the LGR (Fig. 3).
During their first visit into the LGR, all of the herds stayed there less than 8 hours, and three herds less than 5 hours. Upon entering, the herds only travelled between 278 m and 672 m into the LGR (Table 2). Only herd FH6, which was the last one to enter, travelled a distance greater than 1 km into the LGR during its first entry (Table 2). Ultimately, it took 9 months for all the herds to travel 3.5 km into the LGR (Table 2).
Table 2. Maximum distance travelled into the newly available area during the initial exploration by each of the elephant herd. In addition, we report the maximum distance travelled into the new area during the year following the fence removal, and the number of days after fence removal when this occurred

Table 3. Size of the seasonal home ranges of each elephant herd estimated before and after the fence removal. In addition, we report the estimation of the overlap between seasonal home ranges for each elephant herd. WHR and DHR refer to wet and dry season home ranges respectively

Selected values for k for home ranges computation (see text for details): – for WHR pre-opening: FH3 39.5/FH4 43.5/FH5 45.5/FH6 40.0; – for DHR pre-opening: FH3 35.0/FH4 40.5/FH5 36.5/FH6 36.5; – for WHR post-opening: FH3 45.0/FH4 46.5/FH5 42.5/FH6 37; – for DHR post-opening: FH3 42.0/FH4 38.0/FH5 42.5/FH6 33.0.
During the wet season following the removal of the fence (i.e. the first 6 months after the removal), the elephants went into the LGR regularly. The average period between visits for herds FH1, FH3, FH4 and FH5 was between 0.48 and 0.60 days. For FH6, it was every 2 days (Fig. 3). However, FH6 was regularly in the new area between 7 November and 13 December, with on average 0.51 days between visits (Fig. 3). After this period, FH6 left LGR and only came back 6 months later. All of the herds visited LGR during both day and night, with 61% (FH1), 67% (FH3), 52% (FH4), 57% (FH5) and 49% (FH6) of locations during the day. Overall, none of the herds showed a preference with regards to the time of the day in which they visited the LGR (Wilcoxon signed-rank test: N = 5, V = 14, P = 0.125).
Home range shift
Before the fence was taken down, the home ranges of FH3, FH4 and FH5 were located primarily in the northern part of the reserve (Fig. 5). However, during the wet season, all three of these home ranges expanded into the south of the reserve. During both seasons, all of the herds’ home ranges surrounded the LGR (Fig. 5). Despite the seasonal changes in the home ranges, these home ranges overlapped between 65% and 79% (Table 3). One year after the fence removal, all of the herds had incorporated LGR into their home ranges (Fig. 5). However, there was no significant change in the overall size of either the dry or wet season home ranges after the fence was taken down (Wilcoxon signed-rank test: dry home ranges, V = 5, N = 4, P = 1; wet home ranges, V = 4, N = 4, P = 0.87). On average 81% (± 13%) of the previous wet season home ranges were still included into the new wet season home ranges, and the mean overlapping between the previous and the new dry season home ranges was 76% (± 16%) (Table 3).

Figure 5. Estimation of the breeding family herds’ home ranges before the fence removal in the wet and dry seasons, and after the fence removal in the wet and dry seasons. Home ranges were obtained using the k-LoCoH method (90% isopleth).
A year after the fence removal, despite few modifications in the percentages of vegetation types (e.g. the cover of sandveld woodlands and sand forest increased; Suppl. Appendix 3), the habitat composition of the wet and dry season home ranges had not significantly changed (Wilcoxon signed-rank test: dry-season habitat composition, V = 13, N = 7, P = 0.94; wet home ranges, V = 14, N = 7, P = 1).
Discussion
After the expansion of MYW, we observed a rapid expansion of the resident elephant breeding herds into the newly available LGR. The month following the opening, all of the herds had visited LGR at least once, despite being more than 10 km from the fence when it was taken down. They explored the new section quickly and regularly during the wet season following the fence removal. After a year, all of the herds had incorporated the LGR into their home ranges and thus modified the habitat composition of their seasonal home ranges.
Our results contrast to those of Druce et al. (Reference Druce, Pretorius and Slotow2007) who found that the exploration of new areas by the same elephant herds took between 4 and 8 months after the fence was removed. In our study, prior to the removal of the fence, the herds regularly visited the area in the vicinity of the fence, with a minimum of one visit every 7 days. We also observed that when the average of the return time to the vicinity of LGR was short, the time taken to enter the new section was also short. This suggests that the frequent visits to the area next to the fence could have facilitated the rapid discovery of the newly opened area once the fence was taken down.
After the first entry, all herds continued to use LGR, and incorporated parts of it into their seasonal home ranges. The herds visited this section regularly, during both the day and night, at least every 2 days. In contrast, Druce et al. (Reference Druce, Pretorius and Slotow2007) found that the same herds acted cautiously during their exploration of a new area. This was indicated by the significant preference for exploring at night, and the fact that the longest exploration distance within the new area occurred only 6–12 months after the first entry.
Druce et al. (Reference Druce, Pretorius and Slotow2007) tentatively explained this slow exploration by suggesting that the resources and space for the elephants in the previously available area were probably sufficient. In that study, however, the new area comprised mostly mixed acacia woodlands (92%), a habitat avoided by elephants in our study, and only 6% riparian and 2% palm veld, two habitat types preferred by elephants. In our study, the LGR was mostly covered by sandveld woodlands and sand forest (62%) and palm veld (26%), which were strongly selected for by the elephants and the most available vegetation types in their previous seasonal home ranges (Suppl. Appendix 4). Thus, it is possible that the difference observed between Druce et al. (Reference Druce, Pretorius and Slotow2007) and our study is the result of the preferred habitat composition of the newly available LGR attracting the elephants in our study.
In contrast to the study by Druce et al. (Reference Druce, Pretorius and Slotow2007), where none of the herds incorporated the new area into their home range, all of the herds in our study incorporated the LGR into their seasonal home ranges after a year. The sizes of the home ranges, however, did not increase. Thus, the home ranges of the elephants shifted such that they no longer used portions of their previous home ranges. Moreover, the habitat compositions of the seasonal home ranges were also not modified after the fence removal.
Comparison between our results and those of Druce et al. (Reference Druce, Pretorius and Slotow2007) indicates that the expansion of a protected area can lead to variable animal exploration and utilization of the newly available area. Previous studies have demonstrated that low exploration may be due to a high site fidelity of animals (e.g. de Knegt et al. Reference de Knegt, Pretorius, van Langevelde, de Boer, Gort, Skidmore, Slotow, Henley, Delsink, Grant, Prins and de Knegt2010, Linklater et al. Reference Linklater, Macdonald, Flamand and Czekala2010) driven by their condition (e.g. age; Switzer Reference Switzer1993) and exogenous environmental variables (e.g. tree cover, nutritional quality, water proximity, etc.; de Knegt et al. Reference de Knegt, Pretorius, van Langevelde, de Boer, Gort, Skidmore, Slotow, Henley, Delsink, Grant, Prins and de Knegt2010). In addition, our findings suggest that animals’ habitat preferences probably define the attractiveness of new areas and thus might influence the response they have towards area expansion. This is also probably true for the utilization of newly established corridors. Overall, there is a clear need to better understand the factors underlying site fidelity and exploration behaviour.
Here we suggest that the quality of the habitat (as indexed by habitat selection) made available to the elephants in the new section and the fact that the herds regularly used the area close to the fence, have facilitated the rapid discovery and use of the LGR by all the herds. It may, however, simply be that the elephants incorporated the area as it is small (1612 hectares) in relation to the elephant herds’ seasonal home ranges (mean wet and dry season home range sizes: 126.7 km2 and 107.4 km2). Yet, in the study by Druce et al. (Reference Druce, Pretorius and Slotow2007) in the same reserve, the elephants did not incorporate a small section (3850 hectares) that was opened adjacent to the elephants’ home ranges. The elephants visited this area a few months after the fence was removed (Druce et al. Reference Druce, Pretorius and Slotow2007) but now 15 years on, they still have not incorporated it (see Fig. 5). This suggests that the elephants probably use habitat quality as a key driver when utilizing and incorporating newly available areas and do not simply move into areas because they are available.
We acknowledge that this remains a tentative explanation due to the very low sample size of the study. This limitation was mostly imposed by the small size of the population, with virtually the whole female segment of the population monitored. Yet, we believe that studies on rare and endangered species, for which area expansion might be critical, will often be constrained by population size and financial or logistical constraints. If so, the depth and robustness of our global knowledge will likely arise from the multiplicity of studies with small sample size like ours. We therefore call for publication of these studies, to avoid knowledge loss due to file-drawer effects or publication in grey literature. Also, when possible, systematic reviews or comparison between very similar situations (like the comparison between our study and the one from Druce et al. Reference Druce, Pretorius and Slotow2007) may improve, or at least challenge, our understanding.
In human-modified landscape, space is a limiting factor for many animals, particularly for large, wide-ranging species such as elephants. The addition of space within protected areas is currently a common practice to try to overcome this, and thus to try to maintain a sustainable population and ecosystem. However, we do not know how successful these measures may be as we do not know how long it takes animals to find new areas. By suggesting what factors could have influenced the discovery and the use of a new area by elephants, our study joins others to fill this research gap and thus to help managers of protected areas to reach their conservation aims.
Supplementary material
To view supplementary material for this article, please visit https://doi.org/10.1017/S0266467420000097
Acknowledgements
We are thankful to Phinda Private Game Reserve for providing logistical support and for sharing their historical data. S. Chamaillé-Jammes was partially supported by grant ANR-16-CE02-0001-01 from the French ‘Agence Nationale de la Recherche’. An anonymous reviewer provided useful suggestions.