INTRODUCTION
Epiphytes can strongly increase the retention of atmospheric water and mineral nutrients by tropical forests (Bruijnzeel et al. Reference BRUIJNZEEL, MULLIGAN and SCATENA2011, Cavelier et al. Reference CAVELIER, JARAMILLO, SOLIS and DE LEON1997, Holwerda et al. Reference HOLWERDA, BRUIJNZEEL, MUNOZ-VILLERS, EQUIHUA and ASBJORNSEN2010, Tobón et al. Reference TOBÓN, KÖHLER, FRUMAU, BRUIJNZEEL, BURKARD, SCHMID, Bruijnzeel, Scatena and Hamilton2010, Umana & Wanek Reference UMANA and WANEK2010). Epiphytic biomass can account for over 80% of non-woody canopy biomass (Nadkarni et al. Reference NADKARNI, SCHAEFER, MATELSON and SOLANO2004) and store up to 50 Mg ha−1 of water (Pócs Reference PÓCS1980). By increasing the spatial heterogeneity of canopy throughfall, epiphytes may even drive niche availability and recruitment of terrestrial plants (Oesker et al. Reference OESKER, DALITZ, HOMEIER, BRUIJNZEEL, Bruijnzeel, Scatena and Hamilton2010, Zimmermann et al. Reference ZIMMERMANN, WILCKE and ELSENBEER2007).
Moist-forest epiphytes typically show marked succession as primary twigs grow in diameter and age, with lichens pioneering before bryophytes become dominant, which in turn form substrates vital for the establishment of most pteridophytes and angiosperms (Dudgeon Reference DUDGEON1923, Zotz & Vollrath Reference ZOTZ and VOLLRATH2003). While these successional changes along the entire twig–branch trajectory have often been addressed in terms of diversity, they have rarely been quantified with respect to biomass (but see Hsu et al. Reference HSU, HORNG and KUO2002, Nadkarni et al. Reference NADKARNI, SCHAEFER, MATELSON and SOLANO2004). At the stand level, epiphytes attain their greatest diversity and abundance in wet tropical montane forests, where moderate temperatures coupled with constantly high humidity favour the growth of epiphytes and the accumulation of dead organic matter (Birch & Friend Reference BIRCH and FRIEND1956, Gentry & Dodson Reference GENTRY and DODSON1987, Kreft et al. Reference KREFT, KÖSTER, KÜPER, NIEDER and BARTHLOTT2004). However, even among moist montane forests, reported epiphytic biomass ranges from 2 (Pócs Reference PÓCS1980) to as much as 44 Mg of biomass ha−1 (Hofstede et al. Reference HOFSTEDE, WOLF and BENZING1993; see also Köhler et al. Reference KÖHLER, TOBÓN, FRUMAU and BRUIJNZEEL2007, Wolf Reference WOLF1995). This variability is not well understood, and large-scale geographical patterns of epiphytic biomass remain unclear. It is also uncertain to what extent the amount and composition of epiphytic biomass may vary with topography at the local scale.
In many tropical mountains, forest structure changes strikingly from ravines and valley bottoms to ridges (Homeier et al. Reference HOMEIER, BRECKLE, GÜNTER, ROLLENBECK and LEUSCHNER2010, Takuya et al. Reference TAKUYA, AIBA and KITAYAMA2002). This physiognomic divergence is related to several major environmental gradients (e.g. soil nutrient status, wind turbulence; Bellingham & Tanner Reference BELLINGHAM and TANNER2000, Oesker et al. Reference OESKER, DALITZ, GÜNTHER, HOMEIER, MATEZKI, Beck, Bendix, Kottke, Makeschin and Mosandl2008). Although epiphytes are not directly linked to soil characteristics such as water and nutrient availability, they are linked indirectly via throughfall and litter quality, stand dynamics and microclimate. Because epiphytic biomass accumulates slowly (Nadkarni Reference NADKARNI2000), high tree turnover rates should limit the accumulation of large epiphytic biomass (Tanner Reference TANNER1980). Stand structure (e.g. canopy height, leaf area index (LAI)) affects both quantity and quality of epiphyte substrates and modifies wind penetration, air humidity and the availability of light (Motzer Reference MOTZER2005). Forest microclimate is also affected by variation in above-canopy climate (mesoclimate) that results from greater exposure of ridges to wind, fog and solar radiation as compared with sheltered ravines.
The purpose of this paper is to determine the spatial distribution of epiphytic biomass, its key components (lichens, bryophytes, pteridophytes, angiosperms, dead organic matter) and their contribution to stand-level biomass at a lower montane tropical Andean site. In particular, our study compares three adjacent forest types along a topographic gradient. Stand height, LAI and tree turnover in this forest area decline markedly from ravines towards ridges (Homeier et al. Reference HOMEIER, BRECKLE, GÜNTER, ROLLENBECK and LEUSCHNER2010). Since high light availability and low tree turnover should promote the accumulation of epiphytic matter, we expected biomass to be greatest along ridges.
METHODS
Study site
Field work was done in old-growth montane moist forest at Reserva Biológica San Francisco (RBSF; c. 1000 ha, ranging from 1800–3150 m asl) in Zamora-Chinchipe Province, south-east Ecuador (3°58′S, 79°04′W). Precipitation at 1960 m averages 2080 mm y−1, mean temperature and air humidity are 15.5 °C and 86%, respectively. Fog is infrequent. A gentle dry season averaging 1 mo with < 100 mm of rain usually extends from c. October to February (see Bendix et al. Reference BENDIX, ROLLENBECK, RICHTER, FABIAN, EMCK, Beck, Bendix, Kottke, Makeschin and Mosandl2008, Emck Reference EMCK2007 for details).
The area is highly diverse in epiphytes, with some 1250 species of epiphytic lichen, bryophyte and vascular plant recorded for the RBSF (Liede & Breckle Reference LIEDE and BRECKLE2007). Ravine forest has a dense canopy of 20–25 m in height and only shares a small percentage of tree species with ridge forest, which is relatively open and stunted (8–12 m tall). Mid-slope forest is intermediate in terms of tree species composition and structure (canopy height 12–18 m). Concurrent with soil nutrient concentrations, tree basal area increment and turnover decrease strongly from ravines to ridges (Homeier et al. Reference HOMEIER, WERNER, GRADSTEIN, BRECKLE, RICHTER, Beck, Bendix, Kottke, Makeschin and Mosandl2008, Reference HOMEIER, BRECKLE, GÜNTER, ROLLENBECK and LEUSCHNER2010; Wilcke et al. Reference WILCKE, OELMANN, SCHMITT, VALAREZO, ZECH and HOMEIER2008).
Sampling and analysis
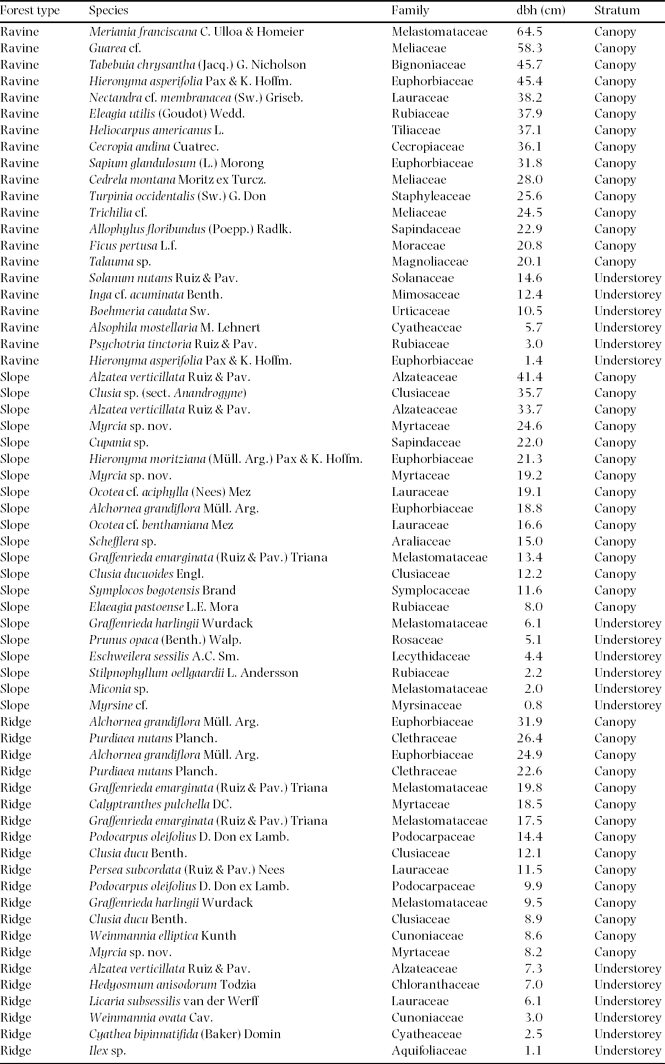
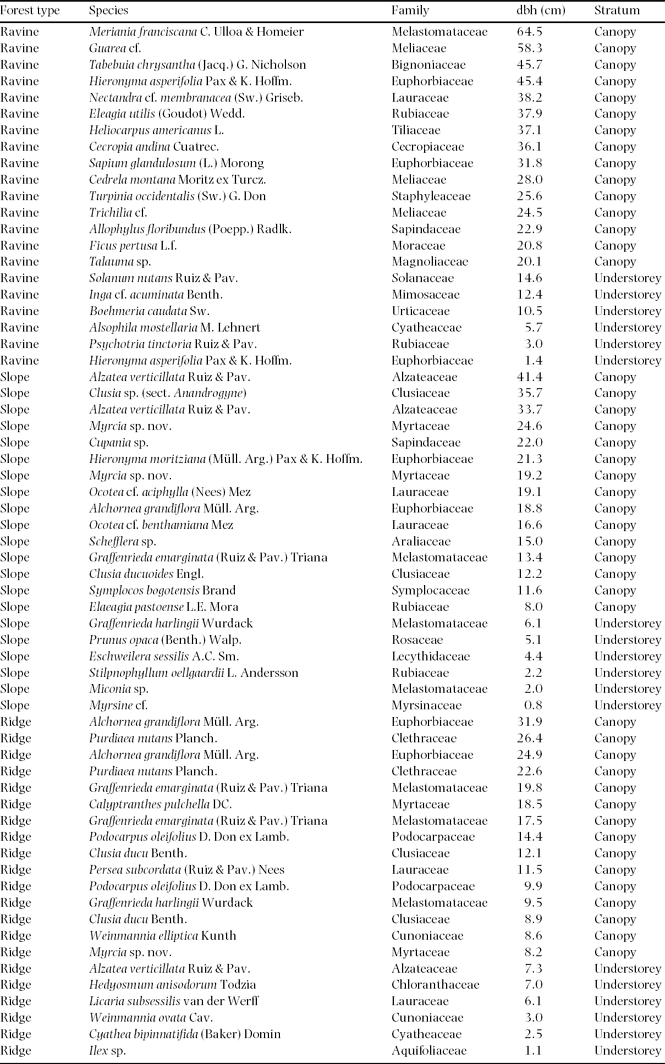
We sampled epiphytic biomass from 63 trees which were selectively felled in the course of an experiment on sustainable forest management in June–July 2004 (Günter et al. Reference GÜNTER, CABRERA, WEBER, STIMM, ZIMMERMANN, FIEDLER, KNUTH, BOY, WILCKE, IOST, MAKESCHIN, WERNER, GRADSTEIN, MOSANDL, Beck, Bendix, Kottke, Makeschin and Mosandl2008) in two neighbouring micro-catchments. Fifteen canopy and subcanopy trees of various size classes were randomly selected in ravine forest (2000–2100 m asl), mid-slope forest (2050–2150 m) and ridge-top forest (2100–2200 m). Six additional understorey treelets per forest type (mostly saplings; Appendix 1) were sampled exclusively for the projection of epiphytic biomass to area. Trees that had suffered damage from felling were omitted. Extensive data on the local tree species composition (Homeier et al. Reference HOMEIER, BRECKLE, GÜNTER, ROLLENBECK and LEUSCHNER2010) suggest that our samples were representative of the local tree communities (Appendix 1).
We distinguished six substrate classes: twigs (0–2 cm diameter), thin branches (>2–5 cm), medium-sized branches (>5–10 cm), large branches (>10–20 cm), major limbs (>20 cm) and trunks. Sampled substrate sections ranged from 10 cm (trunks and larger branches) to 100 cm (twigs) in length. Where applicable, we randomly took biomass samples from all diameter classes of three major branches per tree (one from upper, mid- and lower canopy each). In trunks, one sample was taken from base, mid-section and upper section each. We visually estimated the total length of twigs/branches within each branch class of a sampling tree to allow for an extrapolation of total biomass per tree, while trunk lengths were measured with a tape.
In total, 710 samples were taken, transferred in plastic bags to the field station Estación Científica San Francisco, and separated in the laboratory. We distinguished between bryophytes, macrolichens (foliose and fruticose growth types), pteridophytes, angiosperms and dead organic (biological) matter (DBM henceforth; canopy humus and epiphyte litter). Samples were oven-dried to constant weight at 70 °C and weighed with an electronic balance (Navigator, Ohaus, Pine Brook, NJ, USA). In order to project our data to forest area, we measured the diameter at breast height (dbh) for all tree trunks of dbh ≥5 cm in 18 plots of 20 × 20 m, six each in ravine, slope and ridge position. These plots were set up in mature forest stands at 1960–2210 m within RBSF.
Prior to analysis we divided raw sample dry weights by sample area (cylinder length × perimeter) and averaged all replicates of a given substrate class of individual trees. We did not distinguish between regular branch sections and forks. Comparisons between forest types were done through ANCOVA with mean substrate diameter as a covariate and subsequent correction for false discovery rate (FDR; Benjamini & Hochberg Reference BENJAMINI and HOCHBERG1995). We calculated the epiphytic biomass of each sampled tree by multiplying mean biomass values of each substrate class by the respective surface areas of the tree. For every forest type we then fitted linear functions with zero intercept to the relationship between tree basal area and individual epiphytic biomass components (lichens, bryophytes, vascular plants, DBM) of a given tree (Wolf et al. Reference WOLF, GRADSTEIN and NADKARNI2009). Because pteridophytes yielded poor fits they were lumped with angiosperms for this purpose. These linear functions allowed us to project our biomass data to forest area by applying them to quantitative size class distributions of each plot after correction for slope inclination.
We used wet–dry ratios ((wet weight − dry weight)/dry weight) of bryophyte weights provided by Kürschner & Parolly (Reference KÜRSCHNER and PAROLLY2004) for the three forest types under study (ravine forest: 7.04; slope forest: 6.89; ridge forest: 5.27) to project the water storage capacity of epiphytic bryophytes to forest area. Using one-way ANOVA we compared forest types in terms of bryophyte water storage capacity. Statistics were done with Statistica 8 (ANOVA; Statsoft, Tulsa, OK, USA) and R 2.13.0 (regression analysis; R Development Core Team, Vienna, http://www.R-project.org/).
RESULTS
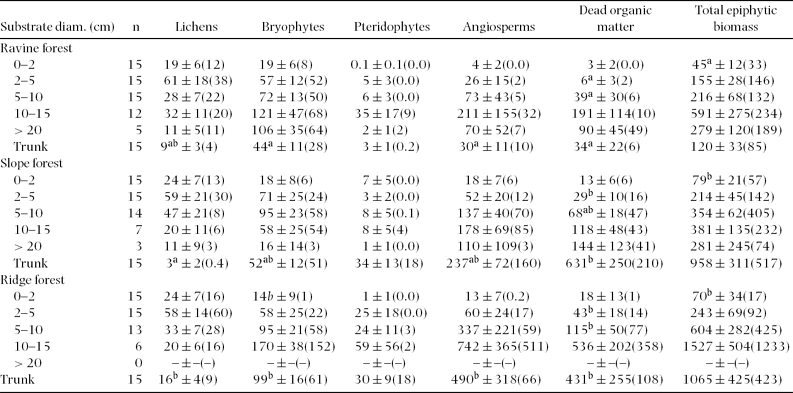
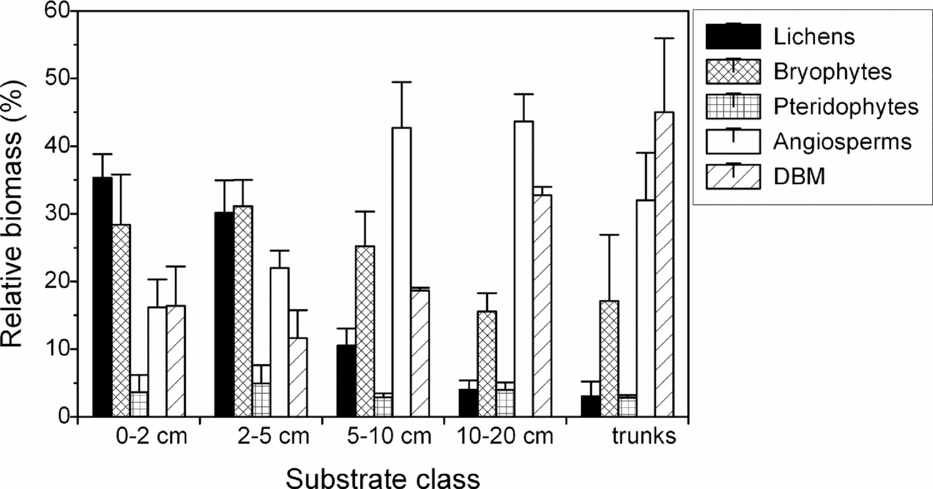
Total biomass density consistently increased with branch diameter from the outer to the inner crown. This pattern was apparent for all individual components except for lichens, which instead peaked on thin branches of 2–5 cm diameter. Highest biomass density of angiosperms and DBM was found on branches of 10–20 cm diameter (ravine forest) or on trunks (slope and ridge forest; Table 1). In relative terms, the contribution of lichens to total biomass was greatest on twigs ≤2 cm, bryophytes peaked on thin branches of 2–5 cm, angiosperms on branches of 10–20 cm diameter, and DBM on trunks (Figure 1).
Table 1. Epiphytic biomass (g m−2 substrate surface) in three adjacent montane forest types in south-east Ecuador. Given is the mean ± SE (median). Biomass data for branches is ordered by diameter class, while data for trunks are treated as ‘trunks’ irrespective of diameter. Different superscript letters mark parameters showing significant differences (P < 0.05; Scheffé post hoc tests following ANCOVA) between forest types after false discovery rate correction. Note that branches > 20 cm diameter were not tested for significant differences.
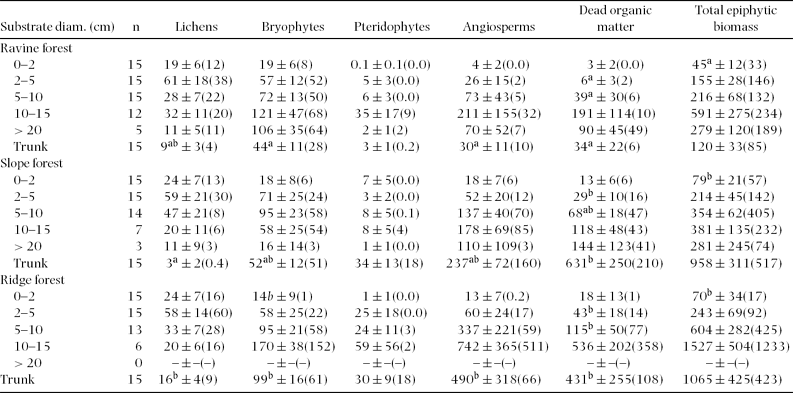
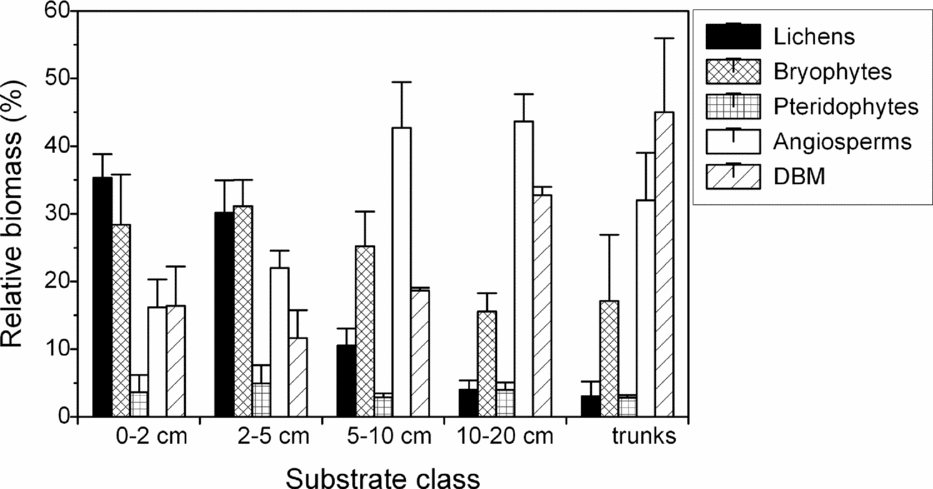
Figure 1. The relative contribution of individual biomass components (macrolichens, bryophytes, pteridophytes, angiosperms, dead organic matter (DBM)) to total epiphytic biomass in lower montane forest, south-east Ecuador. Shown are mean ± SE of three adjacent forest types in ridge, slope and ravine position. Biomass data for branches is ordered by diameter class, data for trunks are treated as ‘trunks’ irrespective of diameter. Absolute values are shown in Table 1.
Epiphytic biomass tended to be highest in ridge forest and lowest in ravine forest and slope forest, but patterns were variable among substrate classes with regard to several biomass components. Generally, greatest differences between forest types were found for trunks, which showed significantly different biomass densities of lichens, bryophytes, angiosperms and DBM (Table 1). Related to high variability, branches only exhibited statistically significant differences in terms of DBM (branch diameters 2–5 and 5–10 cm) and total epiphytic biomass (twigs < 2 cm).
In all forest types, total epiphytic biomass and most of its individual components (except pteridophytes in slope forest) were closely related to tree size. A linear model provided a better fit to the relationship of epiphytic biomass with tree basal area (Figure 2; Table 2) than with dbh. Extrapolation to stand level yielded total epiphytic biomass values (mean ± SD) of 2.6 ± 0.7 Mg ha−1 for ravine forest, 6.3 ± 1.1 Mg ha−1 for slope forest and 4.4 ± 1.6 Mg ha−1 for ridge forest (Table 3). These differences were significant (one-way ANOVA F2,15 = 14.7, P = 0.0002), with total biomass in ravine forest being lower than in slope forest (Scheffé post hoc test: P = 0.0003) and in ridge forest (P = 0.04), whereas slope and ridge forest did not differ significantly (P = 0.06). While some individual biomass components (lichens, angiosperms, DBM) also showed highest biomass in slope forest, bryophytes tended to have somewhat higher mean biomass in ravines, and pteridophytes on ridges (Table 3).
Table 2. Coefficients from linear regression (y = mx) of epiphytic biomass versus tree basal area in three adjacent montane forest types in south-east Ecuador. All regressions yielded significant relationships (P < 0.001).

Table 3. Tree basal area and estimates of epiphytic biomass (kg ha−1) across three adjacent forest types of south-east Ecuador, based on the regression slope of epiphytic biomass versus tree basal area (Table 2). Given is the mean ± SD from six plots; the range of the 2.5–97.5% confidence interval of the estimate is added in parentheses. Different superscript letters indicate significant differences between forest types (ANOVA and Scheffé post hoc test; P < 0.05).


Figure 2. The relationship of total epiphytic biomass (macrolichens, bryophytes, pteridophytes, angiosperms and dead organic matter) in relation with tree size (basal area) in three adjacent lower montane forest types in south-eastern Ecuador (n = 21 trees). Linear regression equations are given in Table 2.
Maximum water storage capacity of bryophytes was 0.52 ± 0.14 mm in ravines (mean ± SD), 0.36 ± 0.06 mm on slopes and 0.30 ± 0.10 mm along ridges. These differences were statistically significant (ANOVA F2,15 = 9.3, P = 0.002) with water storage capacity being significantly higher in ravine forest than in forest on slopes (Scheffé test: P = 0.02) and ridges (P = 0.003).
DISCUSSION
Local sources of variability in epiphytic biomass
The present study considers three sources of variability for the quality and quantity of epiphytic biomass: substrate diameter (within-tree variability), tree size and topographic position. Our results show that all three spatial or spatio-temporal levels add substantially to the high spatial heterogeneity of epiphyte distribution in the study area.
Composition and overall quantity of epiphytic biomass were closely related to the diameter (and thus age) of substrate classes within a given tree, tree size and forest type. Our study thus corroborates the successional addition and (partial) replacement of lichens by bryophytes, pteridophytes, angiosperms and finally DBM along the twig–branch–trunk trajectory (Freiberg & Freiberg Reference FREIBERG and FREIBERG2000, Hsu et al. Reference HSU, HORNG and KUO2002, Köhler et al. Reference KÖHLER, TOBÓN, FRUMAU and BRUIJNZEEL2007). While angiosperms and DBM require a long time to build up and greatly benefit from the presence of bryophytes as substrates (Zotz & Vollrath Reference ZOTZ and VOLLRATH2003), many lichens are successful primary colonizers that thrive under the strong exposure to light and desiccation that characterize the twigs of the outer canopy (Sipman & Harris Reference SIPMAN, HARRIS, Lieth and Werger1989). Overall, biomass density was rather low compared with other neotropical montane sites (compare compilation by Freiberg & Freiberg Reference FREIBERG and FREIBERG2000). As expected, epiphytic biomass increased strongly with tree size. Hsu et al. (Reference HSU, HORNG and KUO2002) found a linear relationship of epiphytic biomass with tree dbh. Our own biomass data, in contrast, showed a linear relationship with tree basal area or log-transformed dbh (data not shown; see Chen et al. Reference CHEN, LIU and WANG2010, Wolf et al. Reference WOLF, GRADSTEIN and NADKARNI2009 for corresponding results). Such would also be expected on theoretical grounds, since tree surface area is correlated more closely with basal area than with dbh (West et al. Reference WEST, BROWN and ENQUIST1999).
Although the relationship between tree size and epiphyte load was similarly steep for ridge forest and slope forest (Figure 2), total epiphytic biomass of the former was lower due to the scarcity of large trees (biomass ridge: 4.4 Mg ha−1; slope: 6.3 Mg ha−1). However, these differences were not significant (P = 0.06). Ravine forest, in contrast, had significantly and substantially lower epiphytic biomass (2.6 t ha−1) than stands on adjacent slopes, despite higher bark surface area available for epiphyte growth. We suggest that epiphyte growth in ravine forest is limited by low light availability as a consequence of extensive shading from the sheltered terrain position and a dense upper canopy. The low light levels in ravines and on lower slopes also promote the formation of straight trunks, which form poor-quality substrates for epiphytes. Moreover, the high tree turnover in this relatively productive forest type (Homeier Reference HOMEIER2004, Homeier et al. Reference HOMEIER, BRECKLE, GÜNTER, ROLLENBECK and LEUSCHNER2010) counteracts the accumulation of epiphytic matter (Tanner Reference TANNER1980). Differences in biomass along the topographic gradient were most pronounced with respect to DBM, which increased strongly from ravine forest through slope forest to ridge forest (Table 1). This gradient is closely paralleled by DBM accumulation in the organic layer of terrestrial soil (Wolf et al. in press). In contrast, soil nutrient availability, litter quality and decomposition decrease from ravines to ridges (Homeier et al. Reference HOMEIER, BRECKLE, GÜNTER, ROLLENBECK and LEUSCHNER2010, Wolf et al. in press). This pattern suggests that the increasing accumulation of terrestrial DBM near ridges results from slow mineralization of poor-quality litter (Homeier & Werner, unpubl. data), and the same may also apply to epiphytic DBM.
Although our sample size was large compared to most other studies on epiphytic biomass, our results are constrained by the inherently high spatial heterogeneity of epiphytic matter, even within branch classes of single forest types (Table 1). In particular, uncertainty arises from imperfect correlations between tree-size and biomass (Table 2) and resulting extrapolations (Table 3), but also from the visual estimation of bark surface area.
Our estimates for bryophyte maximum water storage capacity (0.3–0.5 mm) are substantially below those by Kürschner & Parolly (Reference KÜRSCHNER and PAROLLY2004) made for closely corresponding forest types in the same area (3.6–9.5 mm). While maximum water storage capacities used for calculations are identical, and tree surface estimates very similar between the two studies, the bryophyte densities (g m−2 bark surface) of Kürschner & Parolly (Reference KÜRSCHNER and PAROLLY2004) are much higher than in our study. Our water storage estimates are also distinctly below those of mossy cloud forests in Puerto Rico (3.6–6.1 mm; Weaver Reference WEAVER1972), Costa Rica (5.0–5.2 mm; Köhler et al. Reference KÖHLER, TOBÓN, FRUMAU and BRUIJNZEEL2007, Tobón et al. Reference TOBÓN, KÖHLER, FRUMAU, BRUIJNZEEL, BURKARD, SCHMID, Bruijnzeel, Scatena and Hamilton2010) or Tanzania (5.0 mm; Pócs Reference PÓCS1980), but similar to a Costa Rican montane forest little affected by fog (0.8 mm; Hölscher et al. Reference HÖLSCHER, KÖHLER, VAN DIJK and BRUIJNZEEL2004).
Transregional context
Our epiphytic biomass values are within the lower range of other moist montane tropical sites (Figure 3), showing that high diversity of epiphytes (Liede & Breckle Reference LIEDE and BRECKLE2007, Nöske et al. Reference NÖSKE, HILT, WERNER, BREHM, FIEDLER, SIPMAN and GRADSTEIN2008) is not necessarily coupled with high epiphyte biomass density. Multiple regression analysis of potential epiphytic biomass predictors available for the studies compared in Figure 3 (elevation, stand height, precipitation, an index of aridity (precipitation/potential evapotranspiration), incidence of fog) did not yield a significant model (results not shown). Clearly, the available number of studies from tropical forests remains too low to untangle a complex set of predictors. Particularly scarce are data from the Old World, moist lowland forests, montane forests other than cloud forests, and seasonally dry woodlands as a whole. Nonetheless, the data suggest a key role of moisture availability. Epiphytic biomass at our site was similar to another study from a montane non-cloud forest (Edwards & Grubb Reference EDWARDS and GRUBB1977), whereas several forests frequently submersed in clouds greatly exceeded these values, confirming that regular fog can boost epiphytic biomass (Figure 3). Humidity is widely considered a key predictor for the development of epiphyte communities in temperate (Díaz et al. Reference DÍAZ, SIEVING, PEÑA-FOXON, LARRAÍN and ARMESTO2010, McCune Reference MCCUNE1993) and tropical forests (Kreft et al. Reference KREFT, KÖSTER, KÜPER, NIEDER and BARTHLOTT2004, Werner & Gradstein Reference WERNER and GRADSTEIN2009; see also Tanner Reference TANNER1980, Weaver Reference WEAVER1972). However, while a general positive effect of moisture on epiphytic biomass accumulation is reasonably evident, the influence of sheer quantity, quality and seasonality of water input and periods of drought remains unclear. Several of the study sites shown in Figure 3 even lack basic information on the seasonality of rainfall, and the contributions of wind-driven rain and fog to overall water inputs are unknown but for few sites. More case studies on epiphytic biomass, especially in conjunction with sound climate data, will help in understanding how epiphytic biomass is distributed across tropical landscapes and how it will respond to global climate change.

Figure 3. Total epiphytic biomass of mature tropical forests in relation to elevation. Open symbols: cloud forest sites, filled symbols: forests not regularly submersed in clouds. Data points representing the present study are shown as triangles. Omitted are studies that do not consider all major biomass components. Data points (region, mean canopy height (m), mean annual precipitation (m), reference) as follows: 1 = east Brazil, 28, 3.0 (Mackensen et al. Reference MACKENSEN, TILLERY-STEVENS, KLINGE and FÖLSTER2000); 2 = south Venezuela, 20, 3.6, (Klinge & Herrera Reference KLINGE and HERRERA1983); 3 = north-east Taiwan, 12, 3.6 (Hsu et al. Reference HSU, HORNG and KUO2002); 4 = Puerto Rico (windward slope), 12, 5.3 (Weaver Reference WEAVER1972); 5 = Puerto Rico (leeward slope), 3, 5.3 (Weaver Reference WEAVER1972); 6 = Puerto Rico (ridge top), 3, 5.3 (Weaver Reference WEAVER1972); 7 = Tanzania, 40, 2.3 (Pócs Reference PÓCS1980); 8 = Costa Rica, 23, 3.2 (Nadkarni et al. Reference NADKARNI, SCHAEFER, MATELSON and SOLANO2004); 9 = Costa Rica, 24, 6.0 (Köhler et al. Reference KÖHLER, TOBÓN, FRUMAU and BRUIJNZEEL2007); 10 = Costa Rica, 10, 2.5 (Nadkarni Reference NADKARNI1984); 11 = south-east Ecuador (ravine), 23, 2.1 (this study); 12 = south-east Ecuador (slope), 14, 2.1 (this study); 13 = Tanzania, 5, 3.0 (Pócs Reference PÓCS1980); 14 = south-east Ecuador (ridge), 9, 2.1 (this study); 15 = Papua New Guinea, 30, 4.0 (Edwards & Grubb Reference EDWARDS and GRUBB1977); 16 = south-west China, 6, 1.9 (Chen et al. Reference CHEN, LIU and WANG2010); 17 = Costa Rica, 33, 3.1 (Köhler Reference KÖHLER2002); 18 = south Colombia, 22, 1.5 (Veneklaas et al. Reference VENEKLAAS, ZAGT, VAN LEERDAM, VAN EK, BROEKHOVEN and VAN GENDEREN1990); 19 = south Colombia, 13, 1.3 (Hofstede et al. Reference HOFSTEDE, WOLF and BENZING1993).
Conclusions
Our study shows that three sources of heterogeneity (branch diameter, tree size, topographic position and resulting differences in stand structure) strongly affect quantity and quality of epiphytic biomass in tropical forests. The significant differences in amount and composition of epiphytic matter between adjacent forest types have general implications for resource availability to other canopy biota, and the cycling of water and nutrients. Although our study could not differentiate between direct effects of slope position (nutrient availability, mesoclimate) and indirect effects (stand structure and dynamics), it provides evidence that fine-scale topography needs to be taken into account when extrapolating epiphytic biomass and related matter fluxes from stand-level data to regional scale.
ACKNOWLEDGEMENTS
We thank Ute Knörr, Daniela Sellbrink and Fabian Schröder for their excellent help with field and laboratory work, and Sven Günter for the good cooperation. Lars Köhler, Tamás Pócs, Ed Tanner and Pete Weaver provided valuable additional information on their studies. Comments by Sampurno Bruijnzeel significantly improved the manuscript. Funding was provided by the Deutsche Forschungsgemeinschaft (DFG) within the framework of research unit FOR 402. FAW acknowledges a PhD scholarship by the German Academic Exchange Service (DAAD) and a grant from IdeaWild. This is publication no. 257 of the Yanayacu Natural History Research Group.
Appendix 1. Host trees sampled for epiphytic biomass in three adjacent forest types in montane south-east Ecuador.
